Abstract
Background and Objectives
To examine the relationship between transcranial Doppler (TCD) mean flow velocity (MFV) and the severity and temporal onset of neurotoxicity after chimeric antigen receptor (CAR) T-cell therapy in patients with relapsed lymphoma.
Methods
We identified a cohort of 165 patients with relapsed or refractory B-cell lymphoma who received CAR T-cell therapy. TCDs were performed at baseline, treatment day 5, and throughout hospitalization based on development of neurologic symptoms. We assessed the percent change in velocity from baseline in each of the 6 major supratentorial arteries and the relationship of these values to development and timing of neurotoxicity.
Results
Our cohort was 30% female with an average age of 60 years. Of patients with TCDs performed, 63% developed neurotoxicity, and 32% had severe neurotoxicity. The median time of neurotoxicity onset was day 7. Higher maximum percent change in MFV across all vessels was significantly associated with likelihood of developing neurotoxicity (p = 0.0002) and associated with severe neurotoxicity (p = 0.0421). We found that with increased percent change in MFV, the strength of correlation between day of TCD velocity change and day of neurotoxicity onset increased. There was no single vessel in which increase in MFV was associated with neurotoxicity.
Discussion
Our study demonstrates an association between increase in TCD MFV and the development of neurotoxicity, as well as timing of neurotoxicity onset. We believe that TCD ultrasound may be used as a bedside functional biomarker in CAR T-cell patients and may guide immunologic interventions to manage toxicity in this complex patient group.

The treatment of hematologic malignancies has been transformed by chimeric antigen receptor (CAR) T-cell therapy.1,2 However, more widespread adoption of this therapy has been limited in part by treatment-associated toxicities of cytokine release syndrome (CRS) and neurotoxicity, also known as the immune effector cell–associated neurologic syndrome (ICANS).3
ICANS can be seen in more than half of patients with lymphoma treated with CAR T cells,2,4,5 with symptoms ranging from tremor, encephalopathy, and aphasia to cerebral edema and death. Discriminating ICANS from delirium and other causes of neurologic symptoms is challenging, as laboratory values are nonspecific, structural imaging is most often normal,6,7 and EEG typically demonstrates only nonspecific changes.8
Furthermore, the pathophysiology of ICANS is incompletely understood, and treatments used to treat CRS, such as IL-6 pathway antagonists, are often not effective6,9 and may even increase the risk of neurotoxicity.10 Biomarkers that aid in the accurate and timely diagnosis of ICANS may allow for earlier and more precise therapeutic intervention, reducing hospitalization time and improving long-term outcomes.
Transcranial Doppler (TCD) ultrasonography is a rapid and noninvasive imaging modality to assess flow and velocity in cerebral vasculature.11 We previously demonstrated that cerebral blood flow velocities were higher in CAR T-cell patients with focal neurologic deficits.8 The present study sought to more thoroughly examine the relationship of TCD mean flow velocity (MFV) and the severity and temporal onset of ICANS in a cohort of patients with B-cell lymphoma treated with CAR T cells.
Methods
Standard Protocol Approvals, Registrations, and Patient Consents
This study was approved by the Brigham and Women's Hospital Institutional Review Board (IRB Protocol# 2018P000227) and followed the Standards for Reporting of Diagnostic Accuracy reporting guideline. The need for informed consent was waived by the IRB because this was a retrospective study.
Data Collection
A cohort of patients admitted to Brigham and Women's Hospital/Dana Farber Cancer Institute for CAR T-cell therapy from April 2015 to May 2020 was identified. Briefly, for this study, we included all patients admitted for the treatment of relapsed or refractory B-cell lymphoma with CAR T cells who underwent at least 2 TCD studies as detailed below. Patients who had previously received CAR T-cells or were receiving treatment for a nonlymphomatous malignancy (leukemia, myeloma, or nonhematologic malignancy) were excluded. Complete medical inclusion/exclusion criteria have been detailed previously.8 All patients were assessed and followed prospectively by a neurologist regardless of neurologic symptoms. A protocolized and detailed neurologic assessment was performed daily by the primary oncology team, who had received training from a neurologist before their clinical involvement. This assessment included a detailed neurologic examination and CAR-T neurotoxicity numerical scoring daily. The presence or absence of symptoms based on clinician report, date of symptom onset, and severity of CRS and ICANS were documented. Neurotoxicity was graded by the Common Terminology Criteria for Adverse Events (CTCAE), version 4.03.12 The CTCAE scale was used given that this was the standard of care for assessment of CAR-T patients when enrollment of our patients began in 2015.13 Once published, the newer CAR T-Cell Therapy–Associated Toxicity (CARTOX) grading scale for CAR T-cell therapy–associated toxicity was also performed on all patients clinically, although CTCAE was used for data analysis in this study to preserve internal consistency across the cohort.
TCD ultrasound was performed on or around the date of CAR T-cell infusion (between days −1 and +3 relative to CAR T-cell infusion on day 0) and on treatment day 5. Some patients underwent surveillance TCD monitoring after day 5 or additional TCD measurements based on development of neurologic symptoms. TCD data were only included if the patient underwent at least 2 studies of which 1 served as baseline. TCD was performed by 3 trained and credentialed ultrasonography technicians who exclusively perform TCDs at our institution. Whenever possible, and in the vast majority of cases, the same TCD technician performed all TCDs on a given patient to minimize operator variation. TCDs were obtained using a dedicated TCD system and a 2-MHz handheld probe (Doppler-BoxX, Compumedics DWL, San Juan Capistrano, CA, or Lucid M1, NovaSignal Co, Los Angeles, CA). Each artery was assessed from the transtemporal window in 2-mm increments between the depths of 40–65 mm for the middle cerebral arteries (MCA), 60–80 mm for the anterior cerebral arteries (ACA), and 55–75 mm for the posterior cerebral arteries (PCA). According to local standard practice, we took as the MFV the time averaged mean maximum velocity. At least 3 velocity measurements were recorded from each vessel to minimize interference. Technicians reported the highest velocity captured for each vessel. If a signal was weak or too noisy, patients were excluded from further TCD measurements and therefore not included in this study. Patients without acoustic windows were not included in our study. Twenty-five patients had limited acoustic windows in one or more vessels, but the remaining vessels were included in the study and TCD velocities measured over time.
For each patient who had at least 2 TCD studies performed, we assessed the percent change in velocity from baseline in each of the 6 major supratentorial arteries (right and left ACA, MCA, and PCA). The maximum percent change in velocity in any vessel was noted for each patient, as well as the first date that the percent change in velocity in any vessel rose by 5%, 10%, 20%, 30%, 40%, and 50% above the baseline value.
Statistical Analysis
We performed univariate logistic regression between maximum percent change above baseline velocity in any vessel and the presence or absence of any neurotoxicity as well as the presence or absence of severe neurotoxicity (CTCAE grade ≥3). We used Pearson correlation coefficient to assess for the relationship between the date of neurotoxicity onset and the date at which change in velocity rose above a threshold value. A log-rank test was used to assess for differences between groups in a survival analysis. Last, the Pearson χ2 test was used to determine the likelihood of any deviation from chance in the anatomic pattern of maximum vessel velocity. Statistical significance was defined as α < 0.05 throughout, with Bonferroni correction used in the setting of multiple comparisons.
Data Availability
Anonymized data will be shared by request from any qualified investigator.
Results
Demographics
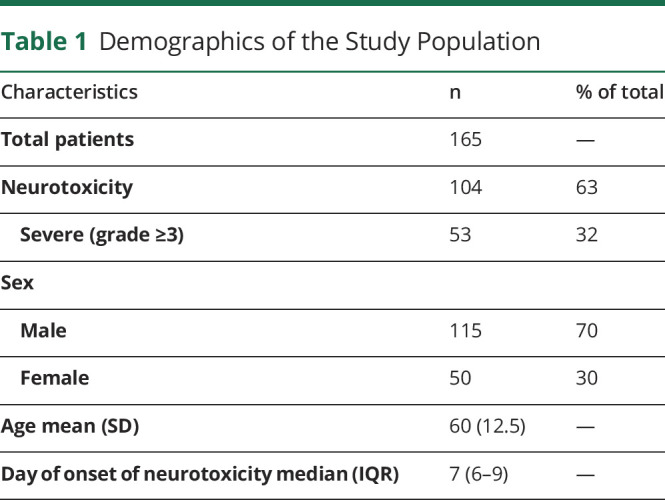
One hundred sixty-five sequential patients with relapsed or refractory B-cell lymphoma who received CAR T-cell therapy and had at least 2 TCD measurements during their hospitalization were identified. Our cohort was 30% female, with a mean age of 60 years (SD 12.5). Of patients with TCDs performed, 104 (63%) developed neurotoxicity. Of these, 53 (51%) had severe neurotoxicity (grade 3 or higher). The number of TCD measurements for each patient varied between 2 and 18 depending on the severity of symptoms and length of hospital stay. TCDs were performed throughout hospitalization from day 0 up to day 41 depending on the patient. The median day of neurotoxicity onset was day 7 after CAR T infusion (Table 1).
Table 1.
Demographics of the Study Population
TCD Velocities
Using the first TCD ultrasound study performed to establish baseline velocities for all patients, we calculated the percent velocity change in each supratentorial vessel (right and left ACA, MCA, and PCA) for each subsequent TCD study. Absolute TCD velocities at baseline for all patients and patients with and without neurotoxicity are available in eTable 1, links.lww.com/CPJ/A315.
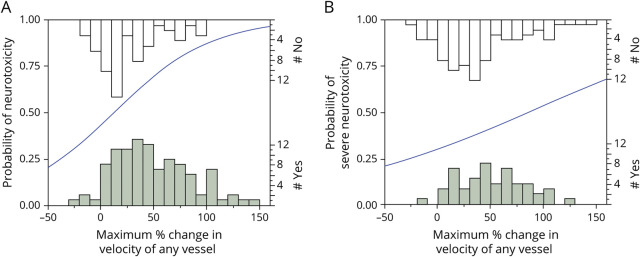
As a first test of the association between TCD velocity and neurotoxicity, we performed univariate logistic regression to assess for a relationship between the maximum percent change in velocity in any vessel on any date during hospitalization, and the development of neurotoxicity in each patient (Figure 1). We found a statistically significant relationship between maximum percent change in TCD velocity and likelihood of developing neurotoxicity (p = 0.0002) with an OR of 1.24 (95% confidence interval [CI]: 1.11–1.39) for every 10% increase in MFV. We found a similar though less robust relationship between the percent change in velocity and the occurrence of severe neurotoxicity (p = 0.0421) with an OR of 1.104 (95% CI: 1.004–1.215) for every 10% increase in MFV.
Figure 1. Association of Change in MFV and Neurotoxicity.
Regression analysis between the maximum percent change in MFV in any vessel at any point during hospitalization and the occurrence of (A) any grade neurotoxicity or (B) severe neurotoxicity (CTCAE grade ≥3). The left-sided Y-axes indicate the probability of (A) neurotoxicity or (B) severe neurotoxicity predicted by the univariate logistic regression model. The histograms along the bottom and top X axes indicate the number of patients with (shaded bars) or without (open bars) neurotoxicity or severe neurotoxicity at each MFV range; counts are indicated on the right-sided Y-axes. The blue line represents the best fit of the logistic regression analysis examining the probability that neurotoxicity (A) or severe neurotoxicity (B) will occur as a function of the maximum percent change in velocity of any vessel. A 10% increase in MFV had an OR of 1.24 (95% CI: 1.11–1.39, p = 0.0002, Wald χ2 test) for developing neurotoxicity and an OR of 1.104 (95% CI: 1.004–1.215, p = 0.0421, Wald χ2 test) for developing severe neurotoxicity. CTCAE = Common Terminology Criteria for Adverse Events; MFV = mean flow velocity.
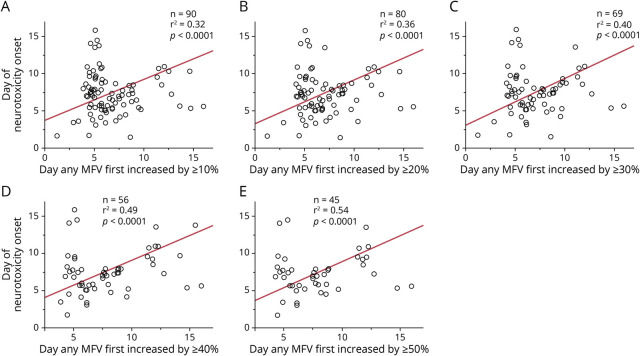
We next sought to determine whether there was a relationship between the timing of the change in TCD velocity and the day of onset of neurotoxicity. We quantified the Pearson correlation coefficient between the date that any vessel first had an increase in maximum velocity by 10%, 20%, 30%, 40%, and 50% above baseline for each patient and the date that each patient developed neurotoxicity. We found that the magnitude of the correlation (as quantified by the r2 statistic) between the day first reaching a given percent change in velocity and day of neurotoxicity onset increased monotonically with the magnitude of the threshold value applied (Figure 2). This suggests that with an increasing threshold, elevated TCD velocity is associated with a greater proportion of the variance of timing of neurotoxicity onset.
Figure 2. Correlation of Day of Change in MFV and Day of Neurotoxicity Onset.
Correlation between the day that TCDs first exceeded a threshold percent change in maximum MFV above baseline and day of onset of neurotoxicity, for 5 different thresholds. (A) Correlation between day of neurotoxicity onset and day that MFV first exceeded 10% elevation, n = 90, r2 = 0.32, p < 0.0001, t-test. (B) Correlation between day of neurotoxicity onset and day that MFV first exceeded 20% elevation, n = 80, r2 = 0.36, p < 0.0001, t test. (C) Correlation between day of neurotoxicity onset and day that MFV first exceeded 30% elevation, n = 69, r2 = 0.40, p < 0.0001, t test. (D) Correlation between day of neurotoxicity onset and day that MFV first exceeded 40% elevation, n = 56, r2 = 0.49, p < 0.0001, t test. (E) Correlation between day of neurotoxicity onset and day that MFV first exceeded 50% elevation, n = 45, r2 = 0.54, p < 0.0001, t test. MFV = mean flow velocity; TCD = transcranial Doppler.
We next performed a survival analysis to determine whether the percent change in maximum TCD velocity at any time point during hospitalization was related to the temporal course of neurotoxicity. The patients were broken into 3 groups: those with 20% or less rise in MFV, 20%–80% rise in MFV, or greater than 80% increase in MFV. There was a statistically significant relationship between TCD velocity cluster and likelihood of developing neurotoxicity (p < 0.0001, log-rank test), though from a qualitative evaluation of KM curves, no appreciable difference in the time to onset of neurotoxicity symptoms (Figure 3).
Figure 3. Relationship of Maximum Change in MFV and Timing of Neurotoxicity.
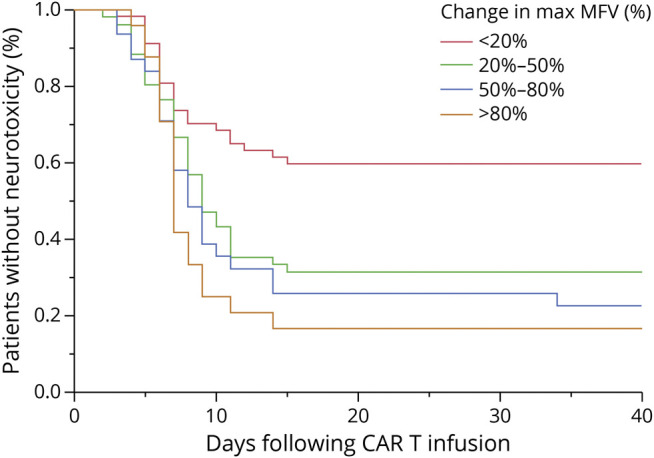
Kaplan-Meier curves demonstrating the relationship between the maximum percent rise in MFV and the timing of onset of and proportion of patients who develop neurotoxicity after CAR T infusion. Red curve shows patients with maximum percent rise in MFV above baseline of <20% (n = 57), green curve shows patients with maximum percent rise in MFV above baseline of 20%–50% (n = 52), blue curve shows patients with maximum percent rise in MFV above baseline of 50%–80% (n = 31), and orange curve shows patients with maximum percent rise in MFV above baseline of >80% (n = 25). There is a significant relationship between maximum MFV group and percentage of patients who develop neurotoxicity (p = 0.0004, log-rank test). CAR = chimeric antigen receptor; MFV = mean flow velocity.
Finally, we sought to identify whether change in MFV within 1 particular vessel was more commonly associated with the development of neurotoxicity (Figure 4). When assessed across all patients, the specific artery with maximum increase in MFV did not vary significantly from chance (p = 0.1212, Pearson χ2 test). Similarly, when examining only those patients who either did or did not develop neurotoxicity, after correcting for multiple comparisons, there was no significant variation in which artery demonstrated the maximum increase in MFV.
Figure 4. Intracranial Artery With Maximum MFV.
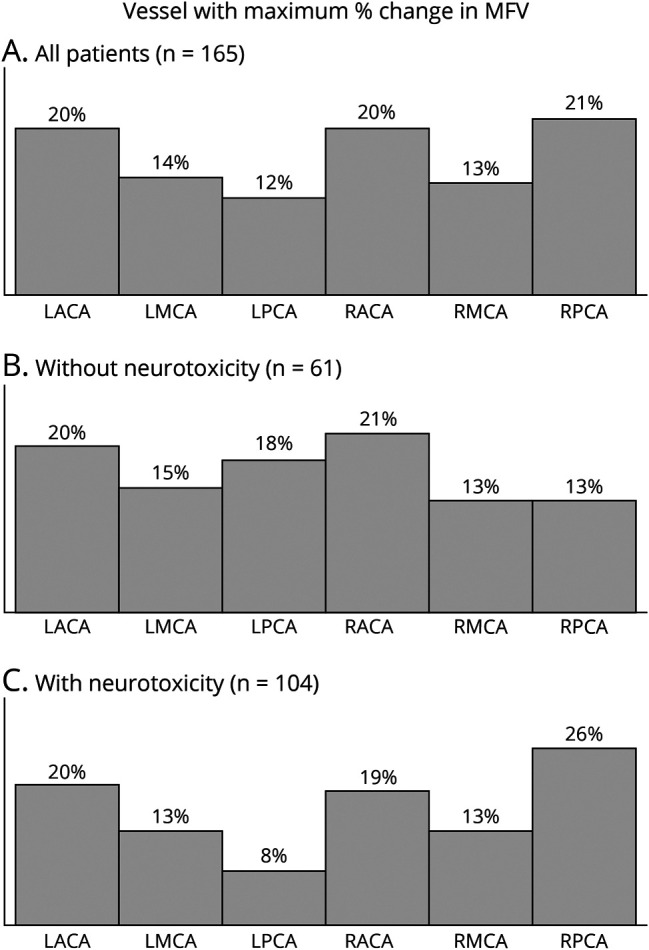
The artery demonstrating the maximum elevation in MFV identified in all patients (A), only patients without neurotoxicity (B), and only patients with neurotoxicity (C). After correcting for multiple comparisons, the frequency of which vessel demonstrated the maximum change in MFV was not significantly different from chance for any of the 3 groups (all patients: n = 165, p = 0.1212; neurotoxicity absent: n = 61, p = 0.8142; neurotoxicity present: n = 104, p = 0.0245; Pearson χ2 test). MFV = mean flow velocity.
Discussion
We assessed the relationship between change in TCD velocity and development of neurotoxicity at any point during hospitalization for a cohort of 165 patients with relapsed B-cell lymphoma and multiple TCD measurements, 104 of whom developed neurotoxicity. We found a significant relationship between MFV and the likelihood of developing any grade of neurotoxicity and severe neurotoxicity. We also identified a monotonic relationship between each threshold increase in TCD velocity change and the magnitude of the correlation between threshold crossing date and timing of neurotoxicity onset. We did not clearly identify 1 vessel that was more predictive of developing neurotoxicity.
Given these data, systematic TCD measurements may be a noninvasive and objective bedside tool to monitor CAR T-cell patients at increased risk of developing neurotoxicity at any point during hospitalization. Given prior data that demonstrate a possible association between reduced TCD flow velocity and delirium,14 and our study demonstrating an association of increased TCD velocity and neurotoxicity, TCDs may be a useful measure to differentiate between delirium and early neurotoxicity which is a common cause of clinical uncertainty in CAR T-cell patients. We would recommend obtaining baseline TCD measurements for patients undergoing CAR T-cell infusion, as well as TCD measurements at a later date during hospitalization with day 5 a reasonable choice given that the greatest rise in TCD velocity was seen on this date, and the average day of neurotoxicity onset is day 7 (Figure 2). Those with maximum velocity increases in any vessel, especially >20% from baseline, should be more closely monitored for change in neurologic status indicative of neurotoxicity.
Although survival data were beyond the scope of this study given that all patients had a treatment-refractory malignancy and there was variability in disease subtype, CAR T-cell construct, and comorbidities, we did examine the relationship between change in TCD velocity and duration of hospitalization as a surrogate marker for survival. We found a significant correlation (R2 = 0.064, p = 0.0011) between hospitalization length and maximum change in TCD velocity. Patients treated with CAR T-cell therapy at our institution are admitted with the intention of discharging to home on day 7 in the absence of any complications; patients hospitalized for longer than 7 days are those who developed complications from treatment requiring ongoing care and/or observation. Early identification of patients at risk for prolonged hospitalization may allow upfront for action to prevent this very significant negative short-term outcome that is associated with increased risk of hospital acquired infection, delirium, deconditioning, and other well-described sequelae of prolonged hospitalization. Monitoring increases in velocity in these patients may help alter decisions about management of neurologic symptoms and subsequent immunologic interventions, such as corticosteroids, which have the potential to worsen delirium and affect the efficacy of CAR T-cell therapy.
Elevated MFV on TCD ultrasound has been best validated as an indicator for vasospasm after subarachnoid hemorrhage. TCD sensitivity for vasospasm ranges from 48% to 67% depending on the vessel tested,15 and absolute MFV thresholds in the range of 120 cm/s to 200 cm/s in the middle cerebral artery (for mild to severe vasospasm, respectively) are commonly used to identify areas concerning for stenosis or vasospasm.16 The change in velocities seen in our study is not as dramatic as those seen in subarachnoid hemorrhage–associated vasospasm and therefore is unlikely to indicate that large central perfusion alterations are occurring during CAR T-cell neurotoxicity. Rather, we suspect that these alterations in velocity may be driven by regional fluctuations in cerebral metabolism (as has been demonstrated on FDG-PET)8 as a downstream effect of some as of yet incompletely defined pathophysiology. Although our data demonstrate a clear association between velocity increase and neurotoxicity, the pathophysiology and causality of these phenomena require further investigation.
TCD velocities can be affected by systemic factors, including hypoxia, hypercarbia, hypotension, and anemia. In our study, we tried to minimize confounding factors by comparing TCD measurements to a baseline value in each patient. In addition, in the vast majority of patients (84% of patients with neurotoxicity), the velocity changes were seen in only a subset of cerebral blood vessels, indicating that this change in velocity is not secondary to a systemic factor such as anemia or hypotension. In our prior work, which included a subset of the patients included in this data set, we found that TCD velocity was increased in a subset of patients with neurologic symptoms even when controlling for age, maximum temperature, maximum ferritin, minimum white blood count, and maximum C-reactive protein. We also found that measurements of hemoglobin were stable for 2 weeks after CAR-T infusion and therefore unlikely to explain the sudden and transient changes in TCD velocity seen in this work. In addition, we found that all patients in our study were febrile following CAR T-cell therapy, and this would therefore not explain the difference in TCD velocity seen in patients with and without neurotoxicity. Finally, although transient systemic changes including hypoxia or sleep could theoretically affect TCD velocities, the primary cutoff for change in velocity used in this work is 20%, which is greater than would be expected for minor systemic variations.
The major limitation to this study is that patients were enrolled over a 6-year period during which TCD ordering practices evolved at our institution. Patients were initially not monitored with TCDs at regularly defined intervals, leading to sampling at inconsistent time points between patients. Patients who presented later in the data collection period were therefore also more likely to have regular monitoring with multiple TCD measurements during their hospitalization and as a result more data points. We also do not have data for TCD velocities between the baseline day 0 and day 5 for most patients, given that the first TCD measurements were traditionally performed on day 5 of hospitalization unless neurologic symptoms developed. Similarly, patients were more likely to be monitored with TCDs once neurotoxicity had already developed, leading to increased sampling in these patients compared with those without neurotoxicity. During our 6-year enrollment period, grading scales for neurotoxicity also evolved, from the CTCAE scale to the CARTOX scale and Immune-effector Cell-Associated Encephalopathy (ICE) score.17 The CTCAE scale is limited in its ability to detect specific and subtle neurologic changes, and this was modified in the later CARTOX and ICE grading systems. However, given a need for a standardized outcome measurement in our study, we elected to use the CTCAE scale for all patients in our data set, though acknowledge here the limitations of this measurement tool. In addition, TCD is an operator-dependent technique. We sought to minimize operator variability by using only credentialed TCD ultrasound technicians and ensuring the same operator performed TCDs on each given patient, although we cannot exclude some amount of operator measurement variability. Finally, given limited patients who met the criteria, we were unable to separately evaluate only patients who developed neurotoxicity after a change in TCD velocity and therefore can show only an association rather than predictive value of increased TCD velocity and neurotoxicity. Finally, although TCD measurements are now part of the protocolized monitoring of all CAR-T patients at our institution and are used clinically for treatment decisions regarding immune-suppressing medications, we do not yet have objective prospective data on how this has influenced treatment or outcomes for CAR-T patients. Additional research is also needed to identify whether changes in specific cerebral vessels correlate with clinical symptoms and to determine whether these findings are limited to patients with B-cell lymphomas or generalizable to all patients following CAR T-cell therapy.
We believe that TCD ultrasound has the potential to be used as a functional biomarker in CAR T-cell patients, and even patients hospitalized for other neurologic conditions, as it allows clinicians to objectively quantify abnormal physiology in the absence of (and often prior to) the development of structural injury. TCDs can also be obtained daily at the bedside, allowing for an easily obtainable, noninvasive, trendable biomarker. Limitations of the TCD technique include restricted cranial windows to obtain measurements in some patients and variability between operators across institutions. However, with appropriate training, these factors can be standardized and should not impose barriers to the use of this diagnostic tool. We believe that TCDs have significant clinical utility and provide objective data to help inform complex decision making regarding when to initiate treatment of CAR-T neurotoxicity.
TAKE-HOME POINTS
→ Increase in TCD MFV compared with baseline is associated with increased likelihood of developing neurotoxicity in patients who received CAR-T therapy for relapsed B-cell lymphoma.
→ No single vessel is correlated with increased risk of neurotoxicity, although increases in MFV in patients with neurotoxicity are most often seen in only a subset of intracranial vessels.
→ TCD ultrasound measurements taken at admission and on day 5 may act as a bedside functional biomarker in CAR T-cell patients and may help guide decision making around length of hospital stay and immunologic interventions for neurotoxicity.
Appendix. Authors
Contributor Information
Daniel B. Rubin, Email: drubin4@mgh.harvard.edu.
Sarah LaRose, Email: slmichaud@bwh.harvard.edu.
Andrew Monk, Email: andrewdmonk@gmail.com.
Sarah Nikiforow, Email: sarah_nikiforow@dfci.harvard.edu.
Caron Jacobson, Email: caron_jacobson@dfci.harvard.edu.
Henrikas Vaitkevicius, Email: aa0374@gmail.com.
Study Funding
No targeted funding reported.
Disclosure
K. Holroyd reports no disclosures relevant to the manuscript. D. Rubin serves on the external advisory board for Celgene. S. LaRose reports no disclosures relevant to the manuscript. A. Monk reports that the collection and analysis of data was preformed while he was at Brigham and Women's Hospital; currently, he is employed by NovaSignal. S. Nikiforow has served on ad hoc advisory boards for Kite/Gilead, Novartis, and Nkarta. C. Jacobson reports personal fees from Kite/Gilead, personal fees from Novartis, personal fees from BMS/Celgene, personal fees from Nkarta, personal fees from Precision Biosciences, personal fees from Lonza during the conduct of the study, and personal fees from Abbvie, other from Pfizer, outside the submitted work. H. Vaitkevicius reports that the work was conceptualized and performed while he was at Brigham and Women's Hospital; currently, he is employed by Marinus Pharmaceuticals Inc. Full disclosure form information provided by the authors is available with the full text of this article at Neurology.org/cp.
References
- 1.Locke FL, Ghobadi A, Jacobson CA, et al. Long-term safety and activity of axicabtagene ciloleucel in refractory large B-cell lymphoma (ZUMA-1): a single-arm, multicentre, phase 1-2 trial. Lancet Oncol. 2019;20(1):31-42. [DOI] [PMC free article] [PubMed] [Google Scholar]
- 2.Wang M, Munoz J, Goy A, et al. KTE-X19 CAR T-cell therapy in relapsed or refractory mantle-cell lymphoma. N Engl J Med. 2020;382(14):1331-1342. [DOI] [PMC free article] [PubMed] [Google Scholar]
- 3.Lee DW, Santomasso BD, Locke FL, et al. ASTCT consensus grading for cytokine release syndrome and neurologic toxicity associated with immune effector cells. Biol Blood Marrow Transpl. 2019;25(4):625-638. [DOI] [PubMed] [Google Scholar]
- 4.Hirayama AV, Turtle CJ. Toxicities of CD19 CAR-T cell immunotherapy. Am J Hematol. 2019;94(suppl 1):S42–S49. [DOI] [PubMed] [Google Scholar]
- 5.Gust J, Taraseviciute A, Turtle CJ. Neurotoxicity associated with CD19-targeted CAR-T cell therapies. CNS Drugs. 2018;32(12):1091-1101. [DOI] [PMC free article] [PubMed] [Google Scholar]
- 6.Santomasso BD, Park JH, Salloum D, et al. Clinical and biological correlates of neurotoxicity associated with CAR T-cell therapy in patients with B-cell acute lymphoblastic leukemia. Cancer Discov. 2018;8(8):958-971. [DOI] [PMC free article] [PubMed] [Google Scholar]
- 7.Valand HA, Huda F, Tu RK. Chimeric antigen receptor T-cell therapy: what the neuroradiologist needs to know. AJNR Am J Neuroradiol. 2019;40(5):766-768. [DOI] [PMC free article] [PubMed] [Google Scholar]
- 8.Rubin DB, Danish HH, Ali AB, et al. Neurological toxicities associated with chimeric antigen receptor T-cell therapy. Brain. 2019;142(5):1334-1348. [DOI] [PubMed] [Google Scholar]
- 9.Brudno JN, Kochenderfer JN. Recent advances in CAR T-cell toxicity: mechanisms, manifestations and management. Blood Rev. 2019;34:45-55. [DOI] [PMC free article] [PubMed] [Google Scholar]
- 10.Lee DW, Gardner R, Porter DL, et al. Current concepts in the diagnosis and management of cytokine release syndrome. Blood. 2014;124(2):188-195. [DOI] [PMC free article] [PubMed] [Google Scholar]
- 11.Djelilovic-Vranic J, Basic-Kes V, Tiric-Campara M, Djozic E, Kulenovic J. Follow-up of vasospasm by transcranial Doppler sonography (TCD) in subarachnoid hemorrhage (SAH). Acta Inform Med Mar. 2017;25(1):14-18. [DOI] [PMC free article] [PubMed] [Google Scholar]
- 12.U.S.Department of Health and Human Services. Common Terminology Criteria for Adverse Events (CTCAE), Version 4.03. evs.nci.nih.gov/ftp1/CTCAE/CTCAE_4.03/CTCAE_4.03_2010-06-14_QuickReference_8.5x11.pdf (accessed 1 August, 2020). [Google Scholar]
- 13.Neelapu SS, Tummala S, Kebriaei P, et al. Chimeric antigen receptor T-cell therapy–assessment and management of toxicities. Nat Rev Clin Oncol. 2018;15(1):47-62. [DOI] [PMC free article] [PubMed] [Google Scholar]
- 14.Caplan GA, Lan Z, Newton L, Kvelde T, McVeigh C, Hill MA. Transcranial Doppler to measure cerebral blood flow in delirium superimposed on dementia. A cohort study. J Am Med Dir Assoc. 2014;15(5):355-360. [DOI] [PubMed] [Google Scholar]
- 15.Samagh N, Bhagat H, Jangra K. Monitoring cerebral vasospasm: how much can we rely on transcranial Doppler. J Anaesthesiol Clin Pharmacol. 2019;35(1):12-18. [DOI] [PMC free article] [PubMed] [Google Scholar]
- 16.Naqvi J, Yap KH, Ahmad G, Ghosh J. Transcranial Doppler ultrasound: a review of the physical principles and major applications in critical care. Int J Vasc Med. 2013;2013:629378. [DOI] [PMC free article] [PubMed] [Google Scholar]
- 17.Landry K, Thomas AA. Neurological complications of CAR T cell therapy. Curr Oncol Rep. 2020;22(8):83. [DOI] [PubMed] [Google Scholar]
Associated Data
This section collects any data citations, data availability statements, or supplementary materials included in this article.
Data Availability Statement
Anonymized data will be shared by request from any qualified investigator.


