Abstract
Background and Objectives
To determine the percentage of the healthy population that responds asymmetrically to the red desaturation test and to approximate the degree of red desaturation in those individuals. We also sought to elucidate any correlation between demographic variables and red desaturation prevalence and severity.
Methods
Adults aged 18 years and older with a normal eye examination, including confrontation fields and best-corrected visual acuity of ≥20/25 in both eyes, were eligible for this prevalence study. Those with objective or subjective afferent visual dysfunction were excluded. A total of 101 eligible participants (68.3% female and 31.7% male; racial/ethnic breakdown of 77.2% White, 11.9% Black, 8.9% Asian, 2.0% N/A; mean (SD) age: 41.5 (15.3) years) were queried whether the monocular perception of redness of a standardized tropicamide bottle cap was the same and to estimate the interocular percentage difference, with 1 eye perceiving the bottle cap at “100% redness.”
Results
Twenty-four participants (23.8%) experienced some degree of red desaturation. For these individuals with red desaturation, the average interocular difference was 9.0% (range 2%–25%, 95% confidence interval 6.0%–12.0%). There was no statistical evidence for a relationship between red desaturation and race, sex, or age.
Discussion
This study shows that nearly a quarter of healthy patients without apparent optic nerve or macular dysfunction may recognize red desaturation. This deserves consideration when interpreting red desaturation testing in patients suspected to have unilateral optic neuropathy. Further research with larger sample sizes may identify predictors of red desaturation in healthy patients, establish the red desaturation threshold separating pathologic from physiologic phenomena, and assess the repeatability of red desaturation over time in affected individuals.
Optic neuritis is an acute inflammatory demyelinating optic neuropathy, which is commonly associated with multiple sclerosis, as well as certain inflammatory and infectious diseases. The typical clinical presentation of optic neuritis is monocular and involves visual deficits in acuity, contrast sensitivity, visual field, and color vision. Abnormal color vision, as determined by Ishihara plates and the Farnsworth-Munsell 100 hue test, occurred in 88% and 94%, respectively, of patients with optic neuritis in the acute phase, and a significant fraction of patients still report some degree of abnormal color vision after recovering spatial vision.1 The red desaturation test involves the patient monocularly comparing the intensity of a standard red color, such as the red cap of a medication bottle, to evaluate for subjective interocular differences in red color perception.2 In the absence of formal color vision testing, red desaturation is commonly performed in suspected optic neuritis cases. Patients with an underlying monocular optic neuropathy often report that red-colored objects appear “washed-out” or faded when viewed in the affected eye.
The percentage of the healthy population that experiences red desaturation is poorly studied. This knowledge would aid our understanding of the specificity of the red desaturation test in indicating optic neuropathy. We sought to determine the percentage of the healthy population that responded asymmetrically to this simple red desaturation test and to approximate the degree of red desaturation in those individuals. We also studied the association of red desaturation with race, sex, and age.
Methods
Study Design
In this prevalence study of red desaturation in a healthy population, patients were seen between August 2019 and January 2020 by an optometrist or ophthalmologist at the University of Minnesota (UMN). Eligible healthy patients at a routine eye examination were queried at the end of their visit to participate in our brief study for research purposes. If they agreed, they were tested for red desaturation.
Standard Protocol Approvals, Registrations, and Patient Consents
The UMN Institutional Review Board approved this prevalence study. All methods adhered to the Health Insurance Portability and Accountability Act of 1996 regulations and the Declaration of Helsinki. Informed consent was waived for this study of negligible risk because of concerns about biasing the patient's answers related to red desaturation.
Inclusion and Exclusion Criteria
An age of 18 years or older, normal visual confrontation fields, and visual acuity of 20/25 or better in both eyes constituted the inclusion criteria. Patients who possessed any history of eye disease in either eye based on patient history or eye examination, including but not limited to color blindness and afferent visual disease, or patients with a current psychiatric or mental health condition that rendered them mentally incompetent to participate in our questionnaire, were excluded from this study. Patients with symmetric lens color and opalescence less than or equal to grade 1 or 2 or symmetric intraocular lens implants were included.
Clinical Variables
To test for red desaturation, the clinician held out a bottle of tropicamide medication with a standard red color top and asked the patient to monocularly assess the color of the bottle cap and report whether the cap looked the same color comparing each eye. If the patient observed an interocular difference in red color perception, they were asked to quantify the intensity of the red color in the “affected” eye, comparing with the contralateral eye to be considered 100% intensity. Patients then received a description of the study and the research questions. In addition to the patient's answers regarding red desaturation, their age, race, and sex were recorded.
Outcome Endpoints
The main objective was to determine the prevalence of red desaturation in the healthy population, as well as the degree of perceived asymmetry in the affected population. A secondary objective was to determine any association between red desaturation—either prevalence or severity—and demographic variables such as sex, race, and age.
Statistical Analyses
For a variety of possible red desaturation prevalence values, the requisite sample size for our study was determined by calculating the number of participants needed to ensure that the lower bound of a 95% confidence interval (CI) for red desaturation prevalence would be 0%. The patient characteristics in our sample were first analyzed by calculating percentages for categorical variables sex and race, while age was expressed as the mean with SD and range. The presence of red desaturation was a categorical variable and was expressed as a percentage of the total sample, whereas the degree of red desaturation in the affected subpopulation was expressed as the mean with a 95% CI. For this latter variable, we conducted a t test to examine the null hypothesis that the percent red desaturation of this subpopulation was equal to a certain value (e.g., 5%). To compare patient characteristics between symmetric and asymmetric red desaturation patients, the Fisher exact test was used for the categorical variables race and sex. Odds ratios (ORs) are presented with 95% CIs. A linear regression was performed on age vs presence of red desaturation, and a t test was performed to examine the null hypothesis that the coefficient was equal to 0. In analyzing the subpopulation with an asymmetric red desaturation result, the degree of red desaturation was compared between different sexes and racial groups using a t test. A linear regression was performed on the degree of red desaturation vs age, and a t test was performed on the coefficient to similarly examine the null hypothesis. All tests for statistical significance were 2-tailed, and a p value of <0.05 denoted statistical significance. All statistical analyses were performed using SAS version 9.3 (SAS Institute Inc., Cary, NC).
Data Availability
Anonymized data can be made available by request to any of the investigators who participated in this study under the agreement that the purpose is for replicating procedures and results in this report and that all data transfer is compliant with the relevant data protection regulations.
Results
Sample Size Estimation
For possible red desaturation prevalence values of 2%, 3%, 5%, and 10%, sample sizes of 222, 152, 95, and 50, respectively, would be required to ensure that the lower bound of the 95% CI for red desaturation prevalence was equal to 0%. Given the clinical expertise of several of the authors, it was thus predicted that as many as 150–200 participants could be needed, although the study could be stopped before this point if it became obvious that the estimated red desaturation prevalence was in fact noticeably higher than 2%–3%.
Patient Characteristics
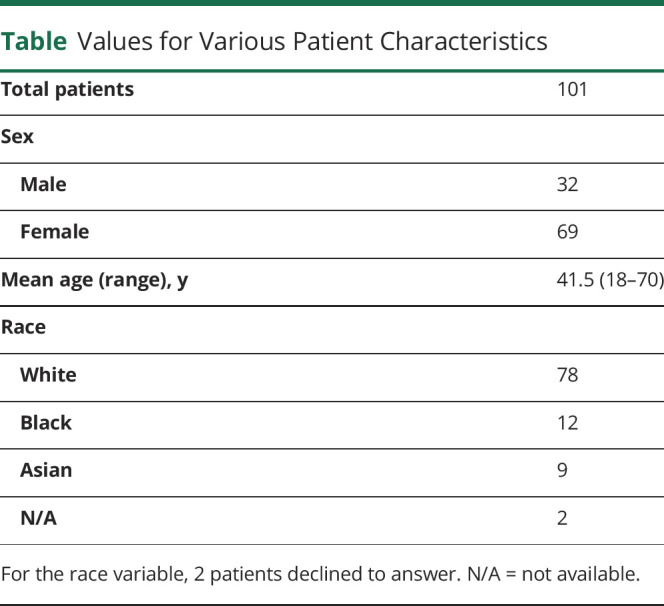
Of 101 healthy participants queried, 32 (31.7%) and 69 [68.3%] were women, and the racial/ethnic breakdown was 78 [77.2%], 12 [11.9%], 9 [8.9%], and 2 [2.0%] identified as White, Black, Asian and N/A, respectively. The mean (SD) age was 41.5 (15.3) years [range: 18-70 years] (Table). No one declined participation in the study.
Table.
Values for Various Patient Characteristics
Main Objective: Determination of Red Desaturation Prevalence and Severity in the Healthy Population
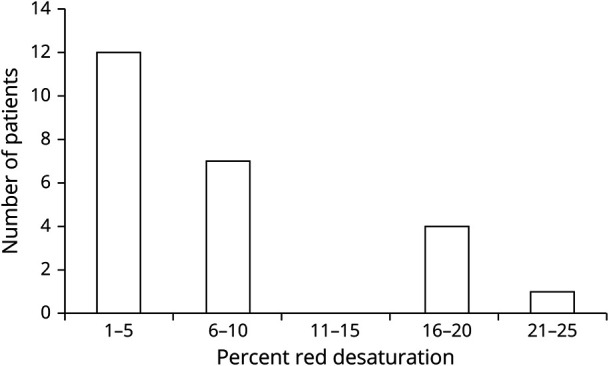
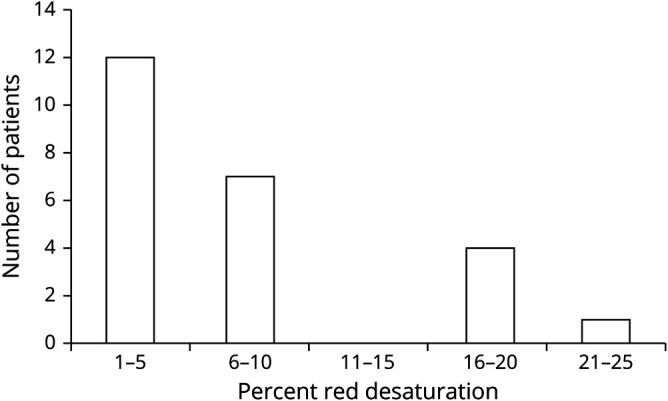
Twenty-four healthy patients (23.8%) reported some degree of red desaturation. Of these 24 individuals, 16 (66.7%) had an affected left eye, 16 [66.7%] were female and 8 [33.3%] were male, and the mean (SD) age was 44.1 (16.8) years [range: 19-68 years]. Broken down by race/ethnicity, 18 [75.0%], 3 [12.5%], 2 [8.3%] and 1 [4.2%] were identified as White, Black, Asian and N/A. The average interocular difference in these 24 individuals was 9.0% with a 95% CI of 6.0%–12.0% (range 2%–25%). Twelve of these patients (50.0%) experienced a red desaturation of 1%–5% (Figure 1). In evaluating these 24 individuals, the null hypothesis that red desaturation is 5 is rejected (p = 0.011), but a null hypothesis that red desaturation is equal to 10% cannot be rejected (p = 0.49).
Figure 1. Histogram of Percent Red Desaturation in Affected Individuals.
Secondary Objective: Evaluation of the Correlation Between Red Desaturation and Sex, Race, or Age
There was no statistically significant relationship between the likelihood of having an asymmetric response to the red desaturation test and sex (female vs male OR = 1.10; 95% CI 0.42–2.93) or race (White vs underrepresented racial and ethnic groups (UREGs) OR = 0.74; 95% CI 0.27–2.07). Similarly, although those with red desaturation were on average 3.48 years (95% CI −3.60 to 10.55 years) older than those with no red desaturation, the difference was not statistically meaningful. Of the individuals with red desaturation, there was no statistically significant relationship between sex (Figure 2), race (Figure 3), or age (Figure 4) and the degree of percent red desaturation. Males and females had a mean percent red desaturation of 11.9% (95% CI 8.2%–15.5%) and 7.6% (95% CI 3.9%–11.2%), respectively (p = 0.16). UREGs and White individuals had a mean percent red desaturation of 10.4% (95% CI 4.8%–16.0%) and 8.9% (95% CI 5.5%–12.4%), respectively (p = 0.69). The coefficient from a linear regression fit to the data mapping percent red desaturation vs age was +0.085 (95% CI −0.094 to 2.55), indicating larger percent red desaturation with older age, but the significance was not meaningful.
Figure 2. Percent Red Desaturation as a Function of Sex.
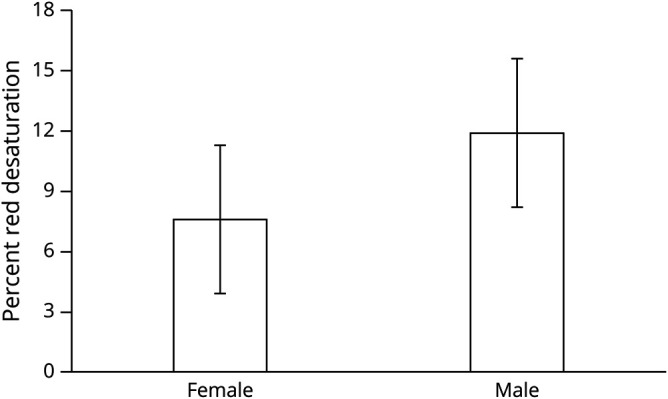
Although men had a higher average percent red desaturation, this difference was not statistically significant (p = 0.16). Error bars shown are 95% confidence intervals.
Figure 3. Percent Red Desaturation as a Function of Race.
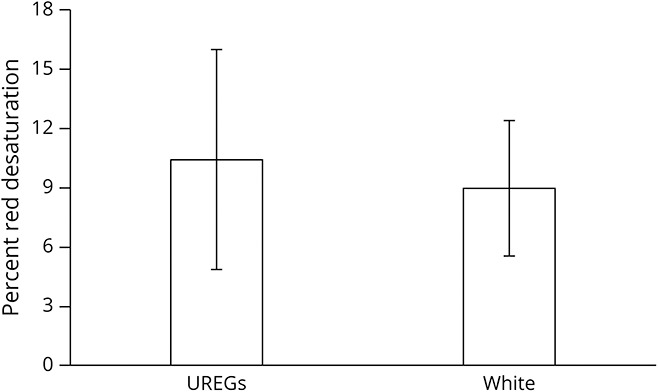
Although underrepresented racial and ethnic group (UREG) status was associated with a higher average percent red desaturation, this difference was not statistically significant (p = 0.69). Error bars shown are 95% confidence intervals.
Figure 4. Percent Red Desaturation vs Age.
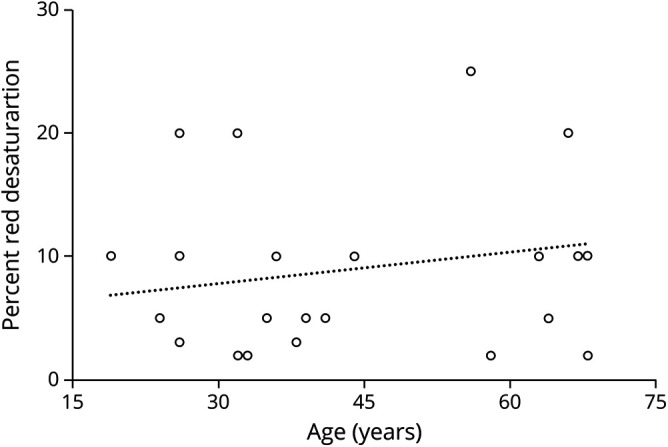
Increased age was very weakly associated with increased percent red desaturation, with a coefficient of 0.09 and a correlation coefficient of 0.04 from linear regression. However, this correlation was not statistically significant (p = 0.34).
Discussion
This is the first study, to our knowledge, to use the standard red bottle cap test to explicitly investigate the prevalence and severity of red desaturation in the healthy population, as well any correlation with demographic variables. A previous study, which used a PowerPoint presentation with a slide deck of red squares of varying desaturation, demonstrated that asymmetric red desaturation was far more severe in patients with optic neuritis compared with healthy controls.3 Although the healthy controls on average had low, even negligible, red desaturation scores, the range provided by the authors suggested some healthy patients had a degree of asymmetry. That study gave both eyes the opportunity to see a red color simultaneously and compare them contemporaneously. We chose monocular viewing similar to commonly performed testing in a clinical setting. Our estimate of the prevalence of asymmetrical red desaturation in the healthy population (nearly 24%) is striking, as the medical community clinically practices under the assumption that number is close to 0. The severity in this subgroup—9% on average and up to 25% in 1 case—is similarly significant. This clinical knowledge might be useful when interpreting the results of red desaturation tests for patients suspect for optic nerve abnormalities, as a positive test result perhaps does not necessarily indicate underlying pathology.
We hypothesized that subtle interocular differences in lens status could at least partially explain our surprising findings related to red desaturation. A total of 33.3% and 26.0% of the patients in our study with and without red desaturation, respectively, also presented with some form of lens pathology. Two cases of bilateral posterior chamber intraocular lenses and 1 case of bilateral nuclear sclerotic cataract with a 2+ grade were observed in the population without red desaturation. All other instances of lens pathology, in either the symmetrical or asymmetric red desaturation subpopulations, involved nuclear sclerotic cataracts with trace or 1+ grade, the majority of which were bilateral and symmetric. These findings suggest it is unlikely that the unexpectedly high rate of asymmetric red desaturation can be explained by interocular differences in lens status.
It is unclear why normal individuals without symptoms or findings of optic neuropathy would experience red desaturation. Numerous participants independently volunteered that their red desaturation was lifelong. It is conceivable that subtle, subclinical interocular differences in the condition of the macula or retinal nerve fiber layer could potentially explain our results, but this analysis was beyond the scope of our study.
Our study of 101 total patients—24 with red desaturation—is likely of insufficient size to confidently characterize any correlation between red desaturation and the demographic variables of age, sex, and race. Future research should expand the sample size to more accurately assess these relationships, if they exist. In addition, although we observed a meaningful fraction of the healthy population with a non-zero level of red desaturation, we did not similarly investigate the severity of asymmetry in a comparison group with underlying optic nerve pathology. Further research should be conducted with the red bottle cap test to compare results for healthy individuals vs those with optic neuritis to better determine a reliable threshold of red desaturation that reliably differentiates pathologic vs physiologic phenomena. Finally, there is a question as to the stability of red desaturation over time. Patient response could be variable on a given day based on physiologic changes or the patient's reliability in reporting accurate red desaturation percentage values. This study asked patients to verify their answers on one particular day but did not account for possible day-to-day fluctuations. Thus, large studies that evaluate red desaturation in the same sample on different days should be undertaken.
TAKE-HOME POINTS
→ Nearly 24% of the healthy population exhibited some degree of asymmetric red desaturation in a prevalence study with 101 participants.
→ The average degree of interocular red desaturation in these affected individuals was 9%.
→ There was no statistically significant relationship between red desaturation and race, sex, or age, although this could be related to the relatively small sample size in this study.
Acknowledgment
The authors thank Wendy Elasky for her work coordinating their study with the IRB.
Appendix. Authors

Study Funding
No targeted funding reported.
Disclosure
In relation to this manuscript, the authors have no financial interests, individual or family investments, stock or business ownerships, consulting, retainers, patents, other commercial interests, or involvement in the marketing of any product, drug, instrument, or piece of equipment discussed in the manuscript that could cause, or be perceived to be, a conflict of interest. Full disclosure form information provided by the authors is available with the full text of this article at Neurology.org/cp.
References
- 1.Optic Neuritis Study Group. The clinical profile of optic neuritis. Experience of the Optic Neuritis Treatment Trial. Arch Ophthalmol. 1991;109:1673-1678. [DOI] [PubMed] [Google Scholar]
- 2.Basic and Clinical Science Course, American Academy of Ophthalmology (AAO) (2008–2009) Neuro-Ophthalmology, San Francisco. Section 5:91-95. [Google Scholar]
- 3.A simple computer program to quantify red desaturation in patients with optic neuritis. Graefes Arch Clin Exp Ophthalmol. 2014;252:1305-1308. [DOI] [PubMed] [Google Scholar]
Associated Data
This section collects any data citations, data availability statements, or supplementary materials included in this article.
Data Availability Statement
Anonymized data can be made available by request to any of the investigators who participated in this study under the agreement that the purpose is for replicating procedures and results in this report and that all data transfer is compliant with the relevant data protection regulations.


