

Abstract
Background
Acetaminophen (APAP)-associated transaminase elevation, induced by N-acetyl-p-benzoquinone imine (NAPQI) protein adduction, remains an area of research interest. Distinct from known genetic, physiologic, and dosage associations dictating severity of hepatic injury, no known factors predict an absence of protein adduct formation at therapeutic APAP dosing.
Hypothesis
Sex-based physiology is predictive of APAP-induced protein adduct formation and differential metabolite expression at therapeutic doses.
Methods
This retrospective study interrogated serum samples collected for a prior study investigating fluctuations of alanine aminotransferase (ALT) over time with 4G daily APAP dosing for ≥ 16 days in subjects from Denver, Colorado. Subjects were grouped by adduct formation (n = 184) vs no adducts (n = 20). Samples were run on ultra-high-performance liquid chromatography mass spectrometry from study days 0, 7, 16, and 31. Significant metabolite expressions were identified using t-tests with false discovery rate correction (FDR), partial least squares discriminant, and ANOVA simultaneous comparison analyses. Demographic and clinical data were explored using t-tests with FDR (age, weight, BMI, ALT) and Chi-square (sex, ethnicity, race) analyses.
Results
In pre-treatment samples, relative quantitation caprylic acid was expressed ninefold higher and 6-carboxyhexanoate was expressed threefold lower in subjects who did not develop adducts. Lactate had greater expression in the no adducts group (p = 0.001). Using absolute quantitation, glutathione was expressed 2.6-fold greater among no adduct subjects. Odds of males developing NAPQI protein adducts at therapeutic APAP dosing were 5.91 times lower than females (95% CI = 2.3–14.9; p = 0.0001).
Conclusion
Multiple metabolites were differentially expressed based on adduct group and sex. Metabolites were identified unique to adduct development independent of sex. At therapeutic APAP dosing, males were less likely to develop APAP protein adducts. Further research into lipid biosynthesis and metabolism may provide further insight into physiology associated with adduct production.
Supplementary Information
The online version contains supplementary material available at 10.1007/s13181-022-00903-5.
Keywords: Acetaminophen, Adducts, Hepatotoxicity, Metabolomics, Therapeutic, Tylenol
Introduction
Acetaminophen cysteine protein adducts (APAP-cys) have been used to identify acetaminophen (APAP) exposure in the setting of overdose [1–3]. After overdose, protein adducts form when APAP oxidizes to form the reactive metabolite N-acetyl-p-benzoquinone imine (NAPQI). NAPQI overwhelms glutathione supply and the unbound NAPQI quickly binds to cysteine residues in hepatocytes to produce APAP-cys protein adducts. Although elevated concentrations of protein adducts are released with cellular necrosis and hepatotoxicity, the presence of these adducts does not equate to toxicity since these adducts are detectable in serum even at therapeutic doses. The APAP-cys concentrations associated with APAP-induced liver injury are above 1.1 umol l−1, which are 10 times the levels noted at therapeutic acetaminophen concentrations in most patients, though some patients develop levels approaching 1 umol l−1[4, 5].
APAP-cys concentrations vary between individuals following therapeutic dosing and females seem to have higher values compared to males [5]. The mechanisms of sex-based differences in adduct formation are unclear; patient weight, dose, and CYP2E1 activity do not seem to explain these differences.
Urine metabolites appear to correlate with APAP-induced liver toxicity and to predict adverse events early in dosing [6]. For example, taurine and trimethylamine oxide concentrations measured prior to a single toxic threshold APAP dose correlated with histopathological damage in Sprague–Dawley rats [7]. Additionally, increased glycine concentrations at days 5–6 and 9–10 were found to correlate with ALT elevations in humans [8]. However, these same metabolites have not been correlated with APAP-cys in humans.
Understanding the mechanisms of variable adduct formation can help to set diagnostic discriminatory concentrations and may aid in clinical interpretation of APAP-cys concentrations. We sought to examine the mechanisms of sex-based differences in APAP-cys adduct production using metabolomics to further elucidate the biologic pathways associated with adduct formation.
Methods
Study Design
We performed secondary metabolomic analyses from serum samples collected from a parent study describing the course of alanine aminotransferase (ALT) concentrations in subjects receiving therapeutic dosing of APAP for at least 16 days (NCT00743093) (Fig. 1) [9]. Subjects were instructed to take two 500 mg tablets every 4 h for four doses each day; start time varied from day to day, but four-hour intervals were consistent, and subjects documented this in a study diary. They also recorded all other medications taken and any alcohol consumption throughout the study period. We verified compliance by study diary and pill counts at each study visit and metabolite detection in this study. In addition to the diaries, clinical parameters collected included: race, ethnicity, age, sex, body mass index (BMI), significant medical history, and adverse drug events (as outlined in the U.S. Food and Drug Administration, FDA 21 312.32 Code of Federal regulations) [10]. We stored samples at -80 ºC after blood chemistry analysis.
Fig. 1.

Study flow diagram
Subject Enrollment and Phenotype Stratification
The parent study and this metabolomic analysis were approved by the Colorado Multiple Institutional Review Board and followed the ethical Declaration of Helsinki. The study population for this secondary analysis consisted of the same inclusion and exclusion criteria as the parent study. Briefly, subjects were recruited from the Denver, Colorado community and were > 18 years of age. We excluded subjects with APAP use within four days preceding study initiation, new medications started within the month prior, clinical laboratory work suggestive of impaired liver function, increased alcohol consumption, or inability to give informed consent[9]. We drew blood on study days 0 (baseline, pre-APAP administration), 4, 7, 10, 16, and 31. Blood chemistry values collected at each visit include: ALT, alkaline phosphatase (ALKP), international normalized ratio (INR), total protein, albumin, total and direct bilirubin, aspartate transaminase (AST), and triglycerides. Samples chosen for analysis came from subjects in the treatment arm of the parent study. Subjects were grouped by adduct vs no adduct formation, with subjects defined as having adducts if they had adducts detected on the study days in which metabolomic analyses were performed (study day 0, 7, 10, 16, or 31). No adducts were defined as below the limit of detection of the assay (0.03 uM).
Metabolite Extraction and Identification
Samples were prepared for ultra-high performance liquid chromatography mass spectrometry (UHPLC–MS) metabolomics as previously described [11]. Briefly, we extracted metabolites from serum (20 mL) in ice-cold lysis/extraction solution (methanol:acetonitrile:water 5:3:2 v/v/v) at a 1:25 dilution. We added isotopically labeled standards at expected biological concentrations to the lysis buffer for absolute quantitation. Samples were agitated (30 min 4 ºC) and centrifuged (18,213_g, 10 min, 4 ºC). Protein pellets were discarded. Supernatants were diluted 1:1 using 10 mM ammonium and stored at -80 ºC prior to metabolomic analyses. We injected plasma extracts into a Thermo Vanquish UHPLC system (San Jose, CA) coupled to a Thermo Q Exactive mass spectrometer with electrospray ionization (Bremen, Germany). Metabolites were separated on a Kinetex C18 column (150_2.1 mm, 1.7 m—Phenomenex, Torrance, CA) at 45 ºC using a five-minute gradient method [12] at 450 mL/min and mobile phases (A: water/0.1% formic acid; B: acetonitrile/ 0.1% formic acid) for positive ion mode. Negative ion mode used the same five-minute gradient method at 450 mL, with the following changes: 1 mM ammonium acetate (NH4OAc) substituted for 0.1% formic acid (A: 95/5 water/acetonitrile 1 mM NH4OAc; B: 5/95 water/acetonitrile 1 mM NH4OAc). Solvent gradient: 0–0.5 min 0% B; 0.5–1.1 min 0–100% B, 1.1–2.75 min hold at 100% B, 2.75–3 min 100–0% B, 3–5 min hold at 0% B. We generated quality controls from pooled aliquots of extracts and ran them every 10 analytical runs to control for technical variability, as judged by coefficients of variation. To correct for technical variability, quantitative measurements across samples were normalized against quality controls through the software MetaboDrift [13]. We identified and validated 164 metabolites as previously described [14, 15].
Metabolomic Statistical Analyses
Supervised targeted analyses were completed using MetaboAnalyst (Version 4.0) [16] to identify significant differences in baseline metabolomes between subjects who developed APAP-cys adducts and those who did not as well as between those groups over the course of therapy for each (days 0, 7/10, 16, and 31). We completed ANOVA simultaneous comparison analyses (ASCAs) for multivariate analysis of our subset population to observe changes simultaneously between time and APAP-cys class. Significance of results generated were determined by leverage and squared prediction error (SPE) values. We performed independent t tests with false discovery rate (FDR) multiple comparisons corrections, fold changes, and partial least squares discriminant analyses (PLS-DA) plots after data transformation using auto scaling (mean-centered and divided by the standard deviation of each variable). Fold changes of at least twofold difference between groups or p < 0.05 after multiple comparisons correction were considered significant. PLS-DA plots represented the differences between metabolomes of different groups. We cross validated PLS-DA model with permutation testing.
Statistical Analyses for Clinical and Demographic Variables
We used independent t tests with FDR multiple comparisons correction to identify significant clinical variables and Chi-square tests to compare categorical clinical variables. Significant metabolites and clinical variables groups were investigated together using logistic regression tests to predict which subjects would develop APAP-cys with APAP administration. Temporal analysis of adduct formation was not performed. All statistical analyses were completed in R (version 4.0.2, Vienna, Austria).
Results
Subject Demographic and Clinical Profiles
Of the 204 subjects in this study, 184 (90.2%) developed APAP-cys adducts. The median adduct concentration was 0.14 nmol/mL (IQR 0.09). All others were considered to be in the no adducts group (n = 20, 9.8%). There were no significant differences between groups based on measured clinical variables (body mass index (BMI), alcohol use vs not, baseline alanine transaminase (ALT), alkaline phosphatase (ALKP), aspartate transaminase (AST), international normalized ratio (INR), total bilirubin, albumin, or based on past medical history) (Table 1).
Table 1.
Subject demographic and clinical profiles.
| No adducts | Adducts | p-value | |
|---|---|---|---|
| N (%) | 20 (9.8) | 184 (90.2) | |
| Demographics | |||
| Female, n (%) | 7 (4.8) | 140 (95.2) | 0.0003 |
| Race, Caucasian, n (%) | 15 (75.0) | 126 (68.5) | 0.55 |
| Ethnicity, Non-Hispanic, n (%) | 16 (80.0) | 155 (84.2) | 0.62 |
| Age, median (IQR) | 33 (20.0) | 40 (18.5) | 0.14 |
| Clinical Parameters | |||
| BMI (kg/m2), mean (st. dev.) | 26.0 (4.7) | 26.8 (6.1) | 0.57 |
| Never drink, No, n (%) | 15 (75.0) | 151 (82.0) | 0.44 |
| Baseline ALT, mean (st. dev.) | 21.4 (8.3) | 20.4 (7.4) | 0.57 |
| Baseline ALKP, mean (st. dev.) | 59.2 (16.6) | 60.1 (16.1) | 0.81 |
IQR = interquartile range, BMI = body mass index, st. dev. = standard deviation, ALT = alanine transaminase, ALKP = alkaline phosphatase
There were no significant differences between groups based on race, ethnicity, or age (Table 1). However, there was a significant difference between groups based on sex with a greater representation of females in the adducts group (adducts 95.2% vs no adducts 4.8%, p = 0.0003) (Table 1). The odds of females developing NAPQI protein adducts were 5.91 times higher compared to males (95% CI = 2.3–14.9; p = 0.0001).
Major Metabolome Changes Between Adduct and No Adduct Groups Were Related to Fatty Acid Biosynthesis
There were notable differences when comparing the group that developed adducts (n = 29) with the no adducts group (n = 184). Component 1 of the partial least squares discriminant analysis (PLS-DA) explains 14.2% of the variance in metabolome expression between these groups (Fig. 2A). When comparing the same cohort, component 2 describes 12.8% of this difference (Fig. 2A). Although we identified metabolome differences within individuals between days, these differences were not biologically significant such that these analyses are not included here. There were two key metabolites that showed differential expression within relative quantitation concentrations between the adducts and no adducts groups, 6-carboxyhexanoate and caprylic (octanoic) acid. 6-carboxyhexanote (p = 0.030, FC = 0.291), a precursor for biotin synthesis, had higher expression with the group that developed adducts and is excreted in greater quantities in individuals with mitochondrial beta-oxidation impairment (Fig. 2B). Caprylic acid (p = 0.028, FC = 9.083), a medium-chain fatty acid, had significantly higher relative expression concentrations within the group that had no adducts (Fig. 2C).
Fig. 2.

Primary metabolome changes in pre-APAP therapy serum samples stratified by those that developed adducts and those that did not: A) 2-D PLSDA image—principal component analysis between subjects that developed protein adducts and those that did not show a difference in metabolite expression in pre-treatment samples. B,C) Metabolites significantly differentially expressed identified by independent t tests with FDR multiple comparisons correction. *—p = < 0.05; APAP—acetaminophen; PLS-DA—partial least squares discriminant analysis; FDR—false discovery rate; adducts n = 20, no adducts n = 184
Difference in Metabolomes Partly Explained by Sex-based Metabolite Expression Concentration Alterations
Within this same study population, yet independent of adduct presence/absence, multiple metabolites were differentially expressed when comparing males (n = 57) and females (n = 147). The partial least squares discriminant analysis shows that metabolome changes in component 1 accounted for 4.1% of the overall difference (Fig. 3A). Noticeably, component 2 was able to explain 20.1% of the difference in metabolome between sex independent of adduct status (Fig. 3A). Among the metabolites analyzed using relative quantitation concentrations, 5–6-dihydrothymine and L-arginine were significantly differentially expressed. 5–6-dihydrothymine is a metabolite found in the thymine metabolism pathway that is significantly elevated (p = 1.420 × 10⁻⁸) in males compared with females (Fig. 3B). L-arginine is an amino acid found in significantly higher concentrations in females than in males, which was consistent with our findings (p = 6.924 × 10⁻⁵) (Fig. 3C).
Fig. 3.

Primary metabolome changes in pre-APAP therapy serum samples stratified by sex: A) 2-D PLSDA image—principal component analysis between males and females shows a difference in metabolite expression in pre-treatment samples. B,C) Metabolites significantly differentially expressed identified by independent t tests with FDR multiple comparisons correction. *—p = < 0.05; APAP – acetaminophen; PLS-DA—partial least squares discriminant analysis; FDR—false discovery rate; females n = 147, males n = 57
ANOVA Simultaneous Component Analyses (ASCA) Identified Multiple Metabolites Differentially Expressed When Looking at Either Sex or Adduct Presence in a Combined Analysis
We identified significant metabolites through ASCA based on higher leverage and minimal squared prediction error (SPE). Higher leverage highlights an increased impact that each metabolite has on the model while a lower SPE confirms an increase in confidence that each metabolite was not influencing the model by chance. While permutation testing was not able to validate the model produced with ASCA, there were multiple metabolites determined to be significant by high leverage and low SPE.
When analyzing the overall cohort stratified by sex, five metabolites were identified as being well modeled through ASCA (Fig. 4A). There was one significant acylcarnitine (acyl-C4-DC) with higher expression in males in the no adducts group compared to males with adducts. There were two hydroxy acids (10-hydroxydecanoic acid and 2-hydroxyglutarate) that had significantly higher expression concentrations in the no adducts group and most elevated in males without adducts. Ribose, a sugar vital to many biologic processes, was higher in both sexes that did not develop adducts and most elevated in the males without adducts. Kynurenine, an alkyl-phenylketone, produced from tryptophan metabolism and associated with multiple physiologic processes, was most elevated within females with no adducts and most decreased in males with no adducts. This suggests sex-specific differences in tryptophan pathways and response to inflammation that may be associated with APAP-induced adduct formation. Our findings are consistent with prior studies that have demonstrated lower tryptophan concentrations and higher concentrations of kynurenic acid in females, consistent with greater sensitivity to stress and inflammation to induce tryptophan-2,3-dioxygenase (the key enzyme that breaks down tryptophan to kynurenine) [17, 18].
Fig. 4.
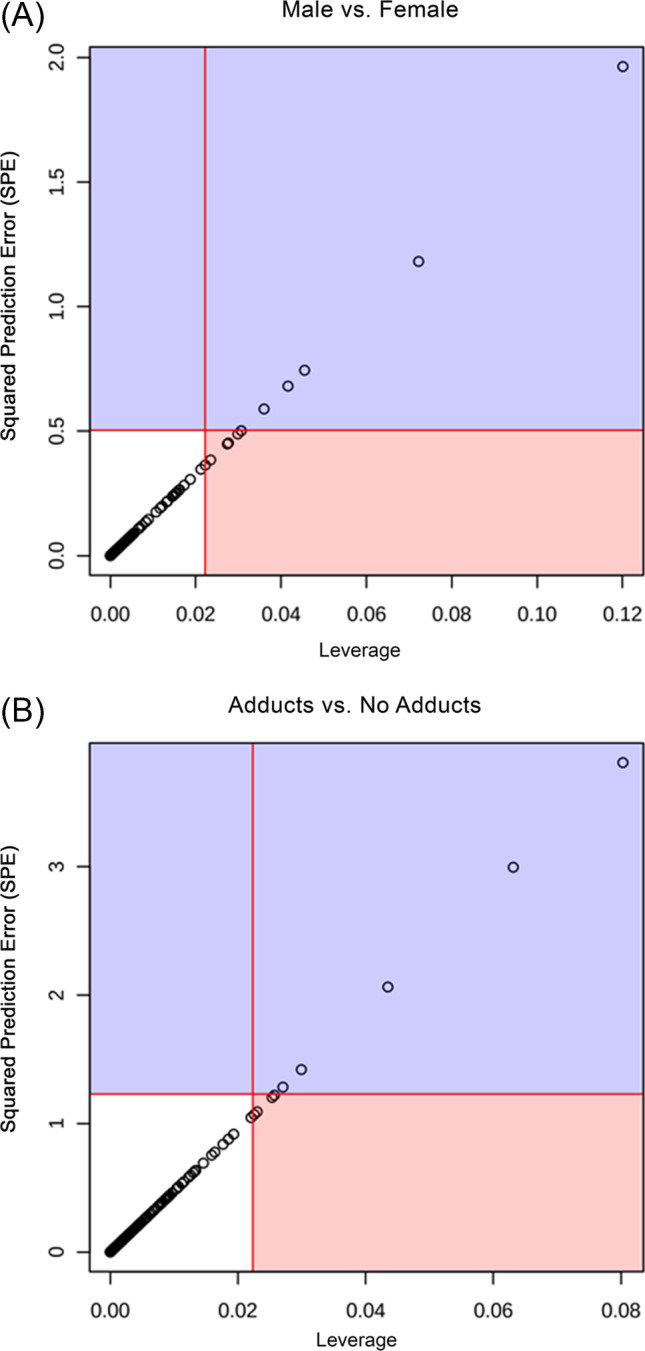
Multiple metabolites significantly differentially expressed between either sex or adduct presence/absence in combined analysis of outcomes. A) Five metabolites showed significantly different expression when stratified by sex using ASCA modeling with significance determined by SPE and leverage including an acylcarnitine, two hydroxy acids, ribose and an alkyl-phenylketone. B) Glutathione was the only metabolite that showed significantly different expression when stratified by adduct presence/absence using ASCA modeling with significance determined by SPE and leverage. ASCA – ANOVA simultaneous component analysis, metabolites in red are well modeled and those in blue are considered outliers; SPE—squared prediction error; females n = 147, males n = 57; adducts n = 20, no adducts n = 184
When analyzing the entire cohort stratified by adduct presence vs not, glutathione was the only metabolite identified as being well modeled through ASCA (Fig. 4B). Glutathione detoxifies APAP metabolites. Baseline serum values showed the lowest expression of glutathione within the males with no adducts group. We have demonstrated a rapid rise in glutathione in those that do not elevate their ALT [19]. Thus, liberation of glutathione seems to be more efficient in these patients. While having low glutathione associated with low adduct formation was an unexpected finding, this could be a manifestation of different physiology between therapeutic and overdose APAP dosing. It could also suggest another method of detoxifying NAPQI or possibly less oxidation occurring and therefore a lower need for glutathione in some subjects.
Multiple Significant Metabolites Shared Patterns of Expression in Analyses Based on Comparisons Between Either Sex or Adduct Presence
The result of our regression analysis demonstrated five metabolites that appeared significant within the top 20 variables of importance in projection (VIP) scores generated through PLS-DA, when comparing sexes or adduct presence vs not (Fig. 5). The five significant metabolites common to both analyses included caprylic acid, maltose, ornithine, L-arginine, and D-glucono-1,5-lactone (Fig. 5, red asterisks). With the exception of L-arginine, all of these metabolites showed greater concentrations of expression within both males and the no adducts groups (Fig. 5). L-arginine was increased in both females and the adducts group and had a greater impact on the model when comparing sex as opposed to when comparing adduct presence vs not (Fig. 5). As above, it was observed that when adducts vs no adducts are compared, glutathione has a significantly different expression between groups where those with no adducts had a higher concentration of glutathione in serum collected prior to APAP administration.
Fig. 5.

Multiple metabolites have similar patterns of expression when comparing male/no adducts groups to female/adducts groups. A) Top 20 metabolites differentially expressed between adducts and no adducts groups determined by VIP score show 5 metabolites similarly expressed between males/females and glutathione increase in no adducts group. B) Top 20 metabolites differentially expressed between males and females determined by VIP score show 5 metabolites similarly expressed between adducts/no adducts groups. Red asterisk—metabolites with same pattern of expression between male/no adducts groups and female/adducts groups; yellow asterisk—glutathione known to be associated with APAP toxicity; VIP—variable importance in projection; females n = 147, males n = 57; adducts n = 20, no adducts n = 184
Multiple Metabolites Show Sex-based Differences in Expression
The two metabolites, lactate and malate, have known sex-based differences in metabolite expression, which matched the results of this study, when comparing groups based on adduct presence vs not as well as by sex (Fig. 6A). Lactate is associated with anaerobic metabolism and was found to have higher relative quantitation expression concentrations within the no adducts group compared with the adducts group (p = 0.001) (Fig. 6A). Malate is an intermediate within the TCA cycle and had higher expression concentrations within the no adducts group compared with the adducts group (p = 0.014) (Fig. 6A).
Fig. 6.
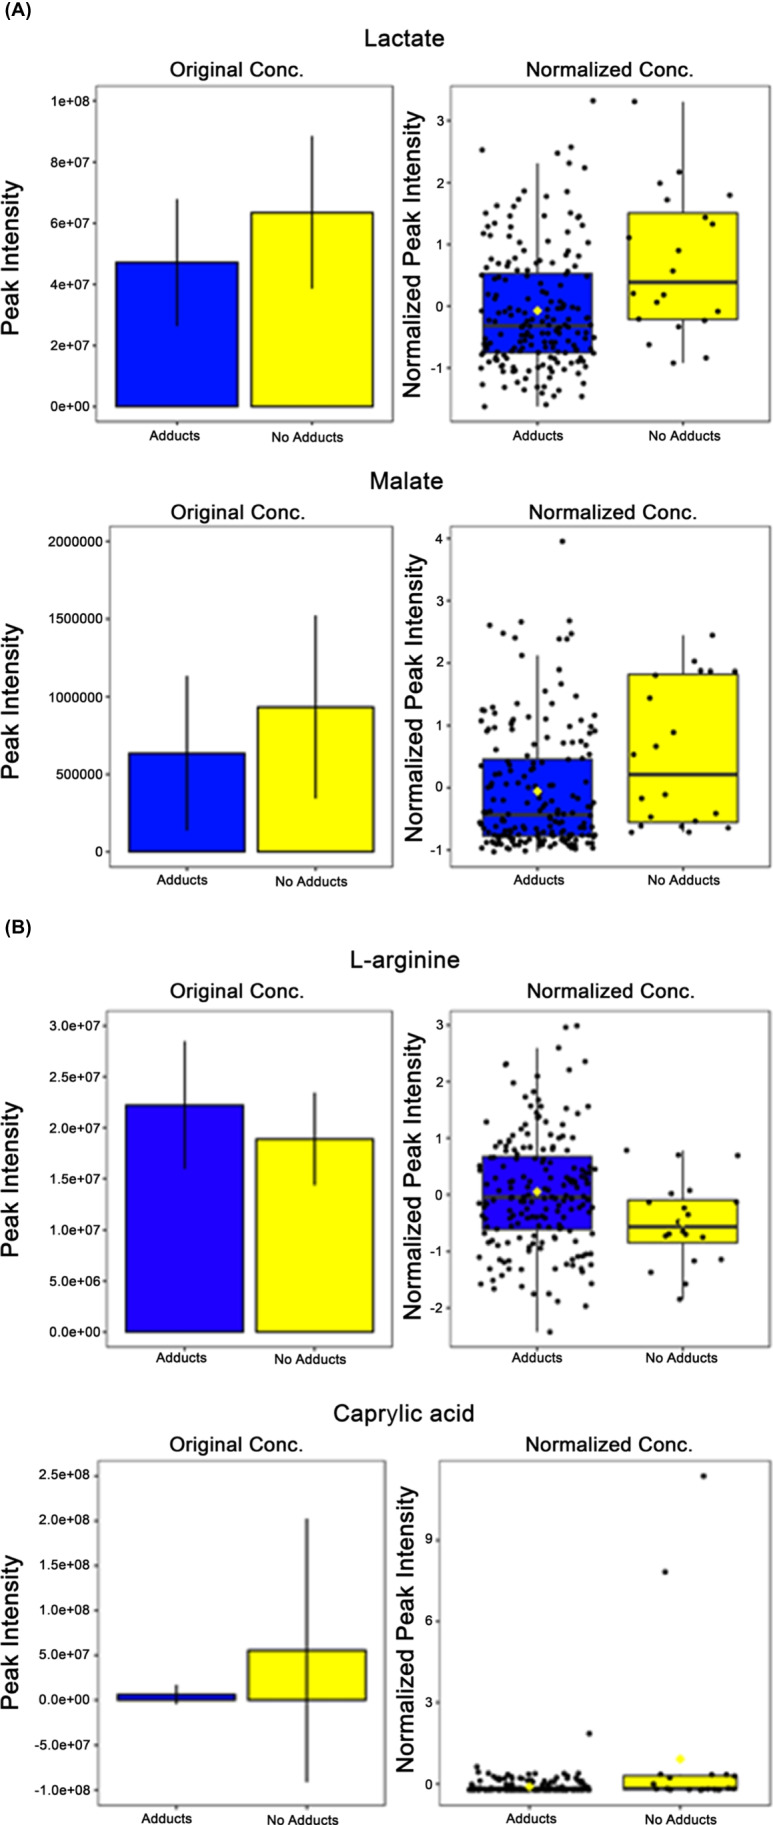

Metabolites differentially expressed by sex. A) Two metabolites showed previously validated differences in sex-based expression within energy utilization pathways identified by independent t tests with FDR multiple comparisons correction. B) Five metabolites show sex-based differential expression not previously reported crossing multiple physiologic pathways identified by independent t tests with FDR multiple comparisons correction. *—p = < 0.05; FDR—false discovery rate; females n = 147, males n = 57. (A) Confirmed Sex-based Differences in Expression, (B) Presumed Sex-based Differences in Expression
Based on comparison of VIP scores between analyses, there were five more metabolites that had matched patterns of expression with sex-based and adducts presence vs not (Fig. 6B). L-arginine is an amino acid involved in many physiologic processes that had a lower expression within the no adducts group (p = 0.023) (Fig. 6B). D-glucono-1,5-lactone had higher concentrations of expression within the no adducts group (p = 0.081) (Fig. 6B). Maltose, a source of energy via glucose metabolism pathways, has a higher expression concentration within the group that developed adducts while taking APAP (p = 0.008) (Fig. 6B). Ornithine, a metabolite involved within the urea cycle pathway, has a higher expression concentration within the no adducts group (p = 0.021) (Fig. 6B). This was also demonstrated in our prior work in which ornithine was identified as elevated in those that did not elevate their alanine transaminase (ALT) [19]. Caprylic acid, a fatty acid found in numerous foods, had significantly higher expression concentrations within the no adducts group (p = 9.598 × 10⁻⁶) (Fig. 6B).
Multiple Metabolites Were Significantly Differentially Expressed Independent of Sex
There were four key metabolites that had differential expressions between the adducts and no adducts groups independent of differences stratified by sex (Fig. 7). Two of these metabolites, 6-carboxyhexanoate and caprylic acid, showed significant differences in expression within both the analyses comparing the adducts and no adducts groups in addition to sex-based comparisons (Fig. 7A). The differences in metabolite expression concentrations exhibited an opposite pattern from previously documented sex-based differences lending support to the relevance of these metabolites as determinants of subjects that will develop adducts versus not. 6-carboxyhexanoate, a metabolite involved with the biosynthesis of both lysine and biotin, showed significantly higher expression concentrations in the group that developed adducts compared to those that did not (p = 0.030) (Fig. 7A). It has been shown that 6-carboxyhexanoate may be excreted in larger quantities in individuals with mitochondrial or peroxisomal beta oxidation disorders(20). Caprylic acid had significantly higher expression within the no adducts group (p = 9.598 × 10⁻⁶) compared with the adducts group in this study, but historically has been shown to have higher expression within females (Fig. 7A).
Fig. 7.


Four metabolites differentially expressed between adducts and no adducts groups independent of sex. A) 6-carboxyhexanoate and caprylic acid show opposite expression patterns from previously observed sex-based differences with significance determined by independent t tests and FDR multiple comparisons correction. B) Hypoxanthine and 3-oxalomalate show significantly different expression levels based on adducts vs no adducts independent of sex as identified with independent t tests and FDR multiple comparisons correction. *—p = < 0.05; FDR—false discovery rate; adducts n = 20, no adducts n = 184. (A) Opposite Confirmed Sex-based Differences in Expression, (B) Non-Sex-based Differences in Expression
Additionally, there were two metabolites that were significantly differentially expressed between the adducts and no adducts groups that showed no significant differences when comparing groups by sex—hypoxanthine and 3-oxalomalate (Fig. 7B). Hypoxanthine, a purine that is involved within multiple biologic pathways and is ultimately oxidized to uric acid (with xanthine as an intermediate step) prior to excretion, had significantly higher expression concentrations within the no adducts group compared with the adducts group (p = 0.020) (Fig. 7B). 3-oxalomalate, a tricarboxylic acid found in humans as part of the exposome, showed significantly higher expression in subjects within the no adducts group compared with the adducts group (9.481 × 10⁻⁵) (Fig. 7B). Oxalomalate and glyoxylate inhibit aconitate hydratase and isocitrate dehydrogenase in the Krebs cycle [21, 22].
Discussion
There are currently no known predictors of APAP-cys adduct formation at therapeutic APAP doses. In this study, we found that females were almost 6 times more likely to develop adducts at therapeutic APAP dosing. The metabolic pathways included in our study are involved in aerobic and anaerobic respiration, fatty acid biosynthesis, and glucose metabolism. We identified several key metabolites that showed differential expression based on adduct formation, and we further characterized these pathways when stratified by sex. Our findings have important implications for understanding the role of adduct formation and sex in metabolic derangement and hepatic injury.
ALT elevation was not associated with adduct formation in this study. This is likely because ALT elevation at therapeutic dosing is associated with different biologic processes, such as immune mediated hypersensitivity reactions or failure of hepatic adaption. This is unlikely to result in large concentrations of APAP-cys because the mechanism of hepatocellular injury is not APAP concentration dependent.
We identified multiple metabolites that were differentially expressed based on sex. In our study, L-arginine was significantly elevated in females and 5,6-dihydrothymine was higher in males, independent of adduct formation. Arginine is an amino acid with multiple roles in the body. It is an intermediate in the urea cycle, can be converted into glucose and glycogen, and serves as the immediate precursor of nitric oxide (NO). Arginine also helps stimulate the immune system’s response to infection. Catabolic states (e.g., sepsis, cancer) result in increased arginine utilization, which can exceed production and result in arginine depletion. Arginine may also be a specific biomarker for hepatic injury, which may be more pertinent to the results of this study; decreased arginine concentrations have been found to accompany hepatocellular necrosis and to correlate with elevated ALT [23]. In contrast, 5,6-dihydrothymine is an intermediate breakdown product of thymine and potentially toxic at high concentrations, although the mechanism is unclear (http://www.t3db.ca/toxins/T3D4332).
Lactate and malate were also differentially expressed, with concentrations affected by both sex and adduct presence. Both were more highly expressed in the no adducts group and in males. This suggests decreased utilization of malate as an intermediate in the Krebs cycle and increased anaerobic metabolism, consistent with mitochondrial derangement and an imbalance in energy supply and demand. Our results suggest that, at therapeutic APAP concentrations, male sex and absence of adduct formation are markers of a shift to anaerobic metabolism.
Our study also identified differences in metabolite concentrations between the adduct and no adduct groups, independent of sex. Caprylic acid was more highly expressed in the no adducts group, and 6-carboxyhexanoate was more highly expressed in the adducts group. Caprylic acid is a fatty acid and has been shown to interfere with glycolysis, the Krebs cycle, and increase hepatic oxygen consumption [24]. A dicarboxylic acid, 6-carboxyhexanoate, is essential for the biosynthesis of vitamin B7 (biotin). Biotin is necessary for fatty acid synthesis, amino acid catabolism, and gluconeogenesis. Elevated 6-carboxyhexanoate concentrations suggest decreased biotin synthesis and subsequently less catabolic activity. These results again suggest higher concentrations of energy dysfunction and catabolic activity in the no adducts group.
There are clear differences in metabolic pathways underlying adduct versus no adduct formation. Furthermore, many of these pathways differ by sex. These findings support prior literature that suggests sex-based differences in metabolite formation [25]. Acute liver injury and failure are more common in females after APAP overdose [26]. Interestingly, our study suggests that, when APAP is taken at therapeutic doses, female sex and adduct formation are not associated with ALT elevation, but rather, energy dysfunction and shift to anaerobic metabolism. This may be due to sex-based differences in fatty acid metabolism.
Limitations
Our study had a number of limitations. First, we did not control for diet and lifestyle, which may have been inherently different between males and females. However, this was not demonstrated in our prior ALT analysis(19). Our study cohort was representative of the general population diet and lifestyle. Second, only 20 of the 204 subjects in our study were classified as having no adducts which precludes our ability to capture rare metabolic variants in this group. Finally, our study does not provide an absolute quantitation of metabolites significant for APAP adduct formation independent of sex and would be strengthened by confirmation in a non-APAP cohort that the metabolite expressions described herein are, in fact, sex based. These findings could strengthen recommendations regarding a sex-based predictive value of the APAP-cys reference range. However, there is no defined discriminatory concentration associated with liver injury for APAP-cys in therapeutic dosing. Therefore, these sex-based associations may not hold in overdose.
Conclusions
Multiple metabolites were differentially expressed by adduct group and by sex. These metabolites are principally involved in cellular respiration, fatty acid biosynthesis, glucose metabolism, and the differential expression of these pathways suggests a role for sex and adduct formation in APAP-induced hepatocyte injury. These findings may have implications for sex-based reference ranges for APAP-cys concentrations. Moreover, genetic analyses of these metabolic pathways would further elucidate the underlying biology of adduct formation.
Supplementary Information
Below is the link to the electronic supplementary material.
Funding
The parent study was funded by Johnson and Johnson. A.A.M. received support from NIH R35GM124939 and NIH CTSI UL1 TR001082 for this work.
Declarations
Conflict of Interest
None. However, the original project that collected the samples used for this study was supported by an investigator-initiated grant from McNeil Consumer Healthcare. Authors received only salary for their work on the project.
Footnotes
Prior Presentations: Data in this manuscript were previously presented as a platform at ACMT’s Annual Scientific Meeting, Virtual, 2021.
Publisher's Note
Springer Nature remains neutral with regard to jurisdictional claims in published maps and institutional affiliations.
References
- 1.James LP, Alonso EM, Hynan LS, Hinson JA, Davern TJ, Lee WM, et al. Detection of acetaminophen protein adducts in children with acute liver failure of indeterminate cause. Pediatrics. 2006;118(3):e676–e681. doi: 10.1542/peds.2006-0069. [DOI] [PubMed] [Google Scholar]
- 2.Davern TJ, 2nd, James LP, Hinson JA, Polson J, Larson AM, Fontana RJ, et al. Measurement of serum acetaminophen-protein adducts in patients with acute liver failure. Gastroenterology. 2006;130(3):687–694. doi: 10.1053/j.gastro.2006.01.033. [DOI] [PubMed] [Google Scholar]
- 3.Bond GR. Acetaminophen protein adducts: a review. Clin Toxicol (Phila) 2009;47(1):2–7. doi: 10.1080/15563650801941831. [DOI] [PubMed] [Google Scholar]
- 4.Heard KJ, Green JL, James LP, Judge BS, Zolot L, Rhyee S, et al. Acetaminophen-cysteine adducts during therapeutic dosing and following overdose. BMC Gastroenterol. 2011;11:20. doi: 10.1186/1471-230X-11-20. [DOI] [PMC free article] [PubMed] [Google Scholar]
- 5.Heard K, Green JL, Anderson V, Bucher-Bartelson B, Dart RC. Paracetamol (acetaminophen) protein adduct concentrations during therapeutic dosing. Br J Clin Pharmacol. 2016;81(3):562–568. doi: 10.1111/bcp.12831. [DOI] [PMC free article] [PubMed] [Google Scholar]
- 6.O'Connell TM, Watkins PB. The application of metabonomics to predict drug-induced liver injury. Clin Pharmacol Ther. 2010;88(3):394–399. doi: 10.1038/clpt.2010.151. [DOI] [PubMed] [Google Scholar]
- 7.Clayton TA, Lindon JC, Cloarec O, Antti H, Charuel C, Hanton G, et al. Pharmaco-metabonomic phenotyping and personalized drug treatment. Nature. 2006;440(7087):1073–1077. doi: 10.1038/nature04648. [DOI] [PubMed] [Google Scholar]
- 8.Winnike JH, Li Z, Wright FA, Macdonald JM, O'Connell TM, Watkins PB. Use of pharmaco-metabonomics for early prediction of acetaminophen-induced hepatotoxicity in humans. Clin Pharmacol Ther. 2010;88(1):45–51. doi: 10.1038/clpt.2009.240. [DOI] [PubMed] [Google Scholar]
- 9.Heard K, Green JL, Anderson V, Bucher-Bartelson B, Dart RC. A randomized, placebo-controlled trial to determine the course of aminotransferase elevation during prolonged acetaminophen administration. BMC Pharmacol Toxicol. 2014;15:39. doi: 10.1186/2050-6511-15-39. [DOI] [PMC free article] [PubMed] [Google Scholar]
- 10.U.S. Department of Health and Human Services Food and Drug Administration. Guidance for industry and investigators- safety reporting requirments for INDs and BA/BE studies. In: Adminstration UFD, editor. Silver Springs, MD2012. p. 32. Available at: https://www.fda.gov/files/drugs/published/Safety-Reporting-Requirements-for-INDs-%28Investigational-New-Drug-Applications%29-and-BA-BE-%28Bioavailability-Bioequivalence%29-Studies.pdf
- 11.Sonn BJ, Saben JL, McWilliams G, Shelton SK, Flaten HK, D'Alessandro A, et al. Predicting response to lisinopril in treating hypertension: a pilot study. Metabolomics. 2019;15(10):133. doi: 10.1007/s11306-019-1601-7. [DOI] [PMC free article] [PubMed] [Google Scholar]
- 12.Nemkov T, Reisz JA, Gehrke S, Hansen KC, D'Alessandro A. High-Throughput Metabolomics: Isocratic and Gradient Mass Spectrometry-Based Methods. Methods Mol Biol. 2019;1978:13–26. doi: 10.1007/978-1-4939-9236-2_2. [DOI] [PubMed] [Google Scholar]
- 13.Thonusin C, IglayReger HB, Soni T, Rothberg AE, Burant CF, Evans CR. Evaluation of intensity drift correction strategies using MetaboDrift, a normalization tool for multi-batch metabolomics data. J Chromatogr A. 2017;1523:265–274. doi: 10.1016/j.chroma.2017.09.023. [DOI] [PMC free article] [PubMed] [Google Scholar]
- 14.Nemkov T, D'Alessandro A, Hansen KC. Three-minute method for amino acid analysis by UHPLC and high-resolution quadrupole orbitrap mass spectrometry. Amino Acids. 2015;47(11):2345–2357. doi: 10.1007/s00726-015-2019-9. [DOI] [PMC free article] [PubMed] [Google Scholar]
- 15.Nemkov T, Hansen KC, D'Alessandro A. A three-minute method for high-throughput quantitative metabolomics and quantitative tracing experiments of central carbon and nitrogen pathways. Rapid Commun Mass Spectrom. 2017;31(8):663–673. doi: 10.1002/rcm.7834. [DOI] [PMC free article] [PubMed] [Google Scholar]
- 16.Chong J, Soufan O, Li C, Caraus I, Li S, Bourque G, et al. MetaboAnalyst 4.0: towards more transparent and integrative metabolomics analysis. Nucleic Acids Res. 2018;46(W1):W486–W94. doi: 10.1093/nar/gky310. [DOI] [PMC free article] [PubMed] [Google Scholar]
- 17.Maes M, Leonard BE, Myint AM, Kubera M, Verkerk R. The new '5-HT' hypothesis of depression: cell-mediated immune activation induces indoleamine 2,3-dioxygenase, which leads to lower plasma tryptophan and an increased synthesis of detrimental tryptophan catabolites (TRYCATs), both of which contribute to the onset of depression. Prog Neuropsychopharmacol Biol Psychiatry. 2011;35(3):702–721. doi: 10.1016/j.pnpbp.2010.12.017. [DOI] [PubMed] [Google Scholar]
- 18.Nilsson LK, Nordin C, Jönsson EG, Engberg G, Linderholm KR, Erhardt S. Cerebrospinal fluid kynurenic acid in male and female controls - correlation with monoamine metabolites and influences of confounding factors. J Psychiatr Res. 2007;41(1–2):144–151. doi: 10.1016/j.jpsychires.2005.12.001. [DOI] [PubMed] [Google Scholar]
- 19.Sonn BJ, Heard KJ, Heard SM, D'Alessandro A, Reynolds KM, Dart RC, et al. Metabolomic markers predictive of hepatic adaptation to therapeutic dosing of acetaminophen. Clin Toxicol (Phila). 2021;60(2):221–230. [DOI] [PMC free article] [PubMed]
- 20.Bennett MJ, Ragni MC, Hood I, Hale DE. Azelaic and pimelic acids: metabolic intermediates or artefacts? J Inherit Metab Dis. 1992;15(2):220–223. doi: 10.1007/BF01799635. [DOI] [PubMed] [Google Scholar]
- 21.Ingebretsen OC. Mechanism of the inhibitory effect of glyoxylate plus oxaloacetate and oxalomalate on the NADP-specific isocitrate dehydrogenase. Biochim Biophys Acta. 1976;452(2):302–309. doi: 10.1016/0005-2744(76)90180-7. [DOI] [PubMed] [Google Scholar]
- 22.Ruffo A, Testa E, Adinolfi A, Pelizza G, Moratti R. Control of the citric acid cycle by glyoxylate. Mechanism of the inhibition by oxalomalate and gamma-hydroxy-alpha-oxoglutarate. Biochem J. 1967;103(1):19–23. doi: 10.1042/bj1030019. [DOI] [PMC free article] [PubMed] [Google Scholar]
- 23.Saitoh W, Yamauchi S, Watanabe K, Takasaki W, Mori K. Metabolomic analysis of arginine metabolism in acute hepatic injury in rats. J Toxicol Sci. 2014;39(1):41–50. doi: 10.2131/jts.39.41. [DOI] [PubMed] [Google Scholar]
- 24.Scholz R, Schwabe U, Soboll S. Influence of fatty acids on energy metabolism. 1. Stimulation of oxygen consumption, ketogenesis and CO2 production following addition of octanoate and oleate in perfused rat liver. Eur J Biochem. 1984;141(1):223–30. doi: 10.1111/j.1432-1033.1984.tb08179.x. [DOI] [PubMed] [Google Scholar]
- 25.Fan S, Yeon A, Shahid M, Anger JT, Eilber KS, Fiehn O, et al. Sex-associated differences in baseline urinary metabolites of healthy adults. Sci Rep. 2018;8(1):11883. doi: 10.1038/s41598-018-29592-3. [DOI] [PMC free article] [PubMed] [Google Scholar]
- 26.Rubin JB, Hameed B, Gottfried M, Lee WM, Sarkar M. Acetaminophen-induced Acute Liver Failure Is More Common and More Severe in Women. Clin Gastroenterol Hepatol. 2018;16(6):936–946. doi: 10.1016/j.cgh.2017.11.042. [DOI] [PMC free article] [PubMed] [Google Scholar]
Associated Data
This section collects any data citations, data availability statements, or supplementary materials included in this article.