

Abstract
The activity of living cells is necessarily dependent on the amount of available bioenergy. In T cells the latter is mainly derived from ATP, a molecular energy “coin” generated by one of several metabolic processes that differ in their ability to satisfy energy demand. Thus, whereas naïve or quiescent T cells efficiently utilize oxidative phosphorylation to generate ATP, T cells subjected to antigenic stimulation followed by clonal expansion and cytokine production meet their increased need for energy by supplementing ATP generation by oxidative phosphorylation with ATP generation by glycolysis of glucose. Yet additional need for ATP can be met by other basic biologic sources of energy such as glutamine, an amino acid that is metabolized through a process called glutaminolysis to result in end products that flows into the TCA cycle and augment ATP generation by oxidative phosphorylation. It is now possible to track the dominant energy supplying processes (i.e., the ATP generation process) in differentiating or activated T cells in a real time manner. Here, we provide one element of such tracking by describing protocols for the assessment of the contribution of glutaminolysis to overall ATP production within different T cell subsets.
Basic Protocol 1: Evaluation of the Role of Glutaminolysis During T cell Activation/Differentiation
Basic Protocol 2: Evaluation of the Role of Glutaminolysis in T cell Responses Utilizing Glutaminolysis Inhibitors
Basic Protocol 3: Evaluation of the effect of Glutaminolysis on Cellular Oxidative Phosphorylation/Glycolysis
Keywords: T cell, glutaminolysis, oxidative phosphorylation, glycolysis
INTRODUCTION:
In the course of maintaining immune homeostasis and in responding to antigenic challenge immune cells take up variable amounts of nutrients to meet their changing energy demands (Chapman, Boothby, & Chi, 2020). This is, in effect, quantitated by their generation of ATP, a factor that serves as a universal energy currency and that is normally a product of one of two complementary forms of glucose metabolism. The first, characteristic of naïve and quiescent cells, consists of energy efficient, oxidative phosphorylation of glucose occurring in mitochondria; this an aerobic process that results in the slow release of large amounts of ATP. The second, characteristic of cells activated by antigen and executing effector function, consists of glycolysis taking place in the cytoplasm; this is an anaerobic process that results in the rapid release of small amounts of ATP. The shift from ATP generation mainly if not solely due to an aerobic mitochondrial process to ATP generation supplemented by an anaerobic cytoplasmic process is known as the Warburg effect and is necessary to meet the increased energy demands of activated effector cells (Geltink, Kyle, & Pearce, 2018).
Glucose, however, is not the only energy substrate used by cells for the generation of ATP. Under conditions where glucose availability is limited cells utilize back-up substrates for this purpose. This is frequently the case in the tumor microenvironment wherein avid uptake of glucose by the tumor cells deprive the T cells in the same microenvironment of access to this nutrient and thus limit anti-tumor T cell function. One back-up substrate used by such tumor-associated T cells as a source of ATP is the abundant amino acid glutamine. Here, the cells employ glutaminolysis, a process that converts this amino acid into intermediates that enter the TCA cycle to facilitate oxidative phosphorylation and ATP generation (see Figure 1 and its explanation in the Commentary). The starting point of glutaminolysis is cellular glutamine uptake by one of several known amino acid transporters such as ASCT2, LAT1, and SNAT1/2. The imported glutamine is then converted to glutamate by glutaminase 1 (GLS1) by a deamination event that donates nitrogen to other biosynthesis processes. The glutamate thus generated then serves as the metabolic junction point serving two distinct downstream pathways. The first pathway consists of the conversion of glutamate to alpha-ketoglutarate; the second, known as the GABA shunt, consists of conversion of glutamate to GABA via glutamate decarboxylase (GAD) activity. Both pathways generate intermediates that flow into the TCA cycle in the mitochondria, wherein oxidative phosphorylation productive of ATP occurs.
Figure 1.

Schematic of energy (ATP) generation by glycolysis (light orange area), oxidative phosphorylation (blue area) and glutaminolysis (green area). Glucose serves as a nutrient source of energy via glycolysis when converted to lactate and oxidative phosphorylation when converted to pyruvate. Glutamine serves as a nutrient source of energy via oxidative phosphorylation when converted to either glutamate or GABA. Oxidative phosphorylation is a mitochondrial process “fueled” by TCA (Krebs) cycle breakdown products that enter an electron transport chain consisting of five complexes (I-V) that establish a proton (H+) gradient utilized by complex V (ATP synthase) to generatre ATP; oxidation of H+ to form water occurs at enzyme complex IV. See Commentary for further explanation. Various inhibitors useful in the quantitation of these processes are shown in red.
While glutaminolysis typically occurs cooperatively with glucose metabolism as noted above it is also a bioenergetic source for cells engaged in high energy requiring immune responses irrespective of glucose availability. This is shown by the fact that glutaminase 1-deficient T cells exhibit a strong defect in the ability to undergo differentiation (Johnson et al., 2018). This highlights the need to evaluate the contribution and requirement of this process in a variety of T cell responses. Here we outline methods of evaluating the level of glutaminolysis used by cells under various conditions as well as the effect of this process on energy generation by oxidative phosphorylation and glycolysis.
BASIC PROTOCOL 1: Evaluation of the Role of Glutaminolysis During T cell Activation/Differentiation
Introduction:
As mentioned in the Introduction, glutaminolysis serves as an extra source of energy for T cells in tissue microenvironments. However, it also may be necessary for and contribute to optimal cell function under more normal circumstances. In this Protocol we describe a method for assessing the contribution of glutaminolysis to T cells undergoing T cell subset differentiation; this Protocol can therefore be used as a template for assessing glutaminolysis under a variety of physiologic and pathologic conditions.
The method described focuses initially on the isolation of naïve CD4+ T cells (CD4+/CD45RBhigh/CD62L+ cells) in the presence of culture media that is supplemented with glutamine at a concentration of 2 mM (its usual concentration in media supporting hematopoietic cells in vitro). It then goes on to describe the generation of Th1/Th2/Th17 T cells from the naïve CD4+ T cells in the presence of various concentrations glutamine. The successful induction of each T helper subset and the assessment of glutaminolysis during induction is evaluated by production of signature cytokine production using flow cytometry (i.e., IFN-γ for Th1, IL-4 for Th2, IL-17 for Th17 cells). The starting population of naïve CD4+ T cell is isolated using magnetic beads; however, more highly purified naïve CD4+ T cells can be obtained by sorting flow cytometry.
Materials:
Detailed materials list:
C57BL/6J mice (The Jackson Laboratory, stock # 000664)
Fetal Bovine Serum (By researcher’s choice)
RPMI 1640 medium, no glutamine (Thermo Fisher, cat. # 21870076)
L-Glutamine (Thermo Fisher, cat. # 25030149)
Sodium Pyruvate (Thermo Fisher, cat. # 11360070)
Penicillin-Streptomycin (Thermo Fisher, cat. # 15140122)
HEPES (Thermo Fisher, cat. # 156300806)
MEM Non-Essential Amino Acids Solution (Thermo Fisher, cat. # 11140050)
DPBS, no calcium, no magnesium (Thermo Fisher, cat. # 14190144)
ACK Lysing Buffer (Thermo Fisher, cat. # A1049201)
Naive CD4+ T Cell Isolation Kit, mouse (Miltenyi Biotec, cat. # 130–104-453)
Dynabeads Mouse T-Activator CD3/CD28 (Thermo Fisher, cat. # DB11452)
MACS® BSA Stock Solution (# 130–091-376)
autoMACS® Rinsing Solution (# 130–091-222)
Cell Activation Cocktail (without Brefeldin A) (Biolegend, cat # 423301)
Brefeldin A Solution (Biolegend, cat #420601))
Zombie NIR™ Fixable Viability Kit (Biolegend, cat #423105)
Cell staining buffer (Biolegend, cat #420201)
eBioscience™ Foxp3 / Transcription Factor Staining Buffer Set (Thermo Fisher, cat. # 00–5523-00)
Brilliant Violet 421™ anti-mouse CD4 Antibody (Biolegend, cat # 100437)
FITC anti-mouse IL-17A Antibody (Biolegend, cat # 506907)
PE anti-mouse IL-4 Antibody (Biolegend, cat # 504104)
APC anti-mouse IFN-γ Antibody (Biolegend, cat # 505809)
Recombinant Murine IL-2 (Peprotech, cat# 212–12)
Recombinant Murine IFN-γ (Peprotech, cat# 315–05)
Recombinant Murine IL-12p70 (Peprotech, cat# 210–12)
Recombinant Murine IL-4 (Peprotech, cat# 214–14)
Recombinant Murine IL-6 (Peprotech, cat# 216–16)
Recombinant Human TGF-β (Peprotech, cat# 100–21)
InVivoMAb anti-mouse IFNγ (BioXCell, Cat# BE0054)
InVivoMAb anti-mouse IL-4 (BioXCell, Cat# BE0045)
InVivoMAb anti-mouse IL-12p40 (BioXCell, Cat# BE0051)
CO2 incubator (By researcher’s availability)
96 well flat bottom plate, cell culture treated (Thermo Fisher, cat. # 14190144)
Hemocytometer or cell counting devices (By researcher’s availability)
autoMACS® Pro Separator or Manual MACS® Magnetic Separators
Flow cytometer (By researcher’s availability)
Isolation of naïve CD4+ T cells
-
1
Euthanize C57BL/6J mice (or other strains) according to an approved animal protocol and collect spleens (and lymph nodes if necessary).
-
2
Mash the collected organs with forceps on 6cm dishes and pass them through 70 μm cell strainer attached to 50 mL conical tubes.
If T cells are to be isolated from non-lymphoid organs, enzymatic digestion should be used rather than mechanical liberation. Choose collagenase lV as your first choice as some enzyme can digest T cell lineage molecules that can affect cellular function in studies to be conducted.
-
3
Lyse the red blood cells from the collected organs by adding 2–3 mL of ACK lysis buffer (per spleen), and incubate the cells for 2 minutes in room temperature.
-
4
Add same volume of RPMI media and fill up to 10 mL with PBS.
-
5
Centrifuge 300g, 5 minutes in 4°C and aspirate supernatant.
-
6
Resuspend the cell pellet, count the cells using a hemocytometer and add MACS buffer to obtain a cell concentration of 1×10⁷ cells/40 μL.
Proceed with the steps listed below describing use of a Naïve CD4 Isolation Kit, mouse (# 130–104-453) and an autoMACS® Pro Separator.
-
7
Add 10 μL of Biotin-Antibody Cocktail for 1×10⁷ cells and mix.
-
8
Incubate in 4°C for 5 minutes.
Incubate in refrigerator (4°C) rather than on ice (< 2°C) for optimal binding of antibodies to the cells.
-
9
Add 20 μL of MACS buffer per 1×10⁷ cells.
-
10
Add 20 μL of Anti-Biotin Micorbeads per 1×10⁷ cells provided in the Kit.
-
11
Add 10 μL of CD44 Microbeads per 1×10⁷ cells provided in the Kit and mix.
-
12
Incubate cells at 4°C for 15 minutes.
-
13
Wash cells with PBS and resuspend pellet with MACS buffer (1×10⁸ cells/500 μL).
Collect a small fraction of cells before running the autoMACS if an evaluation of the purification of the naïve CD4+ T cells by the sorting step is desired.
-
14
Run “Depletes” program installed on the autoMACS to obtain desired cells in the negative fraction.
Collect small fraction of cells from positive and negative fraction for evaluating the purity of naïve CD4+ T cells by flow cytometry.
-
15
Wash cells with PBS and count cell numbers.
-
16
Adjust to 2 × 10⁶/mL in RPMI media (in glutamine-free condition and proceed to step 17.
Stain cells with antibodies against CD4, CD45RB, CD62L to determine the purity of sorted cells by flow cytometry.
Stimulation of naïve CD4+ T cells in the absence or presence of glutamine:
-
17
Calculate the amount of Dynabeads mouse T activator necessary for stimulation.
The magnitude of stimulation depends on the ratio of Dynabeads:cells. Each researcher should optimize the amount according to the T cell subset of interest. Here, ratio of 2:1 is used, therefore, 10 μL of magnetic beads is used for stimulating 2 × 10⁵ cells. The final volume of the mixture should be 200–250 μL/well. The culture can be scaled up to larger plates if desired.
-
18
Pre-coat the transfer tube with MACS buffer to avoid unnecessary loss of Dynabeads attached to the tube surface, especially when dealing with a small volume. Transfer the necessary volume of beads from the vial provided in the Kit into a 1.5 mL tube.
-
19
Add MACS buffer up 1 mL (approx. 10 times more of the Dynabeads volume) and place the tube on the separation magnet for 1 minute, remove the tube from the magnet and discard supernatant.
Repeat this procedure when utilizing >100 μL Dynabeads or else use a larger magnet that holds larger tubes; in the latter case scale up the amount of MACS buffer added.
-
20
Resuspend the Dynabeads with RPMI media (glutamine free) by adding 50 μL/2 × 105 cells.
-
21
Add 100 μL of purified naïve CD4+ T cells prepared in step 16 (2 × 10⁵ cells) and 50 μL of prepared Dynabeads together on 96 well cell culture plates containing RPMI media without glutamine with various amounts of glutamine as well as cytokine/neutralizing antibody cocktails as indicated in the table below providing common conditions for the induction of T helper cell subsets, Table 1)
Naïve T cells can be differentiated into various type of effector T cells depending on the cytokine environment in which they encounter antigens. For instance, Th1 cells are induced in vitro by culture with IL-2, IFN-γ, IL-12, and blocking anti-IL-4 neutralizing antibody; Th2 cells are induced in vitro by culture with IL-2, IL-4, and anti-IFN-γ neutralizing antibody; finally, Th17 cells are induced In vitro by culture with IL-6, TGF-β, anti-IL-4 and IFN-γ neutralizing antibodies. The table below (Table 1, Common conditions for induction of T helper subsets) can be used as a guide to establishing conditions for optimizing the differentiation of a desired T helper subset.
-
22
Culture purified CD4+ T cell in a 37°C, 5% CO2 incubator for 3–4 days under the above conditions and then proceed to analysis.
The best time point for analysis should be pre-optimized by kinetic evaluation of signature cytokine production (i.e., IFN-γ for Th1, IL-4 for Th2, and IL-17 for Th17 cells) by flow cytometry or ELISA analysis of culture supernatants. Longer culture can result in activation-induced cell death and thus inaccurate assessment of cell differentiation..
Table 1.
Troubleshooting Guide for DNA Blotting and Hybridization Analysis
| Problem | Possible Cause | Solution |
|---|---|---|
| Insufficient T helper induction | FBS quality not compatible | Determine the best FBS lot for use |
| Suboptimal dose of TCR activation | Optimize the dose of T cell stimuli | |
| Suboptimal dose of cytokine/neutralizing antibody | Optimize the concentration of the cytokine/neutralizing antibody | |
| Low purity of naïve T cells | Check the protocol provided by the isolation kit | |
Intracellular cytokine staining
-
23
Calculate the volume of Cell Activation Cocktail (provided as 500x the actual use concentration) and Brefeldin A (provided as 1000x the actual use concentration) to be added to the T cell culture to achieve the desired concentration of activator.
The desired concentration after addition is listed in the instructions provided by the manufacturer. These reagents are usually dissolved in DMSO or ethanol, and can be toxic to cells when the dose used is too high. A similar type of cocktail of PMA/Ionomycin are available from different vendor. T cells can be also stimulated by plate-coated anti-CD3/CD28 mAb as indicated below in the Alternative Protocol section. Typical amount of Cell Activation Cocktail and Brefeldin A to be added to the 200 μL culture can be 50 μL, making a total of 250 μL. In this case, the components can be prepared by making 5x concentrated cocktail. Researchers can use a higher concentration to add smaller amount of cocktail depending on the culture scale and the maximum amount of media that can be added to the culture plate.
-
24
Incubate for 4 hours in 37°C in a 5% CO2 incubator.
-
25
Collect cells in 1.5 mL tubes and place it on magnetic separator to separate the Dynabeads. Collect cells in a FACS tube and wash with 3 mL PBS, centrifuge at 300g, 5 minutes at room temperature and aspirate the supernatant.
Dynabeads can also be separated by using 96 well plate-based platform magnet. Further staining of cells can also be conducted in 96 well V plates or titer tubes, according to each lab’s preference.
-
26
Stain with Zombie NIR™ Fixable Viability Kit and incubate at room temperature for 15 minutes in the dark.
A Fixable Viability Kit is available from various vendors with different excitation/emission peaks.
-
27
Add FACS antibodies against T cell surface markers (i.e., CD4, CD45RB, CD62L, or TCR antibodies conjugated with fluorochromes which can be detected by the flow cytometer to be used) and incubate cells at room temperature for 10–15 minutes in the dark.
-
28
Add 1 mL of Cell Staining Buffer or MACS buffer, centrifuge at 300g for 5 minutes at room temperature and aspirate the supernatant.
-
29
Add 150 μL of Cyto-Fast™ Fix/Perm Buffer, mix, and incubate at room temperature for 20 minutes in the dark.
If nuclear transcription factors are to be simultaneously stained, eBioscience™ Foxp3 / Transcription Factor Staining Buffer Set should be used instead.
-
30
Add 1 mL of 1X Cyto-Fast™ Perm Wash solution, centrifuge at 300g for 5 minutes at room temperature and aspirate the supernatant.
-
31
Repeat the wash procedure indicated in 30.
-
32
Stain the cells by adding FACS antibodies against signature cytokines (i.e., IFN-γ for Th1, IL-4 for Th2, IL-17 for Th17 cells) diluted by 1X Cyto-Fast™ Perm Wash solution and then incubate at room temperature for 20 minutes in the dark.
-
33
Add 1 mL of 1X Cyto-Fast™ Perm Wash solution, centrifuge at 300g for 5 minutes at room temperature and aspirate the supernatant.
-
34
Add 1 mL of Cell Staining Buffer or MACS buffer, centrifuge at 300g for 5 minutes at room temperature and then aspirate the supernatant.
-
35
Resuspend cells in 200–300 μL of Cell Staining Buffer or MACS buffer.
-
36
Perform flow cytometry using available instrumentation.
Representative FACS data derived by use of the above Protocol is shown in Figure 2. Optimal levels of glutamine were necessary components in the culture for the various T cell helper subsets to attain maximal signature cytokine production. Glutamine exhibited dose-dependent enhancement of IFN-γ production by Th1 T cells whereas it enhanced Th2 and Th17 production only after reaching a threshold concentration. See Interpretation of Results for discussion of these differences.
Figure 2.

Results of studies conducted using Protocol 1. See discussion in the Understanding Results Section. (A) Flow-cytometric analyses of T cell differentiation into various T cell sunsets in the presence of increasing concentrations of glutamine. Naïve CD4+ T cells were stimulated and skewed to Th1, Th2, or Th17 cells using anti-CD3/CD28 mAb-conjugated beads in the presence of indicated amount of glutamine; intracellular cytokine staining was performed on day 4; representative plots are shown. (B) Percentage of total T cells single-positive for IFN-γ, IL-4, and IL-17 and representative of Th1, Th2 and Th17 cells respectively when induced in the presence of various concentrations of glutamine; pooled data from several independent studies are shown. Statistical significance was calculated using Prism 7 (GraphPad Software) by one-way ANOVA against 2 mM condition for each T cell subset. p<0.05 was considered statically significant. *p<0.05, **p<0.01, ***p<0.001.
Basic protocol 2:Evaluation of the role of glutaminolysis in T cell responses utilizing glutaminolysis inhibitors
Introduction:
A second way of assessing the contribution of glutaminolysis to a given T cell response is to determine the effect of glutaminolysis inhibitors on the magnitude of the response. This approach has the great advantage of being able to assess glutaminolysis without creating an artificial change in the energy sources already present in the microenvironment. Inhibitors that target critical components of the glutaminolysis pathway such as one of the glutamine transporters, glutaminase 1, and glutamate dehydrogenase can be employed in this approach. However, these inhibitors may have unintended toxicities and must be checked for their effects on cell viability before use.
In this Protocol T cells undergoing T cell subset differentiation are studied in the presence of optimal or even super-optimal amounts of glutamine to ensure that the amount of glutaminolysis utilized by the cell is not limited by the amount of glutamine in the culture medium. However, when this Protocol is adapted to an actual experimental cellular mixture, the amount of glutamine generated may suffice to set the underlying glutamine concentration and the amount of glutaminolysis occurring is in part determined by the available glutamine.
Materials:
ASCT2 (SLC1A5) inhibitor
V9302 (Selleck, cat# S8818)
GPNA (L-γ-Glutamyl-p-nitroanilide) (Selleck, cat# S6670)
Glutaminase 1 inhibitor
6-Diazo-5-oxo-L-norleucine (Tocris, cat# 6809)
BPTES (Sigma-Aldrich, cat# SML0601–5MG)
Compound 968 (Cayman Chemical, cat# 17199)
CB839 (Selleck, cat# S7655)
Glutamate dehydrogenase 1 inhibitor
ECGG (Epigallocatechin gallate) (Tocris, cat# 4524)
Protocol steps with step annotations:
-
1
Perform steps 1–20 indicated in the Basic Protocol.
-
2
Add 50 μL of cells (2 × 10⁵ cells) and 50 μL of Dynabeads prepared above together on 96 well cell culture plates with pre-optimized concentration of inhibitor. The final volume of culture should be 200–250 μL/well. Cultures can be scaled up by the use of larger plates if desired.
Multiple concentration of a selected inhibitor should be evaluated to determine its dose dependency and effect on the viability of the target cells. In this study, the effect of BPTES (Glutaminase 1 inhibitor) on T helper induction is shown. The toxicity of this inhibitor for the T cells being studied was evaluated by its effect on microscopic cell morphology. The dose selected for use (1–3 μM) did not cause obvious morphologic changes indicative of toxicity.
Selection of inhibitor should also depend on its inhibitory specificity in the target cell of interest. Thus, theoretically the inhibitor should only inhibit a particular glutaminolysis component and not another cellular componenent necessary for optimal cell function.
Typical concentration ranges of various glutaminolysis inhibitors for use in optimization studies are listed below.
ASCT2 (SLC1A5) inhibitor:
V9302 (1–10 μM)
GPNA (L-γ-Glutamyl-p-nitroanilide) (0.1–10 mM)
Glutaminase 1 inhibitor:
6-Diazo-5-oxo-L-norleucine (1–10 μM)
BPTES (1–10 μM)
Compound 968 (1–10 μM)
CB839 (1–10 μM)
Glutamate dehydrogenase 1 inhibitor:
ECGG (1–10 μM)
-
3
Culture in 37°C, 5% CO2 incubator for 3–4 days for analysis
Best time point for analysis should be pre-optimized by kinetic evaluation of signature cytokine production (i.e., IFN-γ for Th1, IL-4 for Th2, and IL-17 for Th17 cells) by flow cytometry or ELISA.
-
4
Resume to Intracellular cytokine staining listed above
Representative FACS data is shown in Figure 3 and is illustrative of the study of cells undergoing T cell subset differentiation in the presence of an optimal concentratioin of glutamine as determined in Protocol 1. The addition of glutaminase inhibitor blocked IFN-γ production from developing Th1 cells in a dose dependent manner. In contrast, IL-4 from Th2 cells and IL-17 from Th17 cells was inhibited only after a threshold dose of inhibitor.
Figure 3.

Results of studies conducted using Protocol 2. See discussion in the Understanding Results Section. (A) Pooled data of flow-cytometric analyses of T cells induced to differentiate into various T cell subset when cultured in the presence of 2 mM glutamine plus increasing amounts of BPTES. Naïve CD4+ T cells were stimulated and skewed to Th1, Th2, or Th17 differentiation using anti-CD3/CD28 mAb-conjugated beads in the presence of glutaminase 1 inhibitor BPTES. Intracellular cytokine staining was performed on day 4, percentages of total T cells positive of IFN-γ, IL-4, and IL-17 indicative of Th1, Th2 and Th17 cells respectively are shown. Statistical significance was calculated using Prism 7 (GraphPad Software) by one-way ANOVA against 2 mM condition for each T cell subset. p<0.05 was considered statically significant. *p<0.05, **p<0.01, ***p<0.001.
BASIC PROTOCOL 3: Evaluation of the effect of Glutaminolysis on Cellular Oxidative Phosphorylation/Glycolysis
Introductory paragraph:
As indicated above, culture of naïve T cells in the presence of different combinations of cytokines and antibodies results in the differentiation of specific effector T helper cells, each utilizing a unique balance of oxidative phosphorylation (OXPHOS), glycolysis and glutaminolysis to generate ATP. However, it is important to point out that usage of glutaminolysis can have an impact on the usage of OXPHOS or glycolysis; thus, the evaluation of the latter is necessary to obtain a complete picture of cell bioenergetics in the face of increased glutaminolysis. Here, we provide a Protocol for evauating real-time OXPHOS and glycolysis status using flux analysis Kits. An explanation of how OXPHPOS and glycolysis is being measured in this Protocol as well as the definition of the various parameters to be analyzed is provided the Commentary and in Figure 4. Inhibitors supplied in each kit should be pre-optimized as they are toxic if used at too high concentration with respect to the cells under study. The inhibitors that can be evauated in this Protocol are listed below.
Figure 4.

Schematic diagram depicting the evaluation of real-time OCR measurement. See Commentary for discussion. Representative graphs of OCR status under various conditions presnt during conduction of a Mitostress test with a Seahorse XFe96/24 Analyzer (Agilent) in the presence or absence of glutamine. A. Hypothetical result obtained with injection of control media into the sensor cartridge; B. Hypothetical result obtained with injection of a given amount of glutamine into the sensor cartridge. Changes in the oxygen consumption rate due to glutaminolysis is indicated by the orange area. (Glutaminolysis-linked OCR (ATP-Equiv) was calculated by subtracting the basal OCR from the value after glutamine addition (before oligomycin addition) of each well. Total OXPHOS-linked OCR (ATP-Equiv) was calculated by subtracting the value after oligomycin addition (before the FCCP addition) from the value after glutamine addition (before oligomycin addition) of each well. Definition of OXPHOS inhibitors injected into sensor cartridge at various points, Oligo: Oligomycin A (complex V inhibitor), FCCP: Carbonyl cyanide 4-(trifluoromethoxy)phenylhydrazone (mitochondrial oxidative phosphorylation uncoupler), ROT: Rotenone (complex I inhibitor), AA: Antimycin A (complex lll inhibitor).
Oligomycin A: ATP synthase inhibitor
FCCP: Oxidative phosphorylation decoupler
Rotenone: Mitochondrial electron transport chain complex I inhibitor
Antimycin A: Mitochondrial electron transport chain complex Ill inhibitor
2-Deoxy-D-glucose: Glucose analog
Materials:
Seahorse XF Glycolysis Stress Test Kit (Agilent, cat# 103020–100)
Seahorse XF Mito Stress Test Kit (Agilent, cat# 103015–100)
Seahorse XFe96 FluxPak (Agilent, cat# 102416–100)
Seahorse XF RPMI Medium, pH7.4 (Agilent, cat# 103576–100)
Seahorse XF Pyruvate Solution (Agilent, cat# 103578–100)
Seahorse XF 200 mM Glutamine Solution (Agilent, cat# 103579–100)
Corning® Cell-Tak (TM) Cell and Tissue Adhesive (Merk, cat# CLS354240)
Seahorse XFe96/24 Analyzer (Agilent)
Day before analysis
-
1
24 hours prior of analysis, collect cultured T cells from basic protocol 1, step 22 (differentiated in 2 mM glutamine-supplemented RPMI culture media) and add PBS, centrifuge 300g, 5 minutes in 4°C and aspirate supernatant for glutamine starvation
-
2
Resuspend in RPMI culture media (without glutamine) and supplement with cytokine/neutralizing antibodies cocktail used in basic protocol 1, step 23 and as shown in the table (Common condition for inducing T helper subsets).
-
3Prepare Seahorse flux analyzer and XF Calibrant as follows:
- Turn on the Seahorse XFe96/24 Analyzer and computer and then open “Wave” software.
- Open a new Extracellular Flux Assay Kit, (provided in Seahorse XFe96 FluxPak) lift up the sensor cartridge and put it upside down,; next add 200 μL of UPW into each well of the utility plate using a multi-channel pipette; put the sensor cartridge back on to the utility plate and incubate the plate in a non-CO2 incubator at 37°C (6 hrs to 72 hrs).
- Transfer 20 mL of XF Calibrant (per plate) into a 50 mL tube and warm to 37°C in a non-CO2 incubator.
-
4Prepare Cell-Tak coated culture plate as follows:
- Load 25 μL of Cell-Tak solution into each well of a XF culture plate and let the loaded plate sit for 25 minutes at room temperature.
- Remove the solution from the wells and add 200 μL of UPW to the empty wells.
- Remove UPW after a few minutes and then allow the plates to dry at room temperature.
- Store the plates until they are used.
Day of analysis of oxidative phosphorylation (Mitostress Test)
-
5
Lift up the sensor cartridge in the assay kit and put it upside down, decant the UPW, and add 200 μL of pre-warmed XF Calibrant; put the sensor cartridge back and allow the cartridge to hydrate at 37°C in a non-CO2 incubator for 1hr.
-
6
Collect and count cultured T cells and adjust the concentration to 4 × 10⁶/mL with XF media (without glutamine).
-
7
Plate 50 μL (2 × 10⁵ cells) into Cell-Tak pre-coated microplate.
The number of cells to be plated should be optimized for each cell subset of interest. This can be done by seeding different numbers of cells (i.e., 1 × 10⁵, 2 × 10⁵, and 4 × 10⁵ cells) and then assessing their basal level of oxygen consumption rate (OCR) by evaluating the OCR range of the intial step of the Mitostress Test. Optimal rate should be within 50–150 pmol/min). Study at least three replicates for each condition.
-
8
Centrifuge the microplate at 200g for 1 minute at room temperature.
Do not use the corner of the microplate (A1/A12/H1/H12) as it will be used for background correction.
Make sure the cells are attached on the microplate by observation with a microscope.
-
9
Incubate the cells in 37°C in a non-CO2 incubator for 20 minutes
-
10
Add 130 μL of pre-warmed of XF media (without glutamine) to each well (which then will contain 180 μL).
-
11
Incubate the cells at 37°C in a non-CO2 incubator for a further 20 minutes.
-
12
Prepare Oligomycin A, FCCP, and ROT/AA (provided in the Mitostress Test Kit) and glutamine in glutamine-free XF media as follows:
Glutamine: 20 mM dissolved in 3000 μL XF media.
Oligomycin A: Dissolve powder provided in the Mitostress Kit in 630 μL of XF media and then combine 300 μL of the solution obtained with 2700 μL of XF media.
FCCP: Dissolve powder provided in the Mitostress Kit in 720 μL of XF media and then combine 600 μL the solution obtained with 2400 μL of XF media.
ROT/AA: Dissolve powder provided in the Mitostress Kit in 540 μL of XF media and then combine 300 μL of the solution obtained with 2700 μL of XF media.
The optimal concentration of Oligomycin A can be found by carrying out the Mitostress Test with serial concentrations of Oligomycin A (Control, 0.5 μM, 1.0 μM, and 2.0 μM) and selecting for the definitive study the lowest concentration that results in peak OCR inhibition. The concentration of FCCP also needs optimization as it can be highly toxic when used at a dose too high for the cell under study. Optimization can be conducted by using serial concentration of FCCP (Control, 0.125 μM, 0.25 μM, 0.5 μM, 1.0 μM, and 2.0 μM) to find the optimal dose that provides a peak OCR level. Concentration of 0.5 μM of ROT/AA can be generally used for most cells without further optimization.
-
13
Load the above reagents into the Sensor Cartridge as follows:
Glutamine or control XF media: 20 μL into port A (final 2.0 mM)
Oligomycin A: 22 μL into port B (final 1.0 μM)
FCCP: 25 μL into port C (final 2.0 μM)
ROT/AA: 28 μL into,port D (final 0.5 μM)
-
14
Set the Sensor Cartridge and load it into to the Seahorse flux analyzer
-
15
Run the “Mitostress test with acute injection” program.
Set acute injection for 6 cycles (3 minute interval, OCR/ECAR measurement at the end of each cycle). A typical analysis of each T cell subset is shown in Figure 5.
Figure 5.
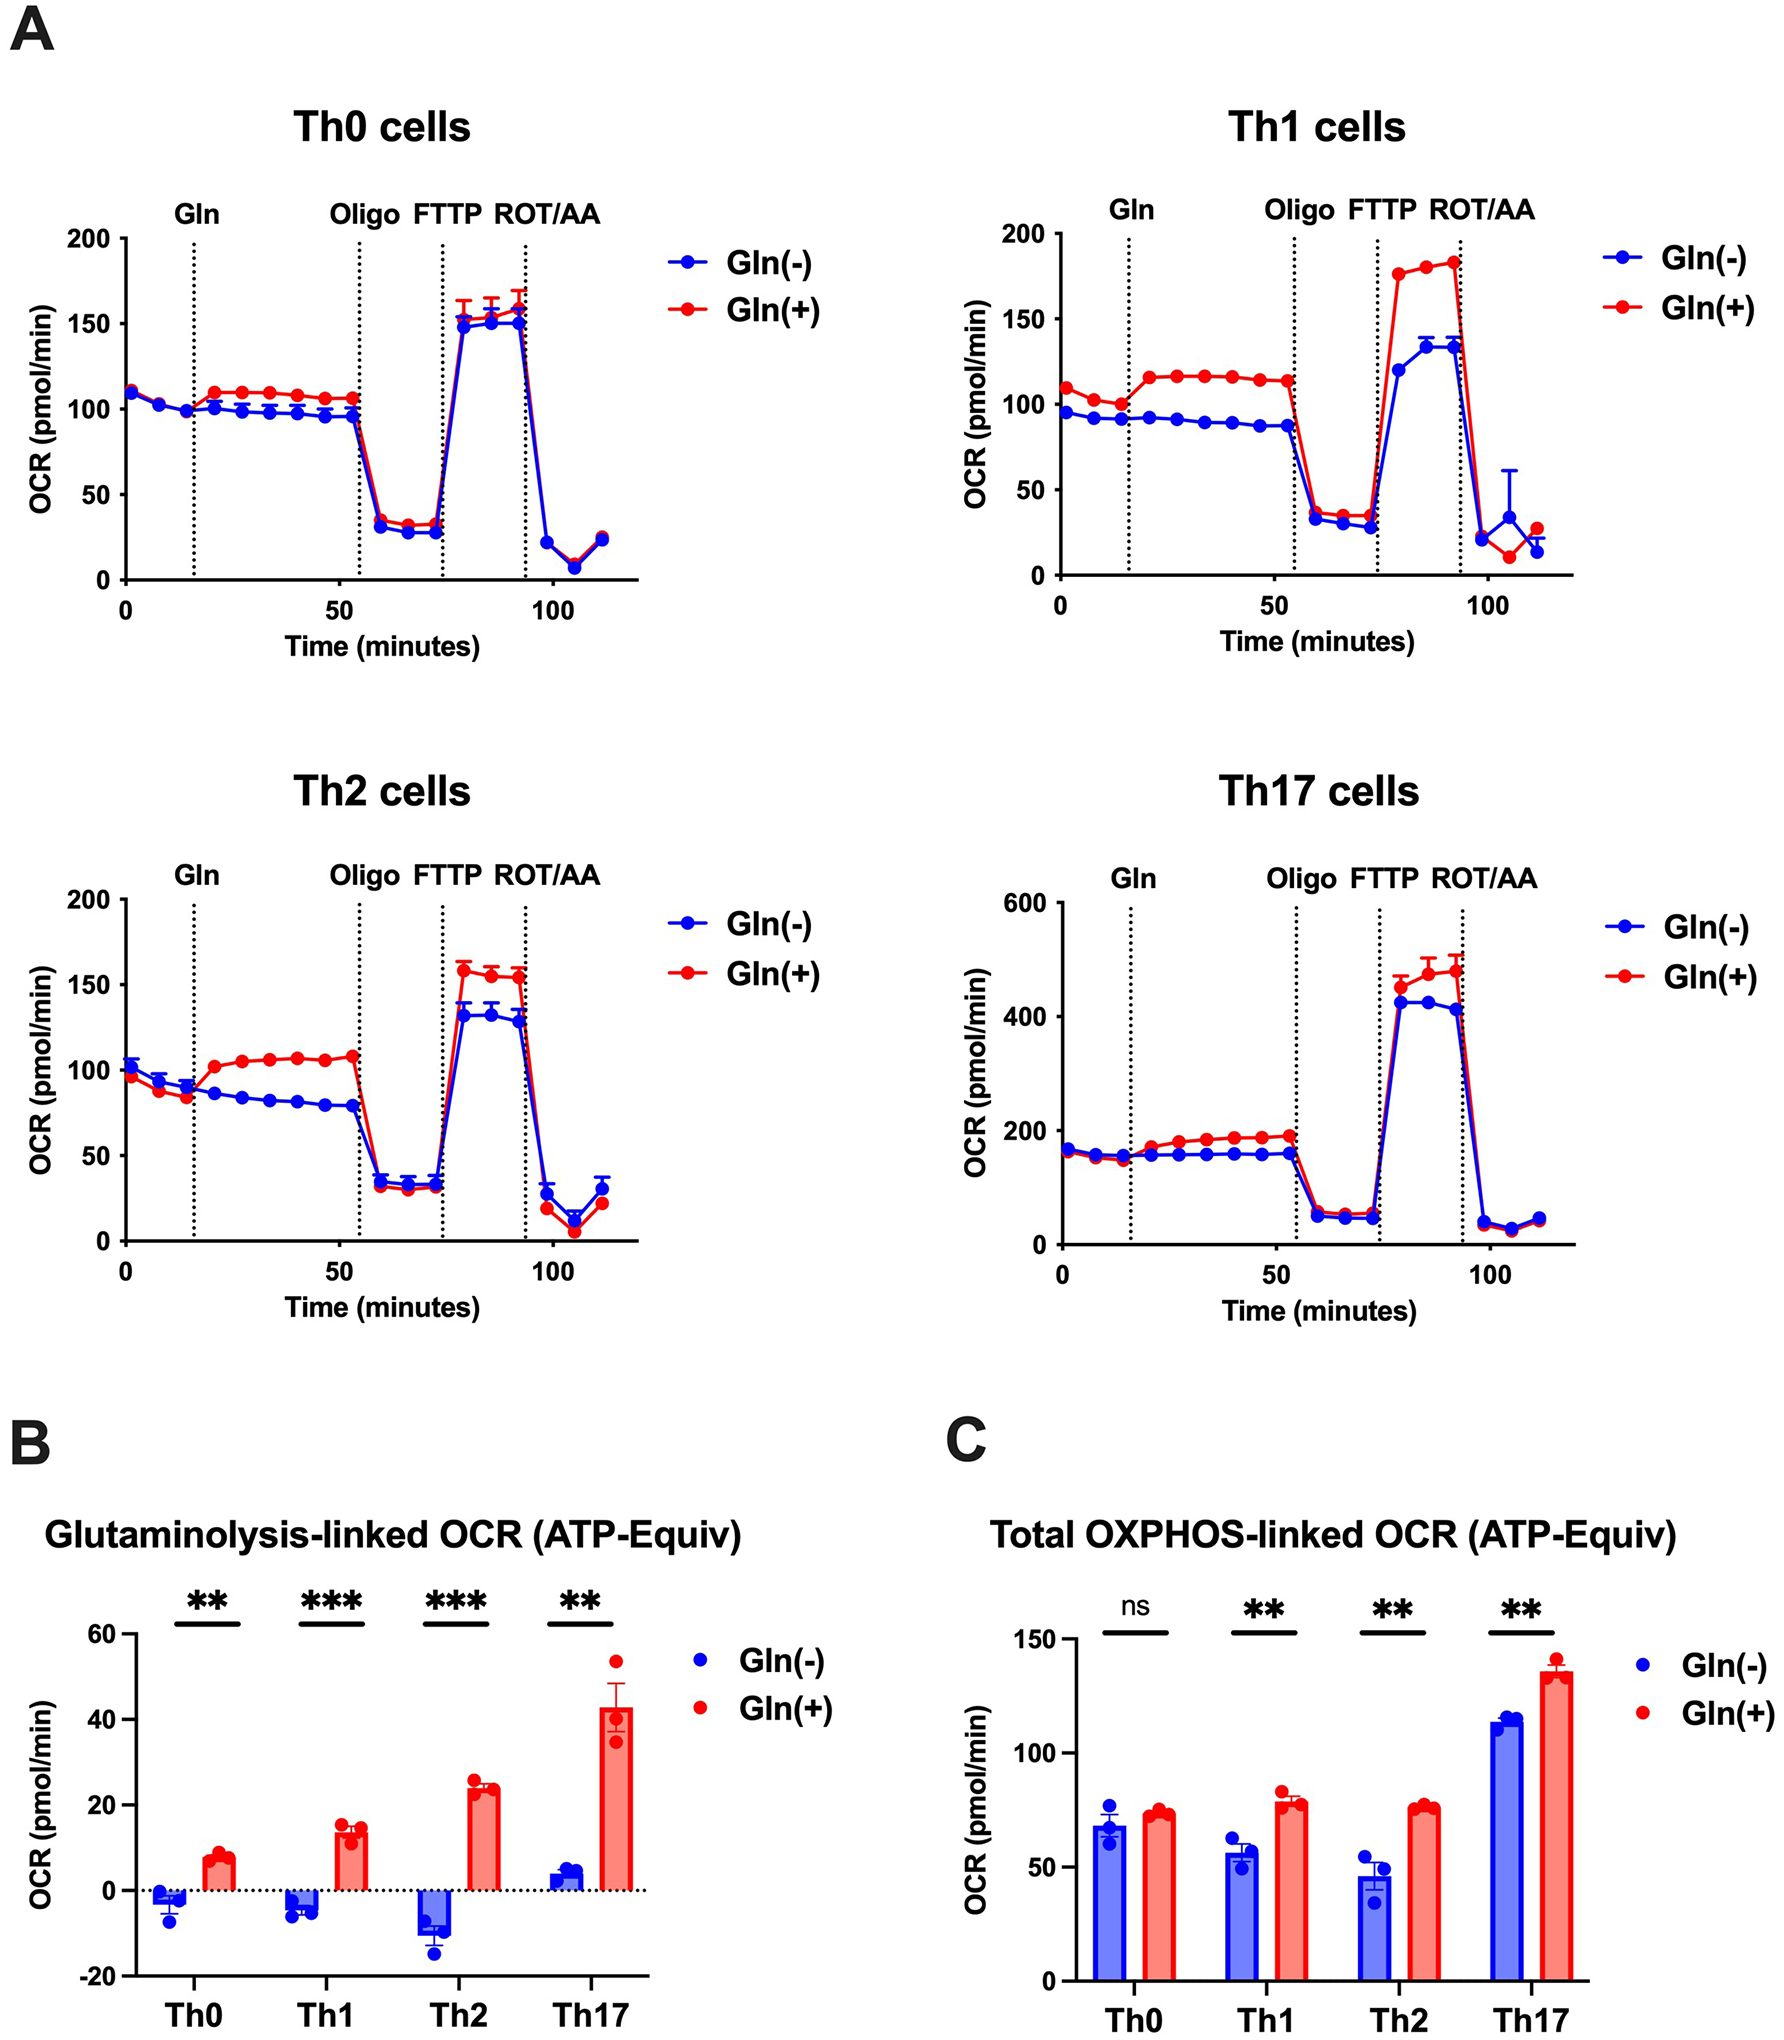
Results of OCR measurements conducts with cultures of various T cell subsets as diagrammed in Figure 4. (A) Changes in OCR evaluated by Mitostress test of indicated T helper subsets. (B) Glutaminolysis-linked OCR (ATP-Equiv) calculated by the equation indicated in Figure 4; OCR declines in all T cell subsets except Th17 cells in the absence of glutamine but increases in all subsets in its presence. (C) Total OXPHOS-linked OCR (ATP-Equvi) in the various T cell subsets (generation from both basal- and glutamine-driven oxidative phosphorylation) in the presence and absence of glutamine. Statistical significance was calculated using Prism 7 (GraphPad Software) by unpaired two tailed t test against 2 mM condition for each T cell subset. p<0.05 was considered statically significant. *p<0.05, **p<0.01, ***p<0.001.
Day of analysis for Glycolysis analysis (Glycolysis Stress Test):
-
16
Perform steps 1–11 indicated in Basic Protocol 3.
-
17
Prepare glucose, Oligomycin A, and 2-DG (provided in the Glycolysis Test Kit) and glutamine in glutamine-free XF media as follows:
Glutamine: 20 mM dissolved in 3000 μL XF media.
Glucose (Dissolve powder provided in the Kit in 3000 μL of XF media)
Oligomycin A: Dissolve powder provided in the Kit in 630 μL of XF media and then combine 300 μL of the solution obtained with 2700μL of XF media.
2-DG: Dissolve powder provided in the Kit in 3000 μL of XF media.
The concentration of oligomycin A needs optimization for each cell subset as noted above in step 12.
-
18
Load above listed reagents into the Sensor Cartridge
Glutamine or control media: 20 μL into port A (final 2.0 mM)
Glucose: 22 μL into port B (final 10 mM)
Oligomycin A: 25 μL into port C (final 2.0 μM)
2-DG: 28 μL into port D (final 50 mM)
-
19
Set the Sensor Cartridge and load it into the Seahorse flux analyzer
-
20
Run the “Glycolysis stress test with acute injection” program.
Set measurement of acute injection of glutamine for 6 cycles (3-minute interval, OCR/ECAR measurement at the end of each cycle). A typical analysis of each T cell subset is shown in Figure 6.
Figure 6.

ECAR Measurements. (A) Schematic diagram of ECAR status evaluation during conduction on a Glycolysis stress test by Seahorse XFe96/24 Analyzer in the presence or absence of glutamine. (Left) Hypothetical result obtained with injection of control media into the sensor cartridge. (Right) Hypothetical result obtained with injection of a given amount of glutamine into the sensor cartridge. Changes in the glycolysis-linked ECAR (ATP-Equiv) was calculated by subtracting the last measurement before glucose injection from the last measurement before oligomycin A injection. (B) Results of ECAR measurement during the Glycolysis stress test of various T cells subsets. (C) Glycolysis-linked ECAR (ATP-Equiv) calculated by the equation indicated in (A). Statistical significance was calculated using Prism 7 (GraphPad Software) by unpaired two tailed t test against 2 mM condition for each T cell subset. p<0.05 was considered statically significant. *p<0.05, **p<0.01, ***p<0.001.
REAGENTS AND SOLUTIONS:
Cell-Tak solution
0.1M NaHCO3 (pH8): 2.85 mL
1M NaOH: 50 μL
Cell-Tak: 100 μL
Use the solution immediately after preparation
XF RPMI media (without glutamine) for Mitostress test
Seahorse XF RPMI Medium, pH7.4: 98 mL
Seahorse XF Pyruvate Solution: 1 mL (final 1 mM)
Seahorse XF 1.0 M Glucose Solution: 1 mL (final 10 mM)
Use the solution immediately after preparation
XF RPMI media (without glutamine) for Glycolysis stress test
Seahorse XF RPMI Medium, pH7.4
COMMENTARY:
Background Information:
During both innate and adaptive immune responses, immune cells undergo multiple activation and expansion steps, each requiring expense of the universal energy currency, ATP. The most efficient way of generating ATP is by an oxygen-dependent (aerobic) process occurring mainly in the mitochondria known as oxidative phosphorylation. As shown in Figure 1, oxidative phosphorylation is fueled by pyruvate, a component derived from glucose that enters the TCA (Krebs) cycle and is metabolized in steps defined by the cycle that result in the release of NADH and FADH2 as well as free electrons and protons (H+). The electrons enter a transport process that moves them through a series of enzyme complexes (numbered I-V in the Figure) that thus facilitates the pumping of protons into outer area of the mitochondrion, the intermembrane space. Ultimately, the protons form a high-to-low gradient between the outer and inner areas of the mitochondrion that is normalized and used as a source of energy in complex V (ATP synthase) to convert ADP to ATP. As mentioned earlier, oxidative phosphorylation is capable of slowly producing large amounts of ATP and, as such, is a major source of cellular energy. However, when undergoing stimulation and activation cells usually require large, but short extra bursts of energy and for this it turns to glycolysis, the process that involves the conversion of glucose to pyruvate and then to lactate. This anaerobic process generates relatively small amounts of ATP (as compared to oxidative phosphorylation) but in a rapid fashion. Glutaminolysis, as also shown in Figure 1, further augments ATP generation by feeding into the TCA cycle (either directly through α-ketoglutarate or indirectly through the GABA shunt and succinate). Thus, ATP resulting from glutaminolysis is derived from enhanced oxidative phosphorylation due to “force-feeding” the TCA cycle.
The various parameters of cellular bioenergetics outlined above are measured in this Protocol using an analzer (the Seahorse XFe96/24 Analyzer (Agilent)) that measures the oxygen consumption rate (OCR) of the cells in the culture under study. The OCR is indicative of mitochondrial respiration and is thus an assessment of the level of oxidative phosphorylation or, by extention, of ATP generation due to oxidative phosphorylation. As shown in Figure 4, the OCR in cells cultured in the absence of glutamine have a baseline value reflecting the cellular utilization of pyruvate derived from glucose (or possibly other energy substrates) to drive oxidative phosphorylation. Upon addition of glutamine the OCR increases because, as mentioned, glutaminolysis induce ATP production via its effect on the TCA cycle and oxidative phosophorylation. The magnitude of this increase, the glutaminolysis-induced OCR (ATP-Equiv), is a reflection of the amount of ATP generated that is attributable to glutaminolysis and is measured by the level recorded by the last OCR value before injection of oligomycin A into the culture minus the last OCR value before glutamine was injected into the culture. Note that the injection of oligomycin A is used as an endpoint because this agent is an inhibitor of enzyme complex V (ATP synthase) that shuts down ATP generation due to oxidative phosphorylation and thus defines the extent of the OCR increase.
Following oligomycin A injection the OCR drops to a floor defined by oxygen consumption due to oxidation of “leaking” protons occurring in the absence of electron transport and ATP geneneration plus non-mitochondrial cellular oxygen consumption. Oxygen consumption at this level continues until FCCP is injected into the system and oxygen consumption increases to a peak level. This occurs because FCCP is an “uncoupling’ agent that abolishes the proton gradient in the mitochondrion and thereby allows maximal proton oxidation (i.e., maximal oxygen consumption). On this basis, total ATP production that includes both that originating from basal oxidative phosphorylation and glutaminolysis-induced oxidative phosphorylation is estimated from the last OCR measurement before oligomycin A treatment minus last OCR measurement before FCCP treatment, indicated as total OXPHOS linked OCR (ATP-Equiv) in figure 4. A final maneuver consists of injecting Rotenone and antimycin A into the culture, agents that inhibit enzyme complexes I and III and thus shuts down mitochondrial oxygen completely. At this point only non-mitochondrial oxygen consumption is occurring.
Glycolysis is evaluated in these Protocols in the Glycolysis Stress Test in which the Extra-Cellular Acidification Rate (ECAR) of the cells under study is measured. In this Test, glucose-deprived cells are treated with glucose (as Illustrated in Figure 6) and, under anaerobic conditions the glucose is converted to pyruvate and the latter is coverted to lactic acid; this, in turn, leads to the both generation of ATP, the energy by-product of the glycolytic process as well as acidification of medium; thus, the rate of acidification becomes a measure of ATP produced by glycolysis. The rate of acidification (glycolysis) is limited by oxidative phosphorylation since the latter consumes pyruvate and prevents lactic acid production. Thus, the rate of acidification upon addition of oligomycin A, an agent that blocks mitochondrial respiration, marks the maximal level of glycolysis occurring in the presence of oxidative phosphorylation, i.e, the level of glycolysis occurrung in the cells under study. After addition of oligomycin A the acidification rate increases as it is no longer limited by oxidative phosphorylation and ECAR reaches a peak level that indicates the maximum capacity of the cells to carry on glycolysis. This can be shut off by addition of 2-deoxy glucose (2-DG), a. glucose analog that cannot be converterd into pyruvate but nevertheless competitively inhibits glucose metabolism. Therefore addition of 2-DG induces a sharp drop in ECAR and ultimately provides an assessment of the non-glycolytic acidification rate. Accordingly, glycolysis is estimated by the calculation of last ECAR measurement before oligomycin A treatment minus last ECAR measrument before glucose treatment.
Critical Parameters:
Optimal T helper subset induction outlined in Basic Protocol 1 is dependent on several factors. The most critical of these is the fetal bovine serum (FBS) used for culture of the cells undergoing differentiation because the FBS may contain bovine/mouse cross-reactive cytokines (such as TGF-β) that negatively influence cell differentiation. If this is suspected, one may consider changing the lot or the provider of the FBS. Another factor to consider is the level of TCR activation being used. The dose of anti-CD3/CD28 mAb-conjugated beads used to stimulate naïve T cells indicated in basic protocol 1 was pre-optimized in our hands, but this needs to be optimized by each laboratory. Perhaps a more reproduceable stimulation option that one should consider using is plate-immobilized anti-CD3/CD28 stimulation since with this method the amount of stimulating antibody is more standardized. Finally, stimulation of naïve T cells to induce helper T cells can also be done using antigen or antibody coated feeder cells such as irradiated splenocytes; however, in this case flow cytometric sorting of the differentiated helper T cell helper subset will be absolutely necessary for downstream bioenergetic studies. Measurement for OCR and ECAR on the flux analyzer require pre-optimiation of cell number seeded per well. Overseeding of cells may result in high level of baseline, which can cause an artifactual plateau in the OCR/ECAR measurement. As indicated in Basic Protocol 3, optimization of oligomycin A and FCCP in necessary before actual testing of glutamine effect of other components of interest. Overdoses of oligmycin A and FCCP may be be in excess of the dose necessary to inhibit complex a and b resepectively and cause cell toxicity.
Troubleshooting:
Interpretation of Results:
As shown in Figure 2, the effect of glutaminolysis on the production of signature cytokines from each T cell subset is variable. IFN-γ production by Th1 T cells increases with the concentration of glutamine, in a dose dependent manner indicating that Th1 differentiation is increased by glutaminolysis at all levels of glutamine concentration; in some contrast, IL-4 and IL-17 production by Th2 and Th17 T cells are not increased by glutaminolysis until a particular level of glutamine is available, which differs in Th2 and Th17 differentiation. Thus, IL-4 production by Th2 cells is greatly augmented by glutaminolysis at a glutamine concentration of 2 mM, and IL-17 production by Th17 cells is greatly augmented at a glutamine concentration of 0.5 mM. As shown in Figure 3, evaluation of glutaminolysis-derived energy generation with the use of a blocker (BPTES) is consistent with the direct measurement of glutaminolysis summarized in Figure 2 in that it shows dose dependent decrease of IFN-γ production in Th1 T cells differentiation and concentration-specific dependence in Th2/Th17 T cell differentiation. This suggests that, at least in the case of T cells, utilization of glutaminolysis as a source of enhanced oxidative phosphorylation is not simply due to availability of glutamine but instead is a regulated process that is cell type-specific. A possible mechanism of such regulation is that during certain types of differentiation the entry of glutamine metabolytes into the TCR cycle is impeded or redirected until a threshold of glutamine concentration is reached, this to constrain such differentiation in certain micro-environments. The fact that a glutamine metabolite, α-ketoglutarate influences mTOR pathway signaling and its effects on T cell subset induction tends to support this view (Delgoffe et al., 2009). This is not to say that glutaminolysis has a reduced effect on Th2 and Th17 T cell differentiation. In fact, as shown in Figure 2B, 5B, and 5C, at optimal concentration of glutamine, glutaminolysis has a equal or greater effect on oxidative phosphorylation during Th2 annd Th17 differentiation as it has during Th1 differentiation and an equal capacity to enhance subset cytokine synthesis.
The effect of glutamine metabolism on glycolysis in T cells is not as clearly defined as its effect on oxidative phosphorylation. As shown in figure 6, differentiating Th1 T cells exhibited increased glycolysis when cultured in a glutamine-rich environment whereas differentiating Th2 and Th17 T cells exbited only minimal increases at best. It has been shown that in neuronal cells glutamine-derived α-ketogluatarate can be metabolized to malate in the TCA cycle and then converted to pyruvate; the latter then serves as the substrate for anaerobic glycolysis (Hertz & Chen, 2017). It is possible that this metabolic pathway is also occurring in differentiating Th1 T cells but, for reasons not yet defined, not in differentiating Th2 or TH17 T cells. In any case, these studies point to the fact that T cell energy generation is a diverse process that probably relects the unique requirements of the various differentiation programs.
Time Considerations:
T helper cell induction takes 3–4 days, and can be extended up to 7 days by re-stimulation and replenish of cytokines and neutralizing antibodies. Intracellular cytokine staining can be done on the day of analysis, but can also be fixed and stored overnight for flow cytometry studies. Analysis conducted on with the Agilent flux analyzer can be performed within several hours depending on the program used.
Common condition of inducing T helper subsets
| Cell subset | Cytokine/antibody | Final concentration |
|---|---|---|
| Th0 | IL-2 | 2 ng/mL |
| Th1 | IL-2 | 2 ng/mL |
| IL-12 | 1 ng/mL | |
| IFN-γ | 1 ng/mL | |
| Anti-IL-4 mAb | 5 μg/mL | |
| Th2 | IL-2 | 1 ng/mL |
| IL-4 | 1 ng/mL | |
| Anti-IFN-γ mAb | 5 μg/mL | |
| Anti-IL-12 mAb (*) | 5 μg/mL | |
| Th17 | IL-6 | 20 ng/mL |
| TGF-β | 2 ng/mL | |
| Anti-IL-4 mAb | 5 μg/mL | |
| Anti-IFN-γ mAb | 5 μg/mL |
Consider adding when antigen presenting cells are used to stimulate T cells
ACKNOWLEDGEMENTS:
Masaki Tajima was supported by JSPS KAKENHI Grant number 19K16881. Warren Strober was supported by Intramural NIAID project A1000345–35.
Footnotes
CONFLICT OF INTEREST STATEMENT:
The authors declare no conflict of interest.
Contributor Information
Masaki Tajima, Integrated High-Order Regulatory Systems Division, Center for Cancer Immunotherapy and Immunobiology, Graduated School of Medicine, Kyoto University, Kyoto 606-8507 Japan.
Warren Strober, Mucosal Immunity Section, Laboratory of Clinical Immunology and Microbiology, National Institute of Allergy and Infectious Diseases, National Institutes of Health, Bethesda, MD 20892 USA.
DATA AVAILABILITY STATEMENT:
Data are available from the corresponding author upon request.
LITERATURE CITED:
- Chapman NM, Boothby MR, & Chi H (2020). Metabolic coordination of T cell quiescence and activation. Nat Rev Immunol, 20(1), 55–70. doi: 10.1038/s41577-019-0203-y [DOI] [PubMed] [Google Scholar]
- Delgoffe GM, Kole TP, Zheng Y, Zarek PE, Matthews KL, Xiao B, … Powell JD (2009). The mTOR kinase differentially regulates effector and regulatory T cell lineage commitment. Immunity, 30(6), 832–844. doi: 10.1016/j.immuni.2009.04.014 [DOI] [PMC free article] [PubMed] [Google Scholar]
- Geltink RIK, Kyle RL, & Pearce EL (2018). Unraveling the Complex Interplay Between T Cell Metabolism and Function. Annu Rev Immunol, 36, 461–488. doi: 10.1146/annurev-immunol-042617-053019 [DOI] [PMC free article] [PubMed] [Google Scholar]
- Hertz L, & Chen Y (2017). Integration between Glycolysis and Glutamate-Glutamine Cycle Flux May Explain Preferential Glycolytic Increase during Brain Activation, Requiring Glutamate. Front Integr Neurosci, 11, 18. doi: 10.3389/fnint.2017.00018 [DOI] [PMC free article] [PubMed] [Google Scholar]
- Johnson MO, Wolf MM, Madden MZ, Andrejeva G, Sugiura A, Contreras DC, … Rathmell JC (2018). Distinct Regulation of Th17 and Th1 Cell Differentiation by Glutaminase-Dependent Metabolism. Cell, 175(7), 1780–1795 e1719. doi: 10.1016/j.cell.2018.10.001 [DOI] [PMC free article] [PubMed] [Google Scholar]
Associated Data
This section collects any data citations, data availability statements, or supplementary materials included in this article.
Data Availability Statement
Data are available from the corresponding author upon request.