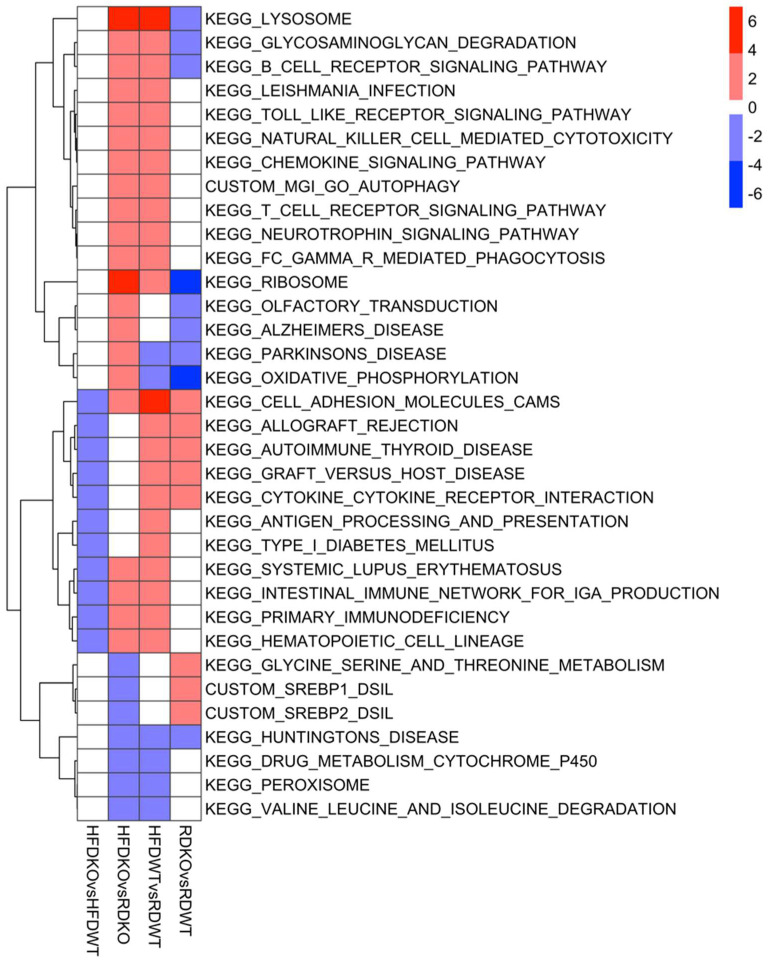
Figure 10.
Heatmap summarizing significantly up—(red) or down—(blue) regulated as determined by GSEA (FDR ≤ 0.05). Pathways showing significant regulation (FDR ≤ 0.05) in two or more diet or genotype comparisons are shown. RD = chow diet, HFD = high-fat diet, WT = Lama4fl/fl (control) mice, KO = Lama4AKO mice. For the HFDKO vs. HFDWT column, pathway directionality reported is for the HFDWT group (i.e., red = upregulated in HFDWT vs. HFDKO). For the HFDKO vs. RDKO column, directionality is reported for the RDKO group. For the HFDWT vs. RDWT and RDKO vs. RDWT columns, directionality is reported for the RDWT group.

