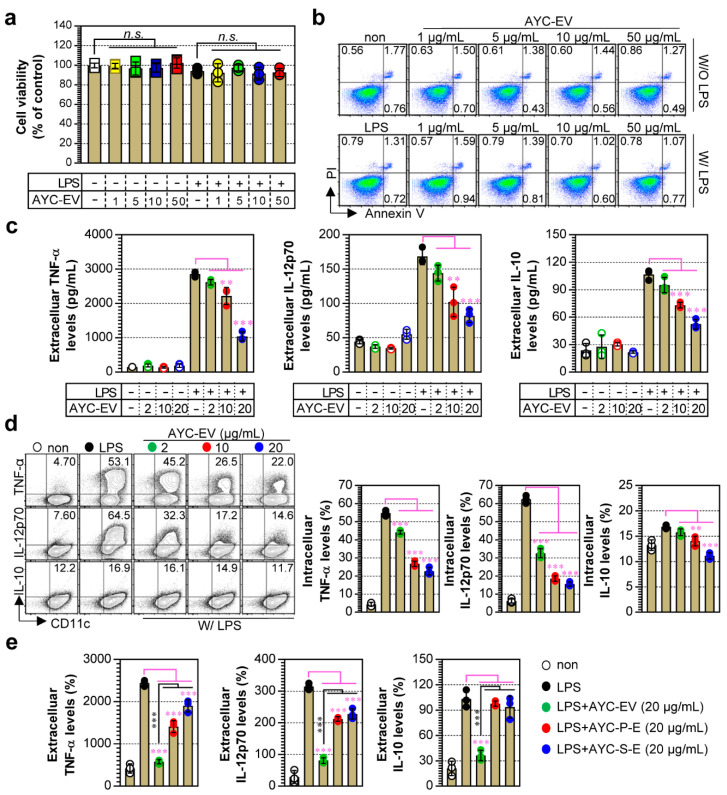
Figure 2.
Analysis of DC viability and cellular cytotoxicity and cytokine production induced by AYC-EVs treatment in immature and mature DCs. (a–c) Immature DCs (non-stimulated DCs) and mature DCs (DCs treated with 100 ng/mL LPS for 2 h) were treated with AYC-EVs (1 to 50 μg/mL). Following incubation for 24 h, cell viability, cellular cytotoxicity, and extracellular cytokine levels (TNF-α, IL-12p70, IL-10) were measured. (a) Cell viability was analyzed using the EZ-Cytox kit reagent. Bar graph displays mean ± SD (n = 3 samples). n.s.: not significant (b) Cellular cytotoxicity of AYC-EVs was confirmed using flow cytometry (FACS) with Annexin V and PI staining. Representative FACS data from one out of three independent experiments are shown. (c) Extracellular cytokine levels were measured in culture supernatants using cytokine-specific ELISA kits. Bar graphs display mean ± SD (n = 3 samples). (d) DCs exposed to LPS for 2 h were treated with AYC-EVs (2, 10, and 20 μg/mL) in the presence of 1x Protein Transport Inhibitor Cocktail. Following incubation for 12 h, cells were immunostained for CD11c, TNF-α, IL-12p70, and IL-10, as described in the Section 2, and intracellular cytokine levels were analyzed using flow cytometry. (e) Mature DCs (DCs treated with 100 ng/mL LPS for 2 h) were treated with AYC-EVs, AYC-P-E, and AYC-S-E, each at a concentration of 20 μg/mL. TNF-α, IL-12p70, and IL-10 levels were measured in culture supernatants using cytokine-specific ELISA kits. Bar graphs display mean ± SD (n = 3 samples). Bar graphs display mean ± SD (n = 3 samples). All experiments were repeated three times with similar results. ** p < 0.01, *** p < 0.001. Non: untreated DCs, W/O LPS: DCs without LPS treatment, W/ LPS: DCs with LPS treatment, MFI: mean fluorescence intensity.

