Abstract
Juniperus sabina L. (J. sabina) has been an important plant in traditional medicine since ancient times. Its needles are rich in podophyllotoxin, a precursor compound to anti-tumor drugs. However, no systematic research has been done on J. sabina as a source of podophyllotoxins or their biological action. Hence, extracts of podophyllotoxin and deoxypodophyllotoxin were the main optimization targets using the Box–Behnken design (BBD) and response surface methodology (RSM). The total phenol content and antioxidant activity of J. sabina needle extract were also optimized. Under the optimal process conditions (ratio of material to liquid (RLM) 1:40, 90% methanol, and ultrasonic time 7 min), the podophyllotoxin extraction rate was 7.51 mg/g DW, the highest level reported for Juniperus spp. distributed in China. To evaluate its biological potential, the neuroprotective acetyl- and butyrylcholinease (AChE and BChE) inhibitory abilities were tested. The needle extract exhibited significant anti-butyrylcholinesterase activity (520.15 mg GALE/g extract), which correlated well with the high levels of podophyllotoxin and deoxypodophyllotoxin. This study shows the potential medicinal value of J. sabina needles.
Keywords: homogenization-assisted ultrasonic extraction, Juniperus sabina L., podophyllotoxins, anticholinesterase activity
1. Introduction
Podophyllotoxin is a natural lignan-like compound with significant antitumor properties. The anticancer drugs etoposide and teniposide were synthesized with it as precursor compounds and have emerged as first-line chemotherapeutic agents for the treatment of many cancers: lung, breast, ovarian, testicular, gastric, bladder, pancreatic, brain, and blood [1,2,3]. According to recent studies, etoposide was found to be targeted in the treatment of cytokine storms in patients with COVID-19 [4]. Owing to its significant clinical role, the extraction and biological study of podophyllotoxin and its analogues are important topics in current study.
The Juniperus genus is an alternative plant source of podophyllotoxin and its analogues [5]. In 1953, podophyllotoxin and deoxypodophyllotoxin were identified in the Juniperus genus [6]; today, they are found in many species: Juniperus chinensis [7,8], Juniperus conferta [7], Juniperus davurica [9], Juniperus depressa [7]; Juniperus horizontalis [8]; Juniperus lucayana [6]; Juniperus scopulorum [7,10], Juniperus virginiana L. [11,12,13], Juniperus x media [14], Juniperus bermudiana L. [5], Juniperus horizontalis [15], Juniperus communis L. [16], Juniperus sabina L. [17,18], and Juniperus phoenicea [19].
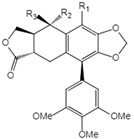
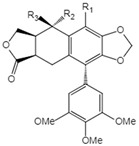
The needles of J. sabina, used in traditional Chinese medicine, are rich in podophyllotoxins of which 22 have been isolated (Table 1) [20]. In addition, the needles have significant beneficial physiological properties: antiviral, antirheumatic, antitussive, antitumor, antioxidant, hypolipidemic, neurotoxic, and immunosuppressive [21,22,23,24,25]. At present, there is an intent to develop industrial crops to provide drug precursors, and J. sabina, as a shrub representative of the Juniperus genus, should be considered for its suitability for cultivation and industrial application [26]. The rich bioactive ingredients and the advantages of resource application clearly show the potential for its needles in industries that produce pharmaceuticals and chemical functional products. Therefore, extracting high-efficiency biologically active compounds was a key step.
Table 1.
Podophyllotoxin (1) and its analogues (2–22) isolated from J. sabina.
| NO. | Compound Name | Structure | |
|---|---|---|---|
| 1 | Podophyllotoxin |
|
1 R1=R3=H, R2=OH 2 R1=R2=H, R3=OH 3 R1=R2=H, R3=OAc 4 R1=R2=R3=H 5 R1=OMe, R2=OH, R3=H 6 R1=OMe, R2=R3=H |
| 2 | Epipodophyllotoxin | ||
| 3 | Epipodophyllotoxin acetate | ||
| 4 | Deoxypodophyllotoxin | ||
| 5 | 2′-Methoxy-podophyllotoxin | ||
| 6 | β-Methylpeltatin A | ||
| 7 | Deoxy-picropodophyllotoxin |
|
7 R1=R2=R3=H 8 R1=R3=H, R2=OH 9 R1=R3=H, R2=OAc 10 R1=R2=H, R3=OH 11 R1=R2=H, R3=OAc 12 R1=OMe, R2=OH, R3=H 13 R1=OMe, R2=H, R3=OH |
| 8 | Picropodophyllotoxin | ||
| 9 | Picropodophyllotoxin acetate | ||
| 10 | Epipicropodophyllotoxin | ||
| 11 | Epipicropodophyllotoxin acetate | ||
| 12 | 2′-Methoxy-picropodophyllotoxin | ||
| 13 | 2′-Methoxy-epipicropodophyllotoxin | ||
| 14 | Dehydropodophyllotoxin |
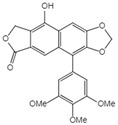
|
|
| 15 | Acetyl epipodophyllotoxin |
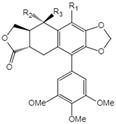
|
15 R1=R2=H, R3=OAc 16 R1=O, R2=R3=H 17 R1=H, R3=O |
| 16 | β-peltatin-A methylether | ||
| 17 | Podophyllotoxone | ||
| 18 | Acetyl epipicropodophyllotoxin |
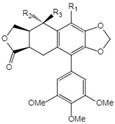
|
18 R1=R2=H, R3=OAc 19 R1=OMe, R2= H, R3=OH 20 R1=H, R2=R3=O |
| 19 | β-peltatin-B methylether | ||
| 20 | Picropodophyllotoxone | ||
| 21 | Junaphthoic acid |
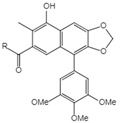
|
21 R=OH 22 R=OAc |
| 22 | 4-Acetyl junaphtholic acid | ||
Consequently, this study used response surface methodology (RSM) to optimize the conditions for homogenization-assisted ultrasonic extraction of podophyllotoxin, deoxypodophyllotoxin and phenols for their antioxidant properties, which were further evaluated by an in vitro anticholinesterase assay. This study provides the possibility of using J. sabina as a potential source of podophyllotoxin and lays a foundation for the development of high value-added compounds from its needles.
2. Results and Discussion
2.1. Optimization of the Extraction Conditions
To obtain the best active extracts, the most influential variables were jointly optimized using the Box–Behnken design (BBD) and RSM. In the BBD, 17 experimental runs with five replicates (central point) were conducted. Based on the results (Table 2) for each dependent variable (Yn) after analyzing each of the 17 experimental runs, regression models were developed to determine the approximate and predicted functional relationships of the responses. Table 3 summarizes the significant regression coefficients (at 90% confidence interval) from the analysis of variance (ANOVA), coefficient of determination (R2), and the model. The prediction equations that demonstrated Yn using significant terms are
| (1) |
| (2) |
| (3) |
| (4) |
| (5) |
| (6) |
| (7) |
Table 2.
Box–Behnken experimental design (expressed as independent variables) and experimental results obtained for dependent variables.
| EC | RLM | Methanol (%) | TU (min) | TPC | PPT | DPT | E. Yield | ABTS | FRAP | DPPH |
|---|---|---|---|---|---|---|---|---|---|---|
| Independent Variables | Dependent Variables | |||||||||
| x 1 | x 2 | x 3 | y 1 | y 2 | y 3 | y 4 | y 5 | y 6 | y 7 | |
| 1 | 1:40 (1) | 60 (−1) | 10 (0) | 483.27 ± 40.96 | 7.61 ± 0.32 | 2.20 ± 0.07 | 253.85 ± 9.25 | 12,462.3 ± 602.4 | 7880.3 ± 158.6 | 194.0 ± 69.0 |
| 2 | 1:40 (1) | 100 (1) | 10 (0) | 611.27 ± 91.04 | 7.61 ± 0.33 | 2.46 ± 0.11 | 322.30 ± 3.60 | 14,606.7 ± 107.4 | 10,584.9 ± 284.5 | 2129.5 ± 88.4 |
| 3 | 1:30 (0) | 80 (0) | 10 (0) | 546.53 ± 44.48 | 7.82 ± 0.09 | 2.33 ± 0.09 | 316.60 ± 3.90 | 15,454.3 ± 612.0 | 10,139.1 ± 85.5 | 645.7 ± 145.3 |
| 4 | 1:30 (0) | 80 (0) | 10 (0) | 537.60 ± 44.30 | 7.91 ± 0.14 | 2.20 ± 0.06 | 314.60 ± 7.00 | 15,922.9 ± 285.2 | 10,855.9 ± 383.9 | 444.8 ± 6.0 |
| 5 | 1:20 (−1) | 100 (1) | 10 (0) | 546.76 ± 88.62 | 7.57 ± 0.28 | 2.03 ± 0.07 | 318.50 ± 2.60 | 12,281.6 ± 721.9 | 9880.6 ± 262.1 | 2086.3 ± 271.3 |
| 6 | 1:40 (1) | 80 (0) | 5 (−1) | 582.62 ± 36.37 | 8.89 ± 0.46 | 2.49 ± 0.13 | 307.50 ± 3.90 | 14,940.4 ± 926.5 | 11,009.4 ± 713.0 | 324.4 ± 158.9 |
| 7 | 1:30 (0) | 100 (1) | 5 (−1) | 587.09 ± 68.29 | 7.49 ± 0.57 | 2.01 ± 0.16 | 329.15 ± 2.75 | 13,477.8 ± 1040.0 | 11,155.0 ± 316.3 | 2360.2 ± 62.4 |
| 8 | 1:30 (0) | 80 (0) | 10 (0) | 515.27 ± 46.66 | 7.41 ± 0.65 | 2.02 ± 0.21 | 314.55 ± 0.85 | 13,291.0 ± 910.0 | 9623.9 ± 664.1 | 311.0 ± 105.8 |
| 9 | 1:20 (−1) | 80 (0) | 15 (1) | 515.27 ± 35.77 | 8.03 ± 0.22 | 2.23 ± 0.05 | 305.05 ± 1.05 | 10,652.7 ± 305.0 | 9873.9 ± 384.6 | 280.8 ± 111.4 |
| 10 | 1:30 (0) | 60 (−1) | 5 (−1) | 412.95 ± 29.03 | 7.51 ± 0.10 | 2.12 ± 0.09 | 266.60 ± 1.10 | 9903.6 ± 376.8 | 7823.2 ± 112.6 | 138.0 ± 56.1 |
| 11 | 1:20 (−1) | 80 (0) | 5 (−1) | 538.72 ± 45.32 | 7.70 ± 0.31 | 2.37 ± 0.09 | 307.65 ± 6.45 | 14,467.8 ± 488.1 | 11,343.7 ± 754.0 | 192.1 ± 121.2 |
| 12 | 1:20 (−1) | 60 (−1) | 10 (0) | 422.25 ± 25.22 | 7.28 ± 0.19 | 2.01 ± 0.06 | 251.30 ± 0.80 | 11,013.7 ± 365.2 | 7368.7 ± 86.5 | 122.7 ± 18.1 |
| 13 | 1:30 (0) | 100 (1) | 15 (1) | 596.02 ± 99.99 | 7.64 ± 0.57 | 2.28 ± 0.26 | 324.55 ± 3.25 | 9949.0 ± 134.1 | 11,657.2 ± 221.5 | 1689.3 ± 41.1 |
| 14 | 1:30 (0) | 80 (0) | 10 (0) | 543.18 ± 50.87 | 8.08 ± 0.26 | 2.40 ± 0.15 | 308.80 ± 2.20 | 13,122.1 ± 234.7 | 11,144.7 ± 86.5 | 301.9 ± 143.8 |
| 15 | 1:30 (0) | 60 (−1) | 15 (1) | 388.39 ± 24.49 | 6.48 ± 0.12 | 1.75 ± 0.11 | 222.10 ± 1.30 | 9523.8 ± 183.6 | 6930.0 ± 135.6 | 8.7 ± 1.2 |
| 16 | 1:30 (0) | 80 (0) | 10 (0) | 536.11 ± 55.07 | 7.57 ± 0.51 | 2.24 ± 0.22 | 319.50 ± 2.90 | 12,741.9 ± 353.5 | 11,096.4 ± 513.9 | 293.5 ± 212.9 |
| 17 | 1:40 (1) | 80 (0) | 15 (1) | 543.18 ± 43.06 | 8.16 ± 0.03 | 2.38 ± 0.00 | 314.30 ± 3.90 | 14,436.9 ± 557.3 | 11,702.4 ± 347.5 | 339.1 ± 8.7 |
EC: Experimental conditions; E. Yield (mg/g DW); TPC (mg GAE/g DW); PPT (mg/g DW); DPT (mg/g DW); ABTS (μmol trolox/100 g DW); FRAP (μmol trolox/100 g DW); DPPH (μmol trolox/100 g DW); DW: dry weight of material.
Table 3.
Regression coefficients and statistical parameters measuring the correlation and significance of the models.
| TPC | PPT | DPT | E. Yield | ABTS | FRAP | DPPH | |
|---|---|---|---|---|---|---|---|
| y 2 | y 3 | y 4 | y 1 | y 5 | y 6 | y 7 | |
| β0 | 535.74 | 7.76 | 2.24 | 313.32 | 14,106.40 | 10,572.00 | 399.38 |
| β1 | 22.42 b | 0.21 c | 0.11 b | 1.93 | 1003.81 b | 338.76 | 38.14 |
| β2 | 81.53 a | 0.18 | 0.09 c | 37.58 a | 926.46 c | 1659.44 a | 975.24 a |
| β3 | −9.81 | −0.16 | −0.04 | −5.61 c | −1028.40 b | −145.98 | −87.10 |
| β12 | −3.63 | −0.07 | 0.06 | 0.31 | 219.13 | 48.18 | −7.03 |
| β13 | −4.00 | −0.27 c | 0.01 | 2.35 | 827.90 | 540.70 | −18.50 |
| β23 | 8.37 | 0.30 c | 0.16 b | 9.98 b | −787.25 | 348.85 | −135.40 |
| β11 | 16.74 | 0.34 b | 0.13 c | −2.83 | 697.77 | −26.19 | −15.60 |
| β22 | −32.09 b | −0.58 a | −0.20 b | −25.86 a | −2213.13 a | −1617.19 a | 749.35 a |
| β33 | −7.53 | 0.10 | − | − | −1179.76 c | 436.54 | −99.68 |
| R2 | 0.9612 | 0.8642 | 0.8319 | 0.9627 | 0.8687 | 0.9283 | 0.9812 |
a Significant coefficients at 99% confidence interval (CI). b Significant coefficients at 95% CI. c Significant coefficients at 90% CI.
Analysis of the R2 values (0.9283–0.9812) showed high model accuracy for the extraction yield (E. yield), total phenol content (TPC), ferric reducing antioxidant power (FRAP), and DPPH, thus indicating a strong correlation between predicted and experimental values (Table 3). While the podophyllotoxin and deoxypodophyllotoxin content, and the ABTS models showed a low R2 value, they were all greater than 0.83 and indicated that the data deviation could be explained by each empirical model. Domínguez et al. [27] also applied the RSM to identify the optimum extraction conditions for the highly bioactive compounds of Sambucus nigra L.
2.1.1. Total Phenol Content (TPC)
Phenolic compounds are secondary metabolites synthesized by plants under oxidative stress and one of the important adaptive mechanisms under various conditions of adversity [28,29]. TPC was quantified by the Folin–Ciocalteu reagent in the current study. As shown in Table 2, TPC under different experimental conditions (ECs) ranged from 388.39 to 611.27 mg GAE/g DW. The three best extractions were EC 2 (611.27 mg GAE/g DW), EC 7 (587.09 mg GAE/g DW) and EC 13 (596.02 mg GAE/g DW). Using our extraction parameters, very high concentrations of TPC were detected, higher than those obtained in other studies. Orhan et al. (2011) showed poor TPC values (68.43 and 122.67 mg GAE/g) for the aqueous and ethanolic extracts of J. sabina needles [30]. While analyzing 11 regions of Juniperus drupacea, the TPC of needles ranged from 2.69 to 53.82 mg GAE/g [31]. The TPC in J. drupacea berries was even higher (225.23 mg GAE/g) because phenolic acids accounted for more than 60% of total phenols [32].
According to the multinomial Equation (1), the primary terms of the robust linear model (RLM) (X1) and methanol % (X2) had a positive effect on TPC retention. In particular, the variable methanol % exhibited a highly significant (p < 0.0001) influence on TPC yield. This fact suggests that most of the bioactive compounds in J. sabina needle extracts had low polarity. The response surface model of TPC in a function of the RLM (X1) and methanol % (X2) implied that both factors affected their recovery (Figure 1). It also indicated that intermediate values of RLM and high values of methanol % resulted in maximum recoveries (>546 mg GAE/g).
Figure 1.
Response surface of total phenolic content: (a) as a function of ratio of material to liquid and percentage of methanol; (b) as a function of ratio of material to liquid and ultrasonic time; (c) as a function of percentage of methanol and ultrasonic time.
2.1.2. Podophyllotoxin and Deoxypodophyllotoxin
The total amount of podophyllotoxin and deoxypodophyllotoxin was quantified by high-performance liquid chromatography (HPLC). Podophyllotoxin recovered from J. sabina needle extract ranged from 6.48 to 8.89 mg/g DW. The three most abundant runs were EC 6 (8.89 mg/g DW), EC 14 (8.08 mg/g DW) and EC 9 (8.03 mg/g DW) (Table 2). The three best extracts were all obtained by 80% methanol extraction. In addition, the ultrasonic time (X3) and RLM (X1) were mutually complementary (Figure 2, Equation (2)), and an appropriate increase in the ultrasonic time (X3) reduced the use of extraction solvent and thus the production cost. The podophyllotoxin content from the J. sabina needles was more than four times that reported by Renouard et al. [5]. Och et al. [7] analyzed 11 species (61 varieties) of Juniperus spp., including J. sabina, and found that podophyllotoxins ranged from 0.02 to 4.87 mg/g DW. Therefore, the extraction method in this study yielded the highest levels of podophyllotoxin reported so far from J. sabina.
Figure 2.
Response surface of podophyllotoxin content: (a) as a function of ratio of material to liquid and percentage of methanol; (b) as a function of ratio of material to liquid and ultrasonic time; (c) as a function of percentage of methanol and ultrasonic time.
Deoxypodophyllotoxin can be considered an alternative to podophyllotoxin, so optimization of extractions is equally important. The amount obtained from J. sabina needles under different experimental extraction conditions ranged from 1.75 to 2.49 mg/g DW. Three optimal extracts were obtained at 80–100% methanol, 5–10 min ultrasonic time, and a RLM of 1:30–1:40 (Supplementary Material Figure S1), i.e., EC 14 (2.40 mg/g DW), EC 2 (2.46 mg/g DW) and EC 6 (2.49 mg/g DW) (Table 2). From Equation (3), both the primary and secondary terms of RLM (X1) correlated positively with deoxypodophyllotoxin yield. In addition, methanol % (X2) and ultrasonic time (X3) might have had a synergistic effect on the yield. The above results showed that the main influencing yield factor was RLM (X1), with methanol % (X2) and ultrasonic time (X3) playing a secondary role.
2.1.3. Extraction Yield (E. Yield)
The E. yield obtained under different experimental conditions (EC) ranged from 222.10 to 329.15 mg/g DW, in which the three ECs with the highest yield were EC 2 (322.30 mg/g DW), EC 13 (324.55 mg/g DW) and EC 7 (329.15 mg/g DW), as shown in Table 2. These three best ECs were consistent with those for TPC, indicating that the TPC value contributed the most to the extract. However, there was no significant correlation between the value of the E. yield and that of the podophyllotoxins. Overall, response surfaces can provide an efficient way to achieve the desired optimization goals for extracts with different properties [27].
The response surface model of E. yield as a function of methanol % (X2) and ultrasonic time (X3) showed that methanol % (X2) significantly affected their recovery (Supplementary Material Figure S2). The E. yield increased by 48% when methanol % (X2) was high compared to low. In addition, Equation (4) confirmed these considerations, where the linear term of methanol % (X2) and the product term of methanol % and RLM (X2×3) both had a positive effect on the recovery of E. yield (Table 2).
2.1.4. Antioxidant Activity In Vitro
Extracts of J. sabina needles showed significant in vitro antioxidant activity [30]. The influence of extraction conditions on antioxidant capacity was determined using three antioxidant assays: ABTS, FRAP and DPPH. As shown in Table 2, the highest antioxidant activity was detected at EC 4, EC 17 and EC 7 for ABTS (15,922.9 µmol Trolox/100 g DW), FRAP (11,702.4 µmol Trolox/100 g DW) and DPPH (2360.2 µmol Trolox/100 g DW). The above results showed that the extracts with high antioxidant activity were more likely to be obtained when methanol % (X2) was around 80%. In addition, the antioxidant activity of J. sabina needle extract was found to be significantly better than that of common sources of antioxidants, such as Rubus rosaefolius or Sambucus nigra L. [27,33].
Considering the regression coefficients (Table 3), the quadratic terms of methanol % (X2) all significantly affected antioxidant activity (p < 0.01), having a negative effect on ABTS and FRAP capacity (Supplementary Material Figures S3 and S4). The variation pattern of Supplementary Material Figure S5a,c showed that the FRAP values of the extracts all started to decrease as the methanol % increased to about 80%. Piwowarska and González-Alvarez [34] analyzed the antioxidant capacity of forestry biomass extracts on the dependence of solvent concentration and obtained similar results. In addition, both the liner and quadratic terms showed a positive effect on DPPH capacity (Equation (7)), and the DPPH values of the extracts increased with methanol % (Supplementary Material Figure S5a,c). Thoo et al. [35] reported that the DPPH in Morinda citrifolia extracts increased with ethanol concentration.
In summary, the TPC and antioxidant capacity of J. sabina needles were significantly affected by the methanol % as shown in the response surface plots of all dependent variables. There were complex influences between the active compounds and their bioactive properties as well as the potential pharmacodynamic effects among different molecules in the extracts [36,37]. Simultaneous optimization, therefore, could maximize the content of podophyllotoxins, phenols and their antioxidant activity.
2.1.5. Process Optimization and Model Validation
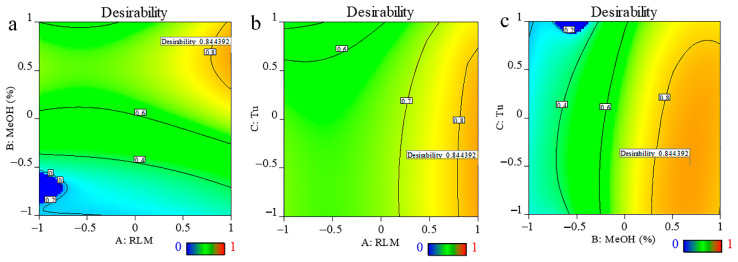
The aim of the optimization was to determine the extraction conditions that would provide the greatest amount of podophyllotoxin and deoxypodophyllotoxin. At the same time, other targets (TPC, E. yield, and antioxidant activity) were set to be greater than the range above the median. Figure 3 showed the contour plot as a function of RLM, methanol % and ultrasonic time. The parameters selected as optimal showed desirability values > 0.70, which was within an acceptable range. The optimal extraction conditions were RLM 1:40, 93.7% methanol and ultrasonic time 7.575 min (supplementary Material Table S2). To test the reliability of the predicted results and to take into account the convenience of practical operation, the optimal extraction conditions were modified to RLM 1:40, 90% methanol, and ultrasonic time to 7 min. The relative standard deviations (RSDs) of all variables (Table 4) showed that the predicted values for all groups were very similar to the experimental results, except for DPPH, which had an RSD value (22.52 > 10). The suitability of the response surface methodology model for quantitative predictions was verified by satisfactory agreement between the predicted and measured values. These findings also justified the selection of the Box–Behnken design, which had been demonstrated to be accurate and reliable for predicting the content of podophyllotoxins, TPC, E. yield, and antioxidant capacities of the extracts.
Figure 3.
Desirability surface plot: (a) as a function of ratio of material to liquid (RLM) and percentage of methanol; (b) as a function of RLM and ultrasonic time; (c) as a function of percentage of methanol and ultra-sonic time.
Table 4.
Predicted and experimental values under optimum conditions resulting from the simultaneous optimization of the eight responses.
| PPT | DPT | TPC | E. Yield | ABTS | FRAP | DPPH | |
|---|---|---|---|---|---|---|---|
| Predicted value | 8.24 | 2.45 | 464.90 | 324.52 | 15,638.40 | 11,092.20 | 1506.86 |
| Experimental value | 7.51 | 2.35 | 540.1 | 309.31 | 17,242.14 | 10,963.49 | 2211.19 |
| Std Dev | 0.52 | 0.07 | 53.11 | 10.76 | 1134.01 | 91.01 | 2211.19 |
| RSD (%) | 6.88 | 3.15 | 9.84 | 3.48 | 6.58 | 0.83 | 22.52 |
2.2. Anticholinesterase Activity
Inhibition of acetylcholinesterase (AChE) and butyrylcholinesterase (BChE) is one of the important strategies for combatting Alzheimer’s disease (AD) [38]. Natural products are an abundant source of novel bioactive compounds [39], and in this study, extracts of J. sabina needles obtained under different conditions were analyzed for AChE and BChE as potential natural enzyme inhibitors, with values expressed as galanthamine equivalents. As shown in Table 5, the inhibitory activity values of the extracts against AChE and BChE were 0.96–28.79 mg GALE/g and 37.67–520.15 mg GALE/g, respectively. The results showed that the needle extracts had good anti-BChE activity. Orhan et al. [30] analyzed the anticholinesterase activity of Juniperus leaf extracts and similarly found that the BChE inhibitory activity was better than that of AChE. Ballard et al. [40] demonstrated a significant inhibitory effect of J. sabina needle extracts on BChE, presumably related to the presence of this enzyme as a major cholinesterase in the brains of patients with advanced AD.
Table 5.
Anticholinesterase activity of J. sabina needle extracts under different extraction conditions.
| EC | AChE (mg GALE/g Extract) |
BChE (mg GALE/g Extract) |
|---|---|---|
| JS-1 | 9.64 ± 2.69 | 63.95 ± 10.37 |
| JS-2 | 28.79 ± 4.14 | 282.99 ± 47.85 |
| JS-3 | 2.61 ± 1.28 | 91.18 ± 14.77 |
| JS-4 | 2.29 ± 1.17 | 86.36 ± 13.99 |
| JS-5 | 2.06 ± 1.09 | 351.8 ± 60.4 |
| JS-6 | 8.43 ± 2.53 | 284.77 ± 48.17 |
| JS-7 | 9.26 ± 2.64 | 361.18 ± 160.67 |
| JS-8 | 3.86 ± 1.64 | 434.77 ± 80.93 |
| JS-9 | 1.99 ± 1.06 | 254.69 ± 100.49 |
| JS-10 | 0.96 ± 0.63 | 173.4 ± 28.55 |
| JS-11 | 8.28 ± 2.5 | 384.58 ± 66.48 |
| JS-12 | 2.74 ± 1.32 | 125.96 ± 20.51 |
| JS-13 | 17.01 ± 3.4 | 242.55 ± 40.62 |
| JS-14 | 18.48 ± 3.5 | 520.15 ± 92.2 |
| JS-15 | 5.02 ± 1.91 | 37.67 ± 6.21 |
| JS-16 | 13.5 ± 3.11 | 109.39 ± 17.76 |
| JS-17 | 7.07 ± 2.31 | 185.64 ± 30.65 |
| JS-Y | 16.78 ± 4.61 | 208.79 ± 41.66 |
EC: Experimental condition; JS-1~17: Extracts of J. sabina needles under different experimental conditions; JS-Y: Extracts of J. sabina needles under ideal extraction condition. Test extract concentration: 500 µg/mL DW extract.
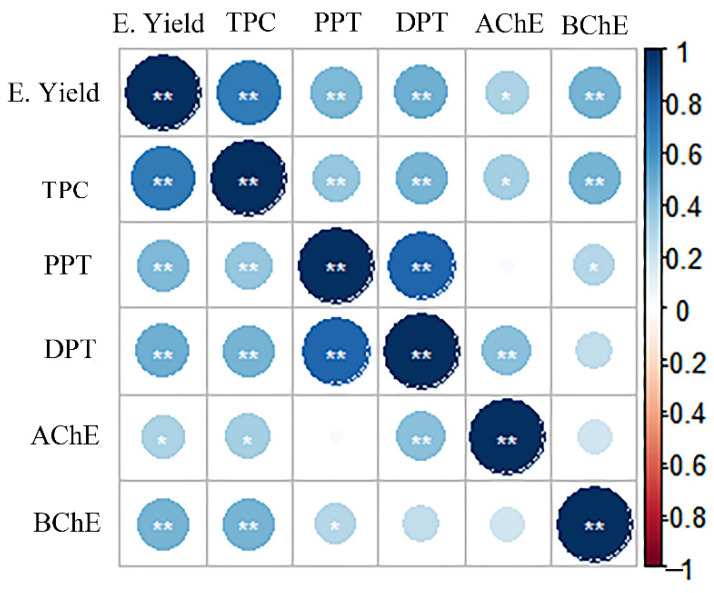
A correlation analysis between extract content and anticholinesterase activity was performed to further understand the pharmacodynamic properties of the extracts tested. The results showed (Figure 4) that the anti-AChE activity of the needle extracts showed a significant correlation (p < 0.05) with E. yield and TPC, while it showed a highly significant correlation (p < 0.01) with deoxypodophyllotoxin. The values of E. yield and TPC both showed a highly significant correlation (p < 0.01) with that of anti-BChE activity, and podophyllotoxin content also suggested a significant correlation (p < 0.05). From a statistical point of view, podophyllotoxins and the phenolics in the J. sabina needle extracts may contribute to cholinesterase inhibition. Therefore, their enzyme inhibitory properties may have a phytochemical interaction; that is, phenols and podophyllotoxins may have a synergistic effect in inhibiting cholinesterase activity, but the specific mechanism needs further analysis.
Figure 4.
Relationship between bioactive compounds and biological activities in the needles of J. sabina. “*”: p < 0.05; “**”: 0.01 < p < 0.05; E. yield: the extraction yield; TPC: total phenol content; PPT: podophyllotoxin; DPT: deoxypodophyllotoxin; AChE/BChE: the anti-cholinesterase activity values of J. sabina extracts.
3. Material and Methods
3.1. Chemicals
For extractions and solutions, ultrapure water was obtained by a Milli-Q system Millipore (Bedford, MA, USA) and absolute ethanol was purchased from Sigma-Aldrich (St. Louis, MO, USA). The 7% sodium carbonate (Na2CO3) solution was obtained by dissolving 7 g of powder in ultrapure water and making up to 100 mL.
The following reagents were supplied by specified suppliers: Gallic acid, Folin reagent, ferric chloride (FeCl3), dimethyl sulfoxide (DMSO) and Na2CO3 were purchased from Aladdin (Aladdin Biochemical Technology Co., Ltd., Shanghai, China). Acetylcholinesterase (Electric eel), butyrylcholinesterase (Horse serum), acetylthiocholine iodide, S-butyrylthiocholine iodide, 5,5’-dithio bis-(2-nitrobenzoic acid), and Tris (tri (hydroxymethyl) aminomethane) were purchased from Macklin (Macklin Biochemical Co., Ltd., Shanghai, China). DPPH (1,1-diphenyl-2 picrylhydrazyl radical), ABTS (2,2-azinobis (3-ethylbenzothiazoline-6-sulphonic acid) radical cation), TPTZ (2,4,6-tri(2-pyridyl)-s-triazine), Trolox (6-hydroxy-2,5,7,8-tetramethylchroman-2-carboxylic acid), acetic acid, podophyllotoxin, and deoxypodophyllotoxin were purchased from Sigma-Aldrich (St. Louis, MO, USA).
3.2. Plant Material
The J. sabina needles used in this experiment were collected in October 2020 from Expo Park of Northwest Agriculture and Forestry University (Yangling District, Shaanxi Province, China, 34°18′3″ N 108°2′56″ E). Healthy growing needles were selected, freeze-dried, crushed, passed through a 40-mesh sieve, sealed and packed for storage in a dry place for later use.
3.3. HPLC Analysis
Podophyllotoxin and deoxypodophyllotoxin content were determined according to Renouard et al. [5] with minor modifications. Liquid phase analysis was performed by HPLC (Agilent 1260, Agilent Technologies Inc., Santa Clara, CA, USA) with a C18 (5 μm, 4.6 × 250 mm; Agilent Technologies Inc., Santa Clara, CA, USA) column. The mobile phases were methanol (B) and 0.2% formic acid-water solution (D) with the following gradients: 0–10 min, 10–30% B; 10–20 min, 30–55% B; 20–35 min, 55–80% B; 35–40 min, 80–84% B; 40–45 min, 84–100% B; 45–50 min, 100% B; 50–52 min, 100–10% B; 52–56 min, 10% B. The flow rate was 0.8 mL/min; the column temperature was 35 ℃; and the injection volume was 20 μL. Podophyllotoxin and deoxypodophyllotoxin standards were purchased from Yuanye (Yuanye Bio-Technology Co., Ltd., Shanghai, China). The standard solutions were prepared in methanol with an initial concentration of 1 mg/mL and the standard curve was drawn after gradient dilution (podophyllotoxin: y = 9736x + 9.1552, R2 = 0.9946; deoxypodophyllotoxin: y = 22,774x + 5.4356, R2 = 0.9995). The peak area (y) was used to calculate the content of the target compounds.
3.4. Extraction of J. sabina
The extract of J. sabina needles was obtained by homogenization-assisted ultrasonic extraction. Needle powder (2 g) was weighted into a 100 mL Erlenmeyer flask and 40–80 mL of extraction solvent was added (for relevant extraction conditions, see Supplementary Material Table S1). This mixture was then sonicated at 100 kHz for 5–15 min in an ultrasonic bath (Branson, Mod. 8510E-DTH, Danbury, CT, USA). The mixture was extracted for 1.5 h at 55 °C under stirring in a water bath (HSJ-4, Jiangsu Science Analysis Instrument Co., Ltd., Changzhou, China). The extract mixture was centrifuged at 10,000× g for 10 min and the supernatant was drawn off, concentrated under reduced pressure and then evaporated to a constant weight.
| E. Yield(mg/g DW) = mass of extraction (mg)/dry weight of material (g) |
E. Yield is the extraction yield of J. sabina; DW refers to the dry weight of material; mass of extraction refers to the mass of the extract dried to constant weight.
3.5. Experimental Design
The effects of the feed-to-liquid ratio (X1; g/mL), methanol concentration (MeOH; X2; %), ultrasonic time (TU; X3; min) on the extraction yield (E. yield), antioxidant activities, and total phenol, podophyllotoxin and deoxypodophyllotoxin content were investigated (Supplementary Material Table S1). Response surface experiments were designed and optimized using the (BBD) approach with three replicates at the center point. The experimental data were fitted to the following second-order polynomial model equation.
| (8) |
Yj is the dependent (response) variable; Xi, Xij and Xii were the independent variables; and β0, βi, βij and βii were the regression coefficients. The adequacy of the model was determined by assessing the misfit, coefficient of determination (R2) and the F-test values from the ANOVA.
3.6. Determine Optimal Conditions and Validate the Model
Multi-response surface optimization was used to maximize the selected response variables simultaneously. Selection criteria were based on maximizing podophyllotoxin and deoxypodophyllotoxin content, taking into account the optimization of TPC, E. yield and antioxidant activity obtained by DPPH, FRAP and ABTS. Optimal extraction conditions were estimated using the response expectancy analysis function of Design-Expert software. Model validation was performed by conducting experiments under optimal extraction conditions, and the values predicted by each model were compared with the experimental data. The similarity between the experimental and predicted data was calculated using relative standard deviation (RSD):
| (9) |
At RSD % < 10, the resulting data were considered similar, and the results were analyzed and optimized for all response conditions.
3.7. Determination of Total Phenol Content (TPC)
In this experiment, the TPC of J. sabina needle extract was determined by the Folin-Ciocalteu colorimetric method [41,42]. After pipetting 200 μL of extract (2 mg/mL) into a test tube, 2 mL of Folin–Ciocalteu reagent was added. The mixture was shaken well and left to react for 6 min before adding 2 mL of 7% Na2CO3 solution (mass to volume ratio) and reading the absorbance at 760 nm on an ultraviolet spectrophotometer (UV-1800, Shimadzu Manufacturing Co., Kyoto, Japan). Three parallel sets were made for all the experiments.
3.8. Evaluation of In Vitro Biological Activity
Extracts of J. sabina needles were prepared in a methanol solution to 32 mg/mL mother liquor, stored at 4 °C to be ready to use. The related activity assay was completed within three days.
3.8.1. Antioxidant Activity In Vitro
The antioxidant activity was assessed using several different in vitro assays (ABTS, FRAP, and DPPH) according to the procedures described by Peng et al. [43]. The results were expressed as Trolox equivalents (µmol Trolox/100 g DW).
3.8.2. Cholinesterase Inhibitory Activity
The cholinesterase inhibitory activity assay was determined using the modified spectrophotometric method of Ellman et al. [44]. A 96-well plate was prepared by adding 140 µL of phosphate buffer, 20 µL of AChE or BChE and 20 µL of J. sabina needle extract (500 µg/mL), mixed well and incubated for 15 min at 25 °C. After 30 min, the absorbance values of the solutions were measured at 412 nm using an enzyme marker. DMSO was used as a negative control; galanthamine was used as a positive control; and the blank group had 20 µL of phosphate buffer added. The first concentration of galanthamine was 640 µg/mL and used for standard curve drawing after gradient dilution. Three parallel experiments were done for each group and average values were taken. The cholinesterase inhibition rate was then calculated according to the following equation.
| Inhibition rate (%) = (Blank group − Experimental group)/Blank group × 100% |
Experimental group: absorbance value of compound to be measured; blank group: phosphate buffer instead of absorbance value of compound to be measured.
3.9. Data Analysis
The assays described were performed in triplicate for all experiments, and the results were expressed as mean ± standard deviation (SD). All response surface methodology (RSM) data were statistically analyzed to determine the significant parameters and the interaction between each variable. Specifically, response surface analysis was performed using Design-Expert11 (Stat-Ease, Inc., Minneapolis, MN, USA). Data variance significance processing and analysis were performed using Statistics V8.0 (Statsoft Inc., Tulsa, OK., USA) and SPSS 13.0 (SPSS Inc., Chicago, IL., USA). In all cases, p < 0.05 indicated significance.
4. Conclusions
This study determined the optimal process conditions (RLM 1:40, 90% methanol and ultrasonication time 7 min) for obtaining J. sabina needle extract with the highest content of podophyllotoxin (7.51 mg/g DW), high TPC, and satisfactory antioxidant activity. The biological activity indices were added to the RSM models for optimization, bringing them more in line with the complexity of natural drug applications and offering more economical and effective optimization conditions. In addition, the results of the excellent anticholinesterase activity of the extracts was interesting, and the significant positive effects of podophyllotoxin and deoxypodophyllotoxin on it were also observed. The study suggests that J. sabina could be an economical source of raw material for podophyllotoxins, antioxidants and Alzheimer’s inhibition.
Supplementary Materials
The following supporting information can be downloaded at: https://www.mdpi.com/article/10.3390/ijms231810205/s1.
Author Contributions
Conceptualization, D.L.; methodology, S.X. and D.L.; software, S.X. and X.L.; validation, P.T.; formal analysis, S.X. and X.L.; data curation, S.L.; writing—Original Draft, S.X.; investigation, S.L. and P.T.; writing—Review and Editing, S.X. and D.L.; supervision, D.L. All authors have read and agreed to the published version of the manuscript.
Institutional Review Board Statement
Not applicable.
Informed Consent Statement
Not applicable.
Data Availability Statement
Not applicable.
Conflicts of Interest
The authors declare no conflict of interest.
Funding Statement
This work was supported by the program from the National Natural Science Foundation of China (No. 31570655).
Footnotes
Publisher’s Note: MDPI stays neutral with regard to jurisdictional claims in published maps and institutional affiliations.
References
- 1.Canel C., Moraes R.M., Dayan F., Ferreira D. Podophyllotoxin. Phytochemistry. 2000;54:115–120. doi: 10.1016/S0031-9422(00)00094-7. [DOI] [PubMed] [Google Scholar]
- 2.Guerram M., Jiang Z.Z., Zhang L.Y. Podophyllotoxin, a medicinal agent of plant origin: Past, present and future. Chin. J. Nat. Med. 2012;10:161–169. doi: 10.3724/SP.J.1009.2012.00161. [DOI] [Google Scholar]
- 3.Zi C.T., Yang L., Kong Q.H., Li H.M., Yang X.Z., Ding Z.T., Jiang Z.H., Hu J.M., Zhou J. Glucoside derivatives of podophyllotoxin: Synthesis, physicochemical properties, and cytotoxicity. Drug Des. Dev. Ther. 2019;13:3683–3692. doi: 10.2147/DDDT.S215895. [DOI] [PMC free article] [PubMed] [Google Scholar]
- 4.Maulin P., Eduardo D., Daniel S., Parag D., Ashwin C., Michael B., Roberto C., Gerard C.J. Etoposide as salvage therapy for cytokine storm due to coronavirus disease, 2019. Chest. 2021;159:E7–E11. doi: 10.1016/j.chest.2020.09.077. [DOI] [PMC free article] [PubMed] [Google Scholar]
- 5.Renouard S., Lopez T., Hendrawati O., Dupré P., Doussot J., Falguieres A., Ferroud C., Hagège D., Lamblin F., Lainé E., et al. Podophyllotoxin and deoxypodophyllotoxin in Juniperus bermudiana and 12 other juniperus species: Optimization of extraction, method validation, and quantification. J. Agric. Food Chem. 2011;59:8101–8107. doi: 10.1021/jf201410p. [DOI] [PubMed] [Google Scholar]
- 6.Hartwell J.L., Johnson J.M., Fitzgerald D.B., Belkin M. Podophyllotoxin from Juniperus species; savinin. J. Am. Chem. Soc. 1953;75:235–236. doi: 10.1021/ja01097a511. [DOI] [Google Scholar]
- 7.Och M., Och A., Cieśla L., Kubrak T., Pecio L., Stochmal A., Kocki J., Bogucka-Kocka A. Study of cytotoxic activity, podophyllotoxin, and deoxypodophyllotoxin content in selected Juniperus species cultivated in Poland. Pharm. Biol. 2014;53:831–837. doi: 10.3109/13880209.2014.943246. [DOI] [PubMed] [Google Scholar]
- 8.Cantrell C.L., Zheljazkov V.D., Osbrink W.L., Castro A., Maddox V., Craker L.E., Astatkie T. Podophyllotoxin and essential oil profile of Juniperus and related species. Ind. Crops Prod. 2013;43:668–676. doi: 10.1016/j.indcrop.2012.07.075. [DOI] [Google Scholar]
- 9.Biswas D., Biswas P., Nandy S., Mukherjee A., Dey A. Endophytes producing podophyllotoxin from Podophyllum sp. and other plants: A review on isolation, extraction and bottlenecks. S. Afr. J. Bot. 2020;134:303–313. doi: 10.1016/j.sajb.2020.02.038. [DOI] [Google Scholar]
- 10.Doussot J., Mathieu V., Colas C., Molinié R., Corbin C., Montguillon J., Banuls L.M.Y., Renouard S., Lamblin F., Dupré P., et al. Investigation of the lignan content in extractss from Linum, Callitris and Juniperus species in relation to their in vitro antiproliferative activities. Planta Med. 2016;83:574–581. doi: 10.1055/s-0042-118650. [DOI] [PubMed] [Google Scholar]
- 11.Cushman K.E., Maqbool M., Gerard P.D., Bedir E., Lata H., Moraes R.M. Variation of podophyllotoxin in leaves of Eastern red cedar (Juniperus virginiana) Planta Med. 2003;69:477–478. doi: 10.1055/s-2003-39707. [DOI] [PubMed] [Google Scholar]
- 12.Gawde A., Cantrell C.L., Zheljazkov V.D. Dual extraction of essential oil and podophyllotoxin from Juniperus virginiana. Ind. Crops Prod. 2009;30:276–280. doi: 10.1016/j.indcrop.2009.05.005. [DOI] [Google Scholar]
- 13.Gawde A., Zheljazkov V.D., Maddox V., Cantrell C.L. Bioprospection of Eastern red cedar from nine physiographic regions in Mississippi. Ind. Crops Prod. 2009;30:59–64. doi: 10.1016/j.indcrop.2009.01.010. [DOI] [Google Scholar]
- 14.Kusari S., Zühlke S., Spiteller M. Chemometric evaluation of the anti-cancer pro-drug podophyllotoxin and potential therapeutic analogues in Juniperus and Podophyllum species. Phytochem. Anal. 2010;22:128–143. doi: 10.1002/pca.1258. [DOI] [PubMed] [Google Scholar]
- 15.Zheljazkov V.D., Cantrell C.L., Donega M.A., Astatkie T., Heidel B. Podophyllotoxin concentration in Junipers in the Big Horn Mountains in Wyoming. HortScience. 2012;47:1696–1697. doi: 10.21273/HORTSCI.47.12.1696. [DOI] [Google Scholar]
- 16.Benzina S., Harquail J., Jean S., Beauregard A.-P., Colquhoun C.D., Carroll M., Bos A., Gray C.A., Robichaud G.A. Deoxypodophyllotoxin isolated from Juniperus communis induces apoptosis in breast cancer cells. Anti-Cancer Agents Med. Chem. 2014;15:79–88. doi: 10.2174/1871520614666140608150448. [DOI] [PubMed] [Google Scholar]
- 17.Ivanova D.I., Tashev A.N., Nedialkov P.T., Ilieva Y.E., Atanassova T.N., Olech M., Nowak R., Angelov G., Tsvetanova F.V., Iliev I.A., et al. Antioxidant and antiproliferative activity of Juniperus L. species of Bulgarian and foreign origin and their anticancer metabolite identification. Bulg. Chem. Commun. 2018;50:144–150. [Google Scholar]
- 18.Zheljazkov V., Cantrell C., Semerdjieva I., Radoukova T., Stoyanova A., Maneva V., Kačániová M., Astatkie T., Borisova D., Dincheva I., et al. Essential oil composition and bioactivity of two Juniper Species from Bulgaria and Slovakia. Molecules. 2021;26:3659. doi: 10.3390/molecules26123659. [DOI] [PMC free article] [PubMed] [Google Scholar]
- 19.Tavares W.R., Seca A.M. The current status of the pharmaceutical potential of Juniperus L. metabolites. Medicines. 2018;5:81. doi: 10.3390/medicines5030081. [DOI] [PMC free article] [PubMed] [Google Scholar]
- 20.Li G.Z., He J., Yan H.Y., Feng R.H., Feng J.T. Advances in the studies on chemical constituents and bioactivities of Sabina vulgaris Ant. J. Northwest Sci.-Tech. Univ. Agric. For. 2006;34:133–139. doi: 10.13207/j.cnki.jnwafu.2006.10.027. [DOI] [Google Scholar]
- 21.Guerram M., Jiang Z., Sun L., Zhu X., Zhang Y.L. Antineoplastic effects of deoxypodophyllotoxin, a potent cytotoxic agent of plant origin, on glioblastoma U-87 MG and SF126 cells. Pharmacol. Rep. 2015;67:245–252. doi: 10.1016/j.pharep.2014.10.003. [DOI] [PubMed] [Google Scholar]
- 22.Zang X., Wang G., Cai Q., Zheng X., Zhang J., Chen Q., Wu B., Zhu X., Hao H., Zhou F. A promising microtubule inhibitor deoxypodophyllotoxin exhibits better efficacy to multidrug-resistant breast cancer than paclitaxel via avoiding efflux transport. Drug Metab. Dispos. 2018;46:542–551. doi: 10.1124/dmd.117.079442. [DOI] [PubMed] [Google Scholar]
- 23.Da Silva V.P., Oliveira R.R., Figueiredo M.R. Isolation of limonoids from seeds of Carapa guianensis Aublet (Meliaceae) by high-speed counter current chromatography. Phytochem. Anal. 2009;20:77–81. doi: 10.1002/pca.1100. [DOI] [PubMed] [Google Scholar]
- 24.Zhang N.N., Park D.K., Park H.J. Hair growth-promoting activity of hot water extracts of Thuja orientalis. BMC Complem. Altern. Med. 2013;13:9. doi: 10.1186/1472-6882-13-9. [DOI] [PMC free article] [PubMed] [Google Scholar]
- 25.Zhang J.F., Sun G.L., Zhang B., Sun Z.G., Li Y. Study progress of oriental Arborvitae pharmacological effects. Lishizhen Med. Mater. Med. Res. 2013;24:2231–2233. doi: 10.3969/j.issn.1008-0805.2013.09.087. [DOI] [Google Scholar]
- 26.Ivanova D.I., Nedialkov P.T., Tashev A.N., Olech M., Nowak R., Ilieva Y.E., Najdenski H.M. Junipers of Various Origins as Potential Sources of the Anticancer Drug Precursor Podophyllotoxin. Molecules. 2021;26:5179. doi: 10.3390/molecules26175179. [DOI] [PMC free article] [PubMed] [Google Scholar]
- 27.Domínguez R., Zhang L., Rocchetti G., Lucini L., Pateiro M., Munekata P.E.S., Lorenzo J.M. Elderberry (Sambucus nigra L.) as potential source of antioxidants. characterization, optimization of extraction parameters and bioactive properties. Food Chem. 2020;330:127266. doi: 10.1016/j.foodchem.2020.127266. [DOI] [PubMed] [Google Scholar]
- 28.Isah T. Stress and defense responses in plant secondary metabolites production. Biol. Res. 2019;52:39. doi: 10.1186/s40659-019-0246-3. [DOI] [PMC free article] [PubMed] [Google Scholar]
- 29.Ding J.W., Sun L.L., Mai Maiti A. Research summary of common medicinal materials of ethnic medicine in Xinjiang. Chin. J. Ethnomedicine Ethnopharmacy. 2021;30:49–59. [Google Scholar]
- 30.Orhan N., Orhan I.E., Ergun F. Insights into cholinesterase inhibitory and antioxidant activities of five Juniperus species. Food Chem. Toxicol. 2011;49:2305–2312. doi: 10.1016/j.fct.2011.06.031. [DOI] [PubMed] [Google Scholar]
- 31.Liu Z., Wang D., Li D., Shuai Z. Quality evaluation of Juniperus rigida sieb. et zucc. based on phenolic profiles, bioactivity, and HPLC fingerprint combined with chemometrics. Front. Pharmacol. 2017;19:8. doi: 10.3389/fphar.2017.00198. [DOI] [PMC free article] [PubMed] [Google Scholar]
- 32.Miceli N., Trovato A., Marino A., Bellinghieri V., Melchini A., Dugo P., Cacciola F., Donato P., Mondello L., Güvenç A., et al. Phenolic composition and biological activities of Juniperus drupacea labill. berries from turkey. Food Chem. Toxicol. 2011;49:2600–2608. doi: 10.1016/j.fct.2011.07.004. [DOI] [PubMed] [Google Scholar]
- 33.Oliveira B.D., Rodrigues A.C., Cardoso B.M.I., Ramos A.L.C.C., Bertoldi M.C., Taylor J.G., da Cunha L.R., Pinto U.M. Antioxidant, antimicrobial and anti-quorum sensing activities of Rubus rosaefolius phenolic extract. Ind. Crops Prod. 2016;84:59–66. doi: 10.1016/j.indcrop.2016.01.037. [DOI] [Google Scholar]
- 34.Piwowarska N., González-Alvarez J. Extraction of antioxidants from forestry biomass: Kinetics and optimization of extraction conditions. Biomass Bioenerg. 2012;43:42–51. doi: 10.1016/j.biombioe.2012.03.031. [DOI] [Google Scholar]
- 35.Thoo Y.Y., Ho S.K., Abas F., Lai O.M., Ho C.W., Tan C.P. Optimal binary solvent extraction system for phenolic antioxidants from mengkudu (Morinda citrifolia) fruit. Molecules. 2013;18:7004–7022. doi: 10.3390/molecules18067004. [DOI] [PMC free article] [PubMed] [Google Scholar]
- 36.Rajha H.N., Darra N.E., Hobaika Z., Boussetta N., Vorobiev E., Maroun R.G., Louka N. Extraction of total phenolic compounds, flavonoids, anthocyanins and tannins from grape byproducts by response surface methodology. Influence of solid-liquid ratio particle size, time, temperature and solvent mixtures on the optimization process. Food Nutr. Sci. 2014;5:397–409. doi: 10.4236/fns.2014.54048. [DOI] [Google Scholar]
- 37.Darra N.E., Tannous J., Mouncef P.B., Palge J., Yaghi J., Vorobiev E., Louka N., Maroun R.G. A Comparative study on antiradical and antimicrobial properties of red grapes extracts obtained from different Vitis vinifera varieties. Food Nutr. Sci. 2012;3:1420–1432. doi: 10.4236/fns.2012.310186. [DOI] [Google Scholar]
- 38.Pope C.N., Brimijoin S. Cholinesterases and the fine line between poison and remedy. Biochem. Pharmacol. 2018;153:205–216. doi: 10.1016/j.bcp.2018.01.044. [DOI] [PMC free article] [PubMed] [Google Scholar]
- 39.Cieśla L., Moaddel R. Comparison of analytical techniques for the identification of bioactive compounds from natural products. Nat. Prod. Rep. 2016;33:1131–1145. doi: 10.1039/C6NP00016A. [DOI] [PMC free article] [PubMed] [Google Scholar]
- 40.Ballard C.G., Greig N.H., Guillozet-Bongaarts A.L., Enz A., Darvesh S. Cholinesterases: Roles in the brain during health and disease. Alzh. Res. 2005;2:307–318. doi: 10.2174/1567205054367838. [DOI] [PubMed] [Google Scholar]
- 41.Burcu B., Aysel U., Nurdan S. Antimicrobial, antioxidant, antimutagenic activities, and phenolic compounds of iris germanica. Ind. Crops Prod. 2014;61:526–530. doi: 10.1016/j.indcrop.2014.07.022. [DOI] [Google Scholar]
- 42.Mocan A., Crișan G., Vlase L., Crișan O., Vodnar D.C., Raita O., Gheldiu A.M., Toiu A., Oprean R., Tilea I. Comparative studies on polyphenolic composition, antioxidant and antimicrobial activities of schisandra chinensis leaves and fruits. Molecules. 2014;19:15162–15179. doi: 10.3390/molecules190915162. [DOI] [PMC free article] [PubMed] [Google Scholar]
- 43.Peng X., Feng C., Wang X., Gu H., Yang L. Chemical composition and antioxidant activity of essential oils from barks of pinus pumila using microwave-assisted hydrodistillation after screw extrusion treatment. Ind. Crops Prod. 2021;166:113489. doi: 10.1016/j.indcrop.2021.113489. [DOI] [Google Scholar]
- 44.Ellman G.L., Courtney K.D., Andres V., Featherstone R.M. A new and rapid colorimetric determination of acetylcholinesterase activity. Biochem. Pharmacol. 1961;7:88–95. doi: 10.1016/0006-2952(61)90145-9. [DOI] [PubMed] [Google Scholar]
Associated Data
This section collects any data citations, data availability statements, or supplementary materials included in this article.
Supplementary Materials
Data Availability Statement
Not applicable.


