Abstract
Objective:
To predict breast cancer molecular subtypes with neural networks based on magnetic resonance imaging apparent diffusion coefficient (ADC) radiomics and to detect the relation of lesion size with the stability of radiomics features.
Methods:
This retrospective study included 221 consecutive patients (224 lesions) with breast cancer imaged between January 2015 and January 2020. Three sample size configurations were identified based on tumor size (experiment 1: all cases, experiment 2: >1 cm3, and experiment 3: >2 cm3). The tumors were segmented by three observers based on diffusion-weighted imaging-registered ADC maps, and the volumetric agreement of these segmentations was evaluated using the Dice coefficient. Stability of radiomics features (n=851) was evaluated with intraclass correlation coefficient (ICC, >0.75) and coefficient of variation (CoV, <0.15). Feature selection was made with variance inflation factor (VIF, <10) and least absolute shrinkage and selection operator regression. Outcomes were identified as molecular subtypes (Luminal A, Luminal B, HER2-enriched, triple-negative). Neural network performance was presented as an area under the curve and accuracies.
Results:
Of the 851 radiomics features, 611 had ICC >0.75, and 37 remained stable in the first experiment, 49 in the second, and 59 in the third based on CoV and VIF analysis. High accuracy was demonstrated by the Luminal B, HER2-enriched, and triple-negative models in the first experiment (>80%), all models in the second experiment, and HER2-enriched and triple-negative models in the third experiment.
Conclusions:
A positive stability is indicated by an increased lesion size related to radiomics features. Neural networks may predict moleculer subtypes of breast cancers over 1 cm3 with high accuracy.
Keywords: Breast carcinoma, diffusion magnetic resonance imaging, computer-assisted image processing, machine learning, artificial intelligence
Abstract
Amaç:
Manyetik rezonans görüntülemede görünür difüzyon katsayısı (ADC) radyomiks verilerine dayalı sinir ağları ile meme kanseri moleküler alt tiplerini tahmin etmek ve lezyon boyutunun radyomiks özelliklerin stabilitesi ile ilişkisini saptamaktır.
Yöntemler:
Bu retrospektif çalışma, Ocak 2015 ile Ocak 2020 tarihleri arasında görüntüleme yapılan meme kanserli hasta kohortunu (n=221, 224 lezyon) içermektedir. Lezyon boyutu ile radyomiks özelliklerinin stabilitesi arasındaki ilişkiyi incelemek için, tümör boyutuna dayalı (deney 1: tüm durumlar, deney 2: >1 cm3 ve deney 3: >2 cm3) üç grup oluşturulmuştur. Üç farklı gözlemci, difüzyon ağırlıklı görüntüleme ile oluşturulan ADC haritalarında tümörleri segmentlere ayırmış ve bu segmentasyonların hacimsel uyumu, Dice katsayısı kullanılarak değerlendirilmiştir. Radyomiks özellik (n=851) seçimi, sınıf içi korelasyon katsayısına (ICC), varyasyon katsayısına (CoV), varyans inflasyon faktörüne (VIF) ve en küçük mutlak küçülme ve seçim operatörü regresyonuna dayandırılmıştır. Sonuçlar moleküler alt tipler olarak tanımlanmıştır (Luminal A, Luminal B, HER2 ile zenginleştirilmiş ve üçlü negatif). Sinir ağı başarı performansı, eğri altındaki alan olarak sunulmuştur.
Bulgular:
Sekiz yüz elli bir radyomiks özelliğinden 611’i ICC >0,75 idi. Bu özelliklerden CoV ve VIF analizi ile 37’si birincide, 49’u ikincide ve 59’u üçüncü deneyde sabit kaldı. İlk deneyde Luminal B, HER2 ile zenginleştirilmiş ve üçlü negatif alt tipler için geliştirilen tahmin modellerinin doğruluğu yüksekti (>%80). İkinci deneyde tüm modeller ve üçüncü deneyde ise HER2 ile zenginleştirilmiş ve üçlü negatif modeller yüksek doğruluğa sahipti.
Sonuçlar:
Radyomiks özellikler, artan lezyon boyutuna bağlı olarak pozitif stabilite göstermektedir. Yapay sinir ağları, 1 cm3 üzerindeki meme kanserlerini yüksek doğrulukla tahmin edebilmektedir.
Keywords: Meme kanseri, ifüzyon manyetik rezonans görüntüleme, bilgisayar destekli görüntü işleme, makine öğrenimi, yapay zeka
INTRODUCTION
Breast cancer is the most common cancer in women1,2. Remarkable developments in the fields of imaging, surgery, pathology, medical oncology, and genetics have led to a significant decline in breast cancer-related death rates in 30 years1,3,4,5. In current clinical practice, patients are classified based on their molecular subtypes3,6, which can be identified via biopsy, thus informing treatment selection6. Currently, molecular subtypes guide treatment using tissue samples or by immunohistochemical markers6,7. However, the major challenges at this point are the limited volume of tumor represented in the biopsy sample and the reliability of the biopsy sample, especially in heterogeneous tumors7. A diagnostic prediction model may predict molecular subtypes using imaging data8,9,10, for examples, automated artificial neural networks (ANN)8 in which many networks can be trained with different configurations. In automation, the separation of the sample into training, test (hyperparameter tuning), and validation (hold-out) sets can be used to determine the training, error function, hidden activation, and output activation to be selected for the network structure11, and human-induced bias is reduced12. However, explainability may be limited in nonlinear models.
Previous studies focused on radiomics features extracted from dynamic contrast-enhanced magnetic resonance imaging (DCE-MRI)10,13,14,15,16,17,18,19. Although DCE-MRI is the most sensitive sequence in breast cancer imaging, the accumulation of gadolinium-based contrast agents in the brain has been a concern20. Additionally, using contrast agents in patients with obesity, diabetes, and renal failure requires great attention1,20. Therefore, non-contrast MRI protocols such as diffusion-weighted imaging (DWI) should be develope5. DWI delivers functional diffusivity data, and, with apparent diffusion coefficient (ADC) mapping, quantifies diffusivity related to cell density in solid tumors. DCE-MRI has been performed to predict molecular subtype, tumor histology, risk of recurrence, response to chemotherapy, and the probability of metastasis8,10,13,14,15,16,17,19,21,22,23. However, few studies used DWIs or ADCs radiomics as predictors9,18,24.
Previous studies focusing on breast cancer molecular subtypes have not evaluated spatial overlap10,13,14,15,16,17,18,19, and few have tested the interobserver reproducibility of the radiomics features22,23. Reproducibility is very important in radiomics feature extraction25,26,27 and, along with sharing data, is as important as the studies’ design, precision, and accuracy26,28. Moreover, to maintain the quality and reproducibility of the studies, studies on artificial intelligence that include complex models should report data with transparency.
The relation between the size of lesions and the stability of radiomics features has not been studied before. This study primarily aimed to predict breast cancer molecular subtypes with automated ANN created based on MRI ADC radiomics features and then to investigate the relationship between lesion size and stability of radiomics features and model accuracy.
MATERIALS and METHODS
Ethical Considerations
This retrospective study was approved by Local Ethics Committee of the Istanbul Medeniyet University Goztepe Training and Research Hospital (decision no: 2020/0303, date: 18.05.2020). The requirement for written informed patient consent was waived by the local ethics committee. We ensured adherence to the STARD 2015 statement29 and the white papers and statements of European, United States, and Canadian societies26,30,31,32. The radiomics quality score was 18/3633. An Image Biomarker Standardization Initiative (IBSI)-compliant software was used for feature extraction34.
Study Population and Data Collection
This model development study was conceived in Istanbul Medeniyet University Goztepe Prof. Dr. Suleyman Yalcin City Hospital. Data of patients histopathologically diagnosed with breast cancer in the general-surgery service of the university hospital between January 2015 and January 2020 were collected. The inclusion criteria were as follows: patients with breast MRI, including DWI sequences; detectable lesion on the DWI and ADC map; and invasive breast cancer as per the pathology report (if the patient had two different types of tumor histology, the tumors were included separately). The exclusion criteria were as follows: patients operated at the research center but without available imaging results and lesions detected on the ADC map but were pathologically diagnosed as in situ cancer. A complete pipeline is presented in Figure 1, and a flowchart of sample selection for the study is presented in E-Figure 1 (You can access all E-Figures and E-Tables from the link at the end of the article).
Figure 1.
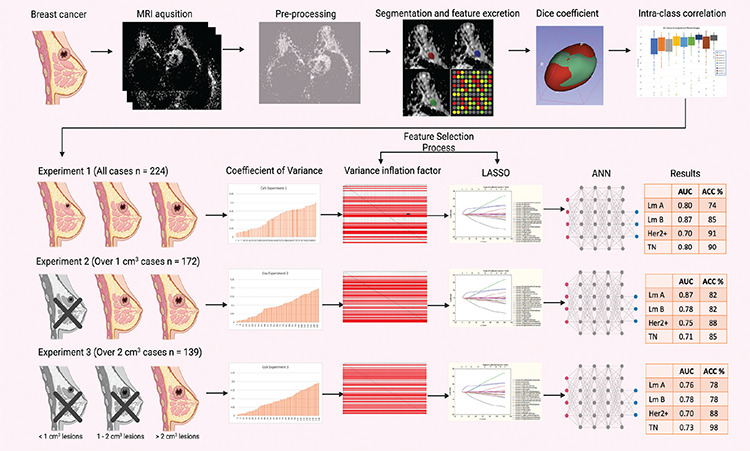
This scheme summarizes the entire study pipeline and results. Patients with MRI among the patients operated on for breast cancer in our hospital were included. After normalization and resampling, three observers independently segmented the lesions and obtained a radiomics feature. The agreements of the segmentations were tested with the Dice coefficient. Interobserver agreement for radiomics features was tested using intra-class correlation coefficient. Patient data were divided into three experimental groups based on the lesion size. Following the European Society of Radiology guideline, the pipeline coefficient variance and variance inflation factor analyses are also performed. As lesion size increased, lesion stability and the success of automated artificial neural networks also increase.
MRI: Magnetic resonance imaging, LASSO: Least absolute shrinkage and selection operator, ANN: Artificial neural networks, AUC: Area under the curve, ACC: Accuracy, HER2: Human epidermal growth factor receptor 2, TN: Triple-negative
Based on the above criteria, 221 patients with 224 lesions were detected for the study (experiment 1, n=224). Breast cancer molecular subtypes based on pathological examination of surgery specimens were recorded in a worksheet by the surgery team. The analysis was repeated by narrowing the data set to over 1 cm3 lesion (experiment 2, n=172) and over 2 cm3 lesions (experiment 3, n=139). The 1.5 Tesla magnet power MRI protocols are described in E-Table 1.
Statistical Analysis
Predictors: Analysis of the ADC Maps
MRIs of the included patients were taken from the hospital archive and anonymized. Using the 3D Slicer (version 4.10.2; https://www.slicer.org) software, three radiologists with 8, 5, and 3 years of experience performed the segmentation from each axial segment where the tumor was located as seen on high b-value DWI images and verified on the ADC map35,36. Co-registration was made between T2 weighted images if the lesion was not detected from DWI. The predictor variables (radiomics features) of this study was extracted with PyRadiomics (version 2.2.0). All the radiomics features (n=851) were included, and wavelet-based filters were used. Raw ADC maps and resampled images (2.0x2.0x2.0 mm) were used and normalized36,37. Other detailed information about the radiomics features included in the study is provided in E-Table 2.
Outcomes
The outcomes of the study were molecular subtypes of breast cancer based on the biopsy: Luminal A, Luminal B, human epidermal growth factor receptor 2 (HER2)-enriched, and triple-negative (TN). These outcomes were coded as “one-vs-rest” orientation (E-Table 3)27.
Features Stability Assessment
Interobserver agreement on the segmentations and radiomics features were evaluated by Dice similarity coefficient27 and the intraclass correlation coefficient (ICC), respectively38. Discrepancies in the Dice similarity coefficient of segmentations (<0.50) were resolved by consensus. Features with an ICC >0.75 were further analyzed. Features from the three measurements were averaged, and the data were combined with the worksheet containing the pathology data. Worksheets containing three different sample size configurations were created. The coefficient of variation (CoV) analysis, which radiomics features showing >15% variance, was eliminated26,28. Then, Spearman’s correlation (SC) analysis was performed to evaluate the remaining features, followed by variance inflation factor (VIF) analysis.
Collinearity-multicollinearity Analysis and Final Feature Selection
To achieve low collinearity-multicollinearity, VIF analyses were performed. In case VIF was above 10, the radiomic feature was eliminated28,39. For validation, SC analysis was performed between features and outcomes (p<0.01)26. Least absolute shrinkage and selection operator (LASSO) was used for future selection with random sampling method and 10-fold cross-validation.
Structuring Automated Artificial Neural Networks
Neural networks were binary classifiers as “one-vs-rest” orientation, and a diagnostic model was developed after feature selection using features selected for each experiment and outcome27. The data were divided into three subsamples in each training session using a random number generator. The software randomly sampled 50%-70% of the cases as training set, 10%-20% as a test set (hyperparameter tuning set), and 20%-30% as a validation (hold-out) set. Multilayer perceptron (MLP) and radial basis function (RBF) neurons were trained, and networks were feedforward and fully connected11. In each analysis, MLP or RBF neurons were trained, tested, and validated with unseen data set. The software automatically assigned the number of neurons (6-25), the number of layers [input layer (n= predictors for RBF and n= predictors + bias neuron for MLP), minimum two hidden layer, output layer (n=2, Positive event or not)], the number of bias neurons (minimum one per hidden layer both RBF and MLP), activation - hidden - output function [identity, logistic sigmoid, hyperbolic tangent, exponential, Softmax, and Gaussian (only available for RBF networks), and error function (sum of squares, cross entropy)], in these models by evaluating input, output data, and sub sample proportions11. Hyperparameter tuning was made with early-stopping algorithm11. Then, a neural network search was performed for each outcome in three sample size configurations. Figure 2 summarizes how automated ANN were trained, tested, and validated. Most accurate networks were retained for each experiment and outcome. Most efficient networks results are presented with area under the curve (AUC) (95% confidence intervals; lower and upper bounds)26,27. In receiver operating curve analysis, AUC >0.85 and p<0.01 is considered a validated classifier neural network. TIBCO Statistica version 13.5 (TIBCO Software, Palo Alto, CA) was used for statistical analyses and neural network training.
Figure 2.
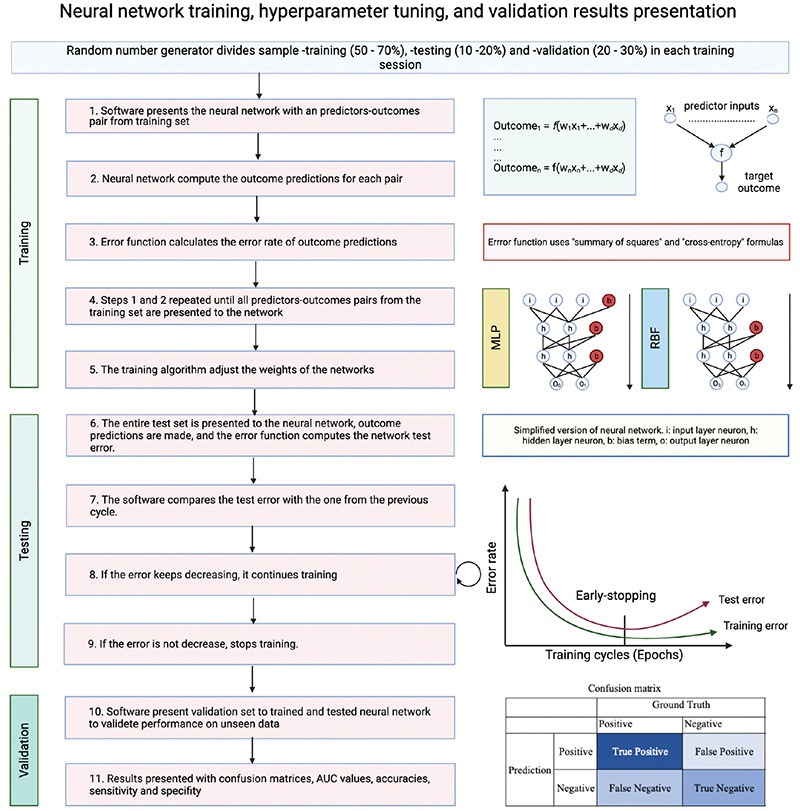
The diagram explains how automated artificial neural networks were trained, tested, and validated. Early-stopping hyperparameter tuning allows train neural networks faster, allowing training of thousands of neural networks in a short time.
AUC: Area under the curve, MLP: Multilayer perceptron, RBF: Radial basis function
RESULTS
Patient’s Characteristics
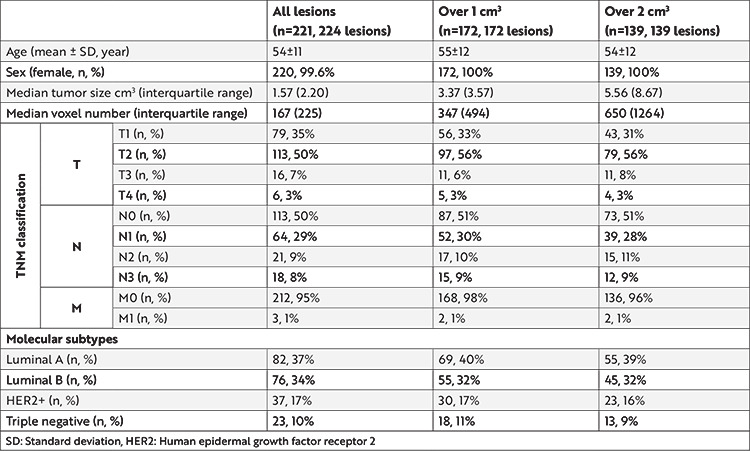
This study included 221 patients (mean age, 54±11 years); of them, 220 (99%) were women. Clinicopathologic characteristics of the patients are presented in Table 1.
Table 1. Clinicopathologic characteristics of the participants for three experiments.
Feature Selection Results
The interobserver mean Dice coefficient values were as follows: between observers 1 and 2, 0.81±0.08 (0.80-0.82); for observers 1 and 3, 0.80±0.10 (0.79-0.82); and between observers 2 and 3, 0.73±0.11 (0.71-0.74).
The results of the resampled image features were not presented due to lower performance on ICC, CoV, VIF, LASSO analyses, and multivariate diagnostic models.
CoV, VIF, and LASSO regression analyses were performed separately in all three experiments (Figure 3). Of the 851 radiomic features, 611 were extracted from three segmentations with ICC values >0.75 and then included in a CoV analysis: 93 in the first experiment, 118 in the second experiment, and 136 in the third experiment. E-Table 3 presents an exact number of participants and outcome events for each analysis.
Figure 3.
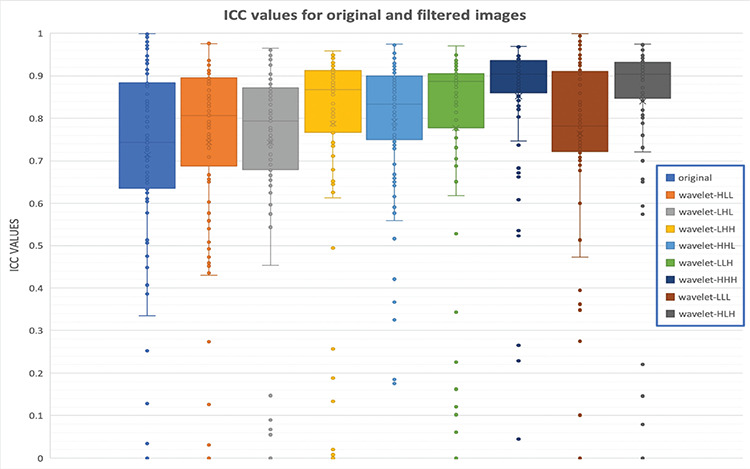
Evaluation of interobserver correlation coefficient (ICC) for original and filtered images. The first boxplot comes from the original image features, and only 46 features show high reproducibility (ICC >0.75). However, wavelet-HHH and wavelet-HLH features demonstrated higher reproducibility. Features from these filters have better reproducibility (80 and 79 features, respectively).
ICC: Interobserver correlation coefficient
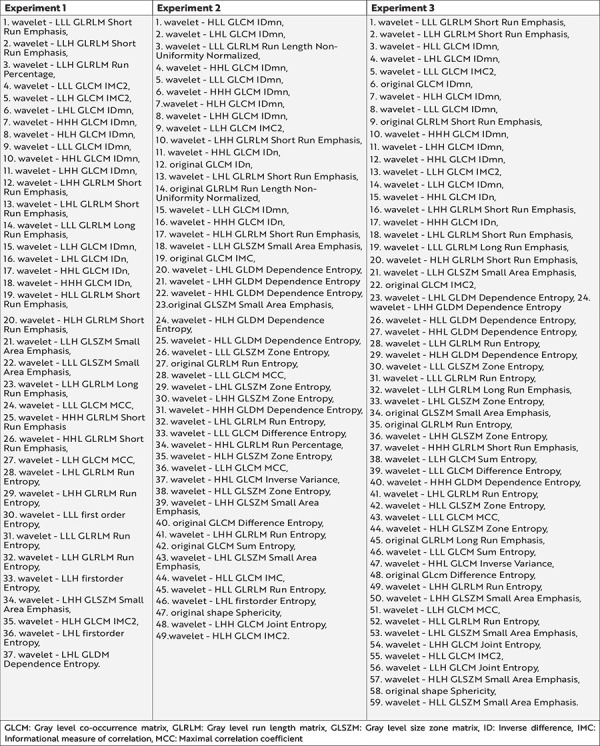
In the VIF analysis, other features were excluded from the models (Figure 4) and features showing collinearity-multicollinearity were excluded, resulting in 37 features in the first experiment, 49 in the second experiment, and 59 features in the third experiment (Table 2, E-Figure 2).
Figure 4.

Heatmaps for the stable features before variance inflation factor analysis for three sample size configurations. The heatmap created for collinearity evaluation after features were eliminated due to interobserver agreement and high variance showed that there were the least stable features in the first configuration (A), and most of them were collinear. While the number of stable radiomics features increased in the second (B) and third (C) configurations, the collinearity decreased (heatmaps in detail for each experiment; https://github.com/MBE-hub/Breast/tree/master/Breast/4.Heat%20 Maps).
Table 2. Stable radiomics features after coefficient of variance and variance inflation factor analyses for three experiments.
In the correlation analysis, for all SC ‘r’ for the first and second experiments, the radiomics features were not successful. In the third experiment, all SC ‘r’ were <0.40, and p<0.01 for 12 predictors for TN breast cancer.
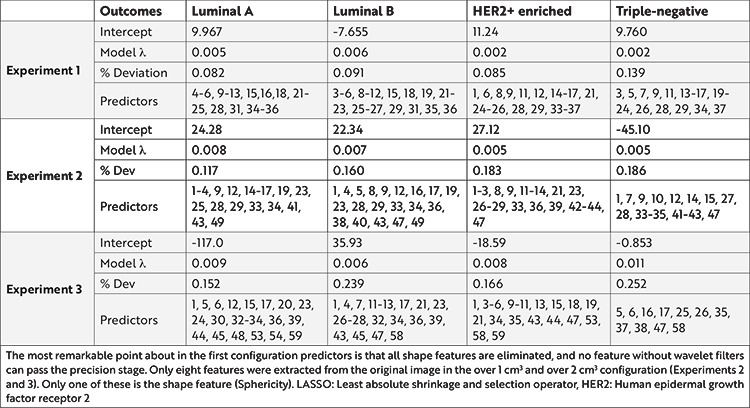
LASSO regression was used for regularization, and the analysis results for each outcome are shared in Table 3.
Table 3. Selected predictor radiomics features analyzed by LASSO regression in three sample size configurations.
Diagnostic Prediction Model Results
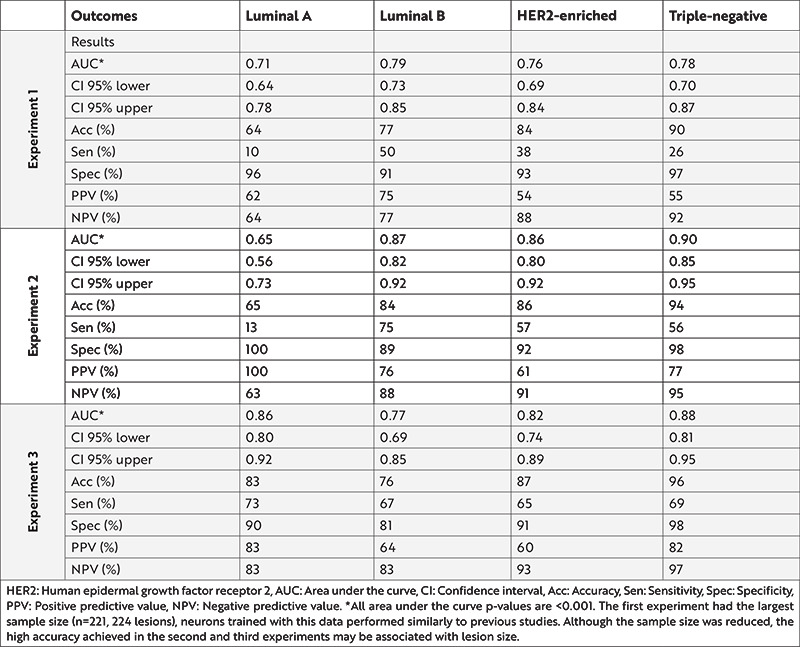
From the three experiments, each of 12 neural networks contained four multivariable binary classifier models (Table 4). Confusion matrix and detailed performance metrics are presented for Luminal A in the E-Table 4, for Luminal B in the E-Table 5, for HER2-enriched in the E-Table 6, and for TN in the E-Table 7. In the validation (hold-out) set, the model trained for Luminal B in the first experiment and Luminal A in the second experiment reached AUC of 0.87 (0.73-0.99) and 0.87 (0.73-0.99), respectively. These findings indicate a high accuracy (>0.80) for Luminal B, HER2-enriched, and TN models in the first experiment; all models in the second experiment; and HER2-enriched, and TN models in the third experiment.
Table 4. Artificial neural networks performance results of three experiments.
All data used in this study, the results of the analyses, and the trained neural network codes were shared publicly on GitHub (https://github.com/MBE-hub/Breast).
DISCUSSION
Based on the results of the present study, neural networks may predict molecular subtypes of breast cancer over 1 cm3. Compared with previous studies, the present study evaluated the stability of radiomic features using the Dice similarity index, ICC, and CoV; the VIF was used to eliminate highly collinear features.
Currently, a minimally invasive approach is the most prevalent in medical practice5. Contrast-enhanced examinations are also considered an intervention5,20. Therefore, we focused on ADC radiomics as an alternative to invasive imaging modalities. Chen et al.14 offered that ADC radiomics provided a more accurate diagnosis than DCE MRI radiomics. Unlike previous studies, the present study performed all breast cancers without limiting lesion size9,10,13,14,15,16,22,23,35. Experiment 2, which included over 1 cm3, showed the best accuracy. In the first experiment, fewer pixels were segmented in small lesions, affecting the stability of the radiomics feature. Experiment 3 has a relatively limited sample size, and the validation set proportion was set to 30% to overcome this challenge and prevent overfitting.
Previous studies that assessed the molecular subtypes of breast cancer using an interobserver design did not evaluate the spatial overlap with the Dice coefficient9,10,13,14,15,16. However, the evaluation of spatial overlap is recommended27. Traverso et al.36,37 performed two studies based on cervix and rectal cancer using the Dice coefficient; the median Dice coefficient for the two observers was 0.73 and 0.75, respectively, which are similar to our results. The Dice coefficient provides a susceptible analysis as it depends on the pixel-to-pixel overlap of segmentation36,37. Given the sensitivity of the Dice method, the agreement of segmentations was almost perfect in this study. Furthermore, as mitigating certain discrepancies has been a challenge, observers re-evaluated the patients with a Dice coefficient <0.50 (n=9) to avoid bias.
In the present study, 72% of the radiomic features had ICC value >0.75. Using super-resolution ADC images, Fan et al.22 performed a radiomics analysis to predict the histologic grade and Ki-67 expression status of breast cancer and found that shape and first-order features had an ICC >0.7, and neighborhood gray tone difference in matrix features showed large variance, with a low mean ICC. Zhang et al.35 modelled multiparametric MRI to differentiate benign and malignant lesions from radiomics features and noted that all features had an ICC value of >0.75. Similarly, the present study included features with an ICC of >0.75. However, issues on reproducibility were raised due to not using an exclusion criterion for ICC25,38 and not considering an interobserver assessment.
The European Society of Radiology (ESR) has recently published a statement on the validation of imaging biomarkers and described the validation pipeline26. The first step of this pipeline offers to evaluate features with a CoV analysis, stating, “high precision (low variance) is considered mandatory for the validation.” Due to the novelty of this statement, none of the previous studies have used this analysis. In stability analysis, only 16% of features showed high stability even at the best condition (experiment 3: over 2 cm3 lesions).
Parekh and Jacobs19 reported that multivariable models had increased AUC (9-28%). Therefore, in the present study, we used multivariable models. Given the emerging use of multivariable regressions in feature selection tasks, collinearity-multicollinearity has become an essential problem. Kim39 has described multicollinearity as a high degree of linear intercorrelation between predictor variables in a multivariable regression model. If collinearity is ignored, features on analysis become almost identical, thus increasing the relative error rate. In addition, features that better explain the model are ruled out due to the many identical features chosen. Although various methods have been defined, we preferred to eliminate features that show collinearity-multicollinearity in this study, and features were stable in only 7% of this elimination. Previous studies have not reported VIF analysis9,10,13,14,15,16.
These results offered that radiomics features stability related to lesion size. The number of stable features increased with increasing lesion size. Despite the decrease in sample size in the second and third experiments, an increase in the Spearman correlation coefficient value, with an increase in the number of significant predictors, indicates a relationship between radiomics features stability and lesion size.
For validated biomarkers, the third item of the ESR statement pipeline requested that the p-value be <0.01 in the correlation analysis26. In the univariate analysis, a few radiomics features were validated in this study (E-Figure 2). Furthermore, their correlation coefficients were weak since LASSO regression was used for regularization in the current study23,24,25.
Sutton et al.10 have used the support vector machine, which included 38 features (mostly shape and contrast-enhancement patterns) and found the accuracy for prediction of TN molecular subtype breast cancer at 81%. This study used 851 features and found that all shape features, except for sphericity, are not stable in precision and accuracy. Moreover, sphericity could not be measured accurately, even in IBSI compliant software34.
Diagnostic prediction models will benefit the clinician in detecting HER2-enriched and TN tumors. Leithner et al.8 trained a TN ANN classifier with AUC =0.80 and 68.2% accuracy in the validation set. However, their other classifiers presented accuracies at 38.7%-70.3%. In the present study, neurons trained above 1 cm3 configuration can estimate Luminal A, Luminal B, and HER2-enriched models with accuracy as high as that of the TN model; high specificity (>80%) was observed in the neurons in experiment 2, with moderate to high sensitivity (33%-80%).
The study has some limitations. The retrospective study design and single-center nature limit the generalizability of results. However, MR scans were performed with two different devices, and four different protocols and b-values in our center increased the potential diversity. For external validation, the cancer imaging archive was scanned, but without suitable data.
We used the manual segmentation method in this study because approximately 1/4 of our lesions were less than 1 cm3. In addition, a recent study showed that automatic segmentation is not a good option for small lesions40. Fortunately, automated segmentation methods have made rapid progress21. Future studies with large datasets may focus on breast cancer molecular subtype discrimination using convolutional neural networks and automated segmentation methods.
Using automated ANN minimizes human-induced bias17. However, the models created due to the weak linear relationship between predictors and outcomes reduce the network explainability. In the preliminary stage of the study, we also experienced machine learning methods such as support vector machines and K-nearest neighbors, and we attempted to train multiclass classifier methods such as gradient descent boosting and adaptive boosting. However, all these machine learning algorithms showed obviously lower accuracy than the models used in this study.
Radiomics features extraction yields the best results on iso-voxel partitioned images. Therefore, this study used both raw data (highly interpolated) and 2.0 mm iso-voxel images. Contrary to expectations, raw images showed better performance in this study, which was not supported by the literature, thereby limiting our discussion8,9,10. Based on our findings, high interpolation and high slice thickness caused artificial homogeneity on the resampled images, making the model success not better than raw images. Future studies should aim to increase the stability radiomics features and model success. Especially for DWI and ADC, it is necessary to increase the matrix values, decrease the section thickness, and increase the signal-to-noise ratio.
CONCLUSION
The stability of radiomics features is positively correlated to an increased lesion size. A diagnostic prediction model is a triaging and expediting the need for biopsy and/or for supporting histopathologic results in equivocal cases. However, while this prediction does not replace biopsy, it may require the triage of patients to be prioritized in radiology reporting, biopsy, and pathology reporting. The rapid and accurate triage of breast cancer molecular subtypes using imaging will be a potential development.
Acknowledgments
The authors thank Prof. Handan Ankaralı from Istanbul Medeniyet University Faculty of Medicine, Division of Biostatistics and Medical Informatics for her consultancy during the data generation, evaluation, and validation process.
Footnotes
Ethics
Ethics Committee Approval: This retrospective study was approved by Local Ethics Committee of the Istanbul Medeniyet University Goztepe Training and Research Hospital (decision no: 2020/0303, date: 18.05.2020).
Informed Consent: The requirement for written informed patient consent was waived by the local ethics committee.
Peer-review: Externally and internally peer-reviewed.
Author Contributions
Surgical and Medical Practices: H.B., O.A., Concept: B.B., H.B., M.B.E., M.B.D., O.A., Design: B.B., H.B., M.B.D., Data Collection and/or Processing: B.B., M.B.E., M.B.D., Analysis and/or Interpretation: B.B., M.B.E., O.A., Literature Search: B.B., H.B., M.B.E., M.B.D., O.A., Writing: B.B., H.B., M.B.E., M.B.D., O.A.
Conflict of Interest: The authors have no conflict of interest to declare.
Financial Disclosure: The authors declared that this study has received no financial support.
References
- 1.DeSantis CE, Ma J, Gaudet MM, et al. Breast cancer statistics, 2019. CA Cancer J Clin. 2019;69:438–51. doi: 10.3322/caac.21583. [DOI] [PubMed] [Google Scholar]
- 2.Bray F, Ferlay J, Soerjomataram I, Siegel RL, Torre LA, Jemal A. Global cancer statistics 2018: GLOBOCAN estimates of incidence and mortality worldwide for 36 cancers in 185 countries. CA Cancer J Clin. 2018;68:394–424. doi: 10.3322/caac.21492. [DOI] [PubMed] [Google Scholar]
- 3.Jin YH, Hua QF, Zheng JJ, et al. Diagnostic Value of ER, PR, FR and HER-2-Targeted Molecular Probes for Magnetic Resonance Imaging in Patients with Breast Cancer. Cell Physiol Biochem. 2018;49:271–81. doi: 10.1159/000492877. [DOI] [PubMed] [Google Scholar]
- 4.Lee SH, Park H, Ko ES. Radiomics in breast imaging from techniques to clinical applications: A review. Korean J Radiol. 2020;21:779–92. doi: 10.3348/kjr.2019.0855. [DOI] [PMC free article] [PubMed] [Google Scholar]
- 5.Telegrafo M, Rella L, Stabile Ianora AA, Angelelli G, Moschetta M. Unenhanced breast MRI (STIR, T2-weighted TSE, DWIBS): An accurate and alternative strategy for detecting and differentiating breast lesions. Magn Reson Imaging. 2015;33:951–5. doi: 10.1016/j.mri.2015.06.002. [DOI] [PubMed] [Google Scholar]
- 6.Goldhirsch A, Winer EP, Coates AS, et al. Personalizing the treatment of women with early breast cancer: Highlights of the st gallen international expert consensus on the primary therapy of early breast Cancer 2013. Ann Oncol. 2013;24:2206–23. doi: 10.1093/annonc/mdt303. [DOI] [PMC free article] [PubMed] [Google Scholar]
- 7.Pisco AO, Huang S. Non-genetic cancer cell plasticity and therapy-induced stemness in tumor relapse: ‘What does not kill me strengthens me’. Br J Cancer. 2015;112:1725–32. doi: 10.1038/bjc.2015.146. [DOI] [PMC free article] [PubMed] [Google Scholar]
- 8.Leithner D, Mayerhoefer ME, Martinez DF, et al. Non-Invasive Assessment of Breast Cancer Molecular Subtypes with Multiparametric Magnetic Resonance Imaging Radiomics. J Clin Med. 2020;9:1853. doi: 10.3390/jcm9061853. [DOI] [PMC free article] [PubMed] [Google Scholar]
- 9.Leithner D, Bernard-Davila B, Martinez DF, et al. Radiomic Signatures Derived from Diffusion-Weighted Imaging for the Assessment of Breast Cancer Receptor Status and Molecular Subtypes. Mol Imaging Biol. 2020;22:453–61. doi: 10.1007/s11307-019-01383-w. [DOI] [PMC free article] [PubMed] [Google Scholar]
- 10.Sutton EJ, Dashevsky BZ, Oh JH, et al. Breast cancer molecular subtype classifier that incorporates MRI features. J Magn Reson Imaging. 2016;44:122–9. doi: 10.1002/jmri.25119. [DOI] [PMC free article] [PubMed] [Google Scholar]
- 11.Statistica Automated Neural Networks (SANN) - Neural Networks Overview. Accessed 19 Sep 2021. Available from: [Internet] https://docs.tibco.com/data-science/GUID-F60C241F-CD88-4714-A8C8-1F28473C52EE.html.
- 12.Sengupta E, Garg D, Choudhury T, Aggarwal A. Techniques to elimenate human bias in machine learning. In: Proceedings of the 2018 International Conference on System Modeling and Advancement in Research Trends (SMART) IEEE. 2018;. p.:226–30. [Google Scholar]
- 13.Chang RF, Chen HH, Chang YC, Huang CS, Chen JH, Lo CM. Quantification of breast tumor heterogeneity for ER status, HER2 status, and TN molecular subtype evaluation on DCE-MRI. Magn Reson Imaging. 2016;34:809–19. doi: 10.1016/j.mri.2016.03.001. [DOI] [PubMed] [Google Scholar]
- 14.Chen X, Chen X, Yang J, Li Y, Fan W, Yang Z. Combining Dynamic Contrast-Enhanced Magnetic Resonance Imaging and Apparent Diffusion Coefficient Maps for a Radiomics Nomogram to Predict Pathological Complete Response to Neoadjuvant Chemotherapy in Breast Cancer Patients. J Comput Assist Tomogr. 2020;44:275–83. doi: 10.1097/RCT.0000000000000978. [DOI] [PubMed] [Google Scholar]
- 15.Grimm LJ, Zhang J, Mazurowski MA. Computational approach to radiogenomics of breast cancer: Luminal A and luminal B molecular subtypes are associated with imaging features on routine breast MRI extracted using computer vision algorithms. J Magn Reson Imaging. 2015;42:902–7. doi: 10.1002/jmri.24879. [DOI] [PubMed] [Google Scholar]
- 16.Li H, Zhu Y, Burnside ES, et al. Quantitative MRI radiomics in the prediction of molecular classifications of breast cancer subtypes in the TCGA/TCIA data set. NPJ Breast Cancer. 2016;2:16012. doi: 10.1038/npjbcancer.2016.12. [DOI] [PMC free article] [PubMed] [Google Scholar]
- 17.O’Flynn EA, Collins D, D’Arcy J, Schmidt M, de Souza NM. Multi-parametric MRI in the early prediction of response to neo-adjuvant chemotherapy in breast cancer: Value of non-modelled parameters. Eur J Radiol. 2016;85:837–42. doi: 10.1016/j.ejrad.2016.02.006. [DOI] [PubMed] [Google Scholar]
- 18.Parekh VS, Jacobs MA. Integrated radiomic framework for breast cancer and tumor biology using advanced machine learning and multiparametric MRI. NPJ Breast Cancer. 2017;3:43. doi: 10.1038/s41523-017-0045-3. [DOI] [PMC free article] [PubMed] [Google Scholar]
- 19.Parekh VS, Jacobs MA. Multiparametric radiomics methods for breast cancer tissue characterization using radiological imaging. Breast Cancer Res Treat. 2020;180:407–21. doi: 10.1007/s10549-020-05533-5. [DOI] [PMC free article] [PubMed] [Google Scholar]
- 20.Gulani V, Calamante F, Shellock FG, Kanal E, Reeder SB; International Society for Magnetic Resonance in Medicine. Gadolinium deposition in the brain: summary of evidence and recommendations. Lancet Neurol. 2017;16:564–70. doi: 10.1016/S1474-4422(17)30158-8. [DOI] [PubMed] [Google Scholar]
- 21.Bhattacharjee R, Douglas L, Drukker K, Hu Q, Fuhrman J, Sheth D, Giger M. Comparison of 2D and 3D U-Net breast lesion segmentations on DCE-MRI. In Medical Imaging 2021: Computer- Aided Diagnosis. SPIE. 2021;. p.:81–7. [Google Scholar]
- 22.Fan M, Yuan W, Zhao W, et al. Joint Prediction of Breast Cancer Histological Grade and Ki-67 Expression Level Based on DCE-MRI and DWI Radiomics. IEEE J Biomed Health Inform. 2020;24:1632–42. doi: 10.1109/JBHI.2019.2956351. [DOI] [PubMed] [Google Scholar]
- 23.Zhang Q, Peng Y, Liu W, et al. Radiomics Based on Multimodal MRI for the Differential Diagnosis of Benign and Malignant Breast Lesions. J Magn Reson Imaging. 2020;52:596–607. doi: 10.1002/jmri.27098. [DOI] [PubMed] [Google Scholar]
- 24.Bickelhaupt S, Paech D, Kickingereder P, et al. Prediction of malignancy by a radiomic signature from contrast agent-free diffusion MRI in suspicious breast lesions found on screening mammography. J Magn Reson Imaging. 2017;46:604–16. doi: 10.1002/jmri.25606. [DOI] [PubMed] [Google Scholar]
- 25.Koçak B, Durmaz EŞ, Ateş E, Kılıçkesmez Ö. Radiomics with artificial intelligence: a practical guide for beginners. Diagn Interv Radiol. 2019;25:485–95. doi: 10.5152/dir.2019.19321. [DOI] [PMC free article] [PubMed] [Google Scholar]
- 26.European Society of Radiology (ESR) ESR Statement on the Validation of Imaging Biomarkers. Insights Imaging. 2020;11:76. doi: 10.1186/s13244-020-00872-9. [DOI] [PMC free article] [PubMed] [Google Scholar]
- 27.Erickson BJ, Kitamura F. Magician’s Corner: 9. Performance Metrics for Machine Learning Models. Radiol Artif Intell. 2021;3:e200126. doi: 10.1148/ryai.2021200126. [DOI] [PMC free article] [PubMed] [Google Scholar]
- 28.Kocak B, Kus EA, Kilickesmez O. How to read and review papers on machine learning and artificial intelligence in radiology: a survival guide to key methodological concepts. Eur Radiol. 2021;31:1819–30. doi: 10.1007/s00330-020-07324-4. [DOI] [PubMed] [Google Scholar]
- 29.Bossuyt PM, Reitsma JB, Bruns DE, et al. STARD 2015: An Updated List of Essential Items for Reporting Diagnostic Accuracy Studies. Radiology. 2015;277:826–32. doi: 10.1148/radiol.2015151516. [DOI] [PubMed] [Google Scholar]
- 30.Jaremko JL, Azar M, Bromwich R, et al. Canadian Association of Radiologists White Paper on Ethical and Legal Issues Related to Artificial Intelligence in Radiology. Can Assoc Radiol J. 2019;70:107–18. doi: 10.1016/j.carj.2019.03.001. [DOI] [PubMed] [Google Scholar]
- 31.Geis JR, Brady AP, Wu CC, et al. Ethics of Artificial Intelligence in Radiology: Summary of the Joint European and North American Multisociety Statement. Radiology. 2019;293:436–40. doi: 10.1148/radiol.2019191586. [DOI] [PubMed] [Google Scholar]
- 32.European Society of Radiology (ESR) What the radiologist should know about artificial intelligence - an ESR white paper. Insights Imaging. 2019;10:44. doi: 10.1186/s13244-019-0738-2. [DOI] [PMC free article] [PubMed] [Google Scholar]
- 33.Park JE, Kim D, Kim HS, et al. Quality of science and reporting of radiomics in oncologic studies: room for improvement according to radiomics quality score and TRIPOD statement. Eur Radiol. 2020;30:523–36. doi: 10.1007/s00330-019-06360-z. [DOI] [PubMed] [Google Scholar]
- 34.Fornacon-Wood I, Mistry H, Ackermann CJ, et al. Reliability and prognostic value of radiomic features are highly dependent on choice of feature extraction platform. Eur Radiol. 2020;30:6241–50. doi: 10.1007/s00330-020-06957-9. [DOI] [PMC free article] [PubMed] [Google Scholar]
- 35.Zhang Y, Zhu Y, Zhang K, et al. Invasive ductal breast cancer: preoperative predict Ki-67 index based on radiomics of ADC maps. Radiol Med. 2020;125:109–16. doi: 10.1007/s11547-019-01100-1. [DOI] [PubMed] [Google Scholar]
- 36.Traverso A, Kazmierski M, Welch ML, et al. Sensitivity of radiomic features to inter-observer variability and image pre-processing in Apparent Diffusion Coefficient (ADC) maps of cervix cancer patients. Radiother Oncol. 2020;143:88–94. doi: 10.1016/j.radonc.2019.08.008. [DOI] [PubMed] [Google Scholar]
- 37.Traverso A, Kazmierski M, Shi Z, et al. Stability of radiomic features of apparent diffusion coefficient (ADC) maps for locally advanced rectal cancer in response to image pre-processing. Phys Med. 2019;61:44–51. doi: 10.1016/j.ejmp.2019.04.009. [DOI] [PubMed] [Google Scholar]
- 38.Koo TK, Li MY. A Guideline of Selecting and Reporting Intraclass Correlation Coefficients for Reliability Research. J Chiropr Med. 2016;15:155–63. Erratum in: J Chiropr Med. 2017;16:346. doi: 10.1016/j.jcm.2016.02.012. [DOI] [PMC free article] [PubMed] [Google Scholar]
- 39.Kim JH. Multicollinearity and misleading statistical results. Korean J Anesthesiol. 2019;72:558–69. doi: 10.4097/kja.19087. [DOI] [PMC free article] [PubMed] [Google Scholar]
- 40.Vorontsov E, Cerny M, Régnier P, et al. Deep Learning for Automated Segmentation of Liver Lesions at CT in Patients with Colorectal Cancer Liver Metastases. Radiol Artif Intell. 2019;1:180014. doi: 10.1148/ryai.2019180014. [DOI] [PMC free article] [PubMed] [Google Scholar]


