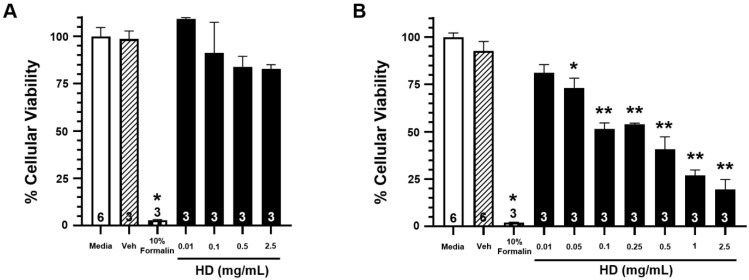
Figure 2.
Effects of HD on the viability of EpiAirwayTM tissues. Open bars represent mean ± SEM of cellular viability of untreated EpiAirwayTM tissues at 3 h (A) or 24 h (B).Closed bars represent mean ± SEM of cellular viability of EpiAirwayTM tissues at 3 h (A) or 24 h (B) following treatment with increasing concentrations of HD (0.01–2.5 mg/mL; 0.0629–15.7 mM). Cross-hatched bars represent mean ± SEM of cellular viability of EpiAirwayTM tissues at 3 h (A) or 24 h (B) with an equivalent amount of vehicle (corn oil). Checkered bars represent mean ± SEM of cellular viability of EpiAirwayTM tissues treated with 10% formalin (positive control) at 3 h (A) or 24 h (B). Experimental n is indicated within each bar. * Significantly decreased compared to vehicle control at p < 0.05. ** Significantly decreased compared to vehicle control at p < 0.01. SEM indicates the standard error of the mean.

