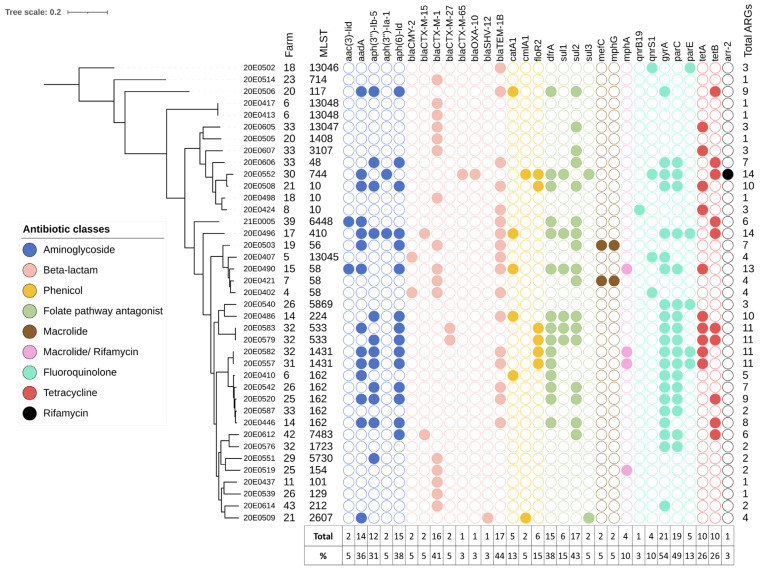
Figure 3.
Whole-genome phylogenetic tree showing the distribution of the resistome of the 39 E. coli strains isolated from SAC and whole-genome sequenced. The strain designation, farm ID and MLST of the samples are indicated in the first three columns. Resistance genes, grouped by antibiotic class, are demarcated by colored circles. The last column indicates the total number of resistance genes per sample. The table below the plot shows the representation of the resistance gene, which contains the total number of each resistance gene detected in the sample and its percentage in all strains. The image was generated with ITOL (v.6).

