Abstract
Long-term glucagon receptor (GCGR) agonism is associated with hyperglycemia and glucose intolerance, while acute GCGR agonism enhances whole-body insulin sensitivity and hepatic AKTSer473 phosphorylation. These divergent effects establish a critical gap in knowledge surrounding GCGR action. mTOR complex 2 (mTORC2) is composed of seven proteins, including RICTOR, which dictates substrate binding and allows for targeting of AKTSer473. We used a liver-specific Rictor knockout mouse (RictorΔLiver) to investigate whether mTORC2 is necessary for insulin receptor (INSR) and GCGR cross talk. RictorΔLiver mice were characterized by impaired AKT signaling and glucose intolerance. Intriguingly, RictorΔLiver mice were also resistant to GCGR-stimulated hyperglycemia. Consistent with our prior report, GCGR agonism increased glucose infusion rate and suppressed hepatic glucose production during hyperinsulinemic-euglycemic clamp of control animals. However, these benefits to insulin sensitivity were ablated in RictorΔLiver mice. We observed diminished AKTSer473 and GSK3α/βSer21/9 phosphorylation in RictorΔLiver mice, whereas phosphorylation of AKTThr308 was unaltered in livers from clamped mice. These signaling effects were replicated in primary hepatocytes isolated from RictorΔLiver and littermate control mice, confirming cell-autonomous cross talk between GCGR and INSR pathways. In summary, our study reveals the necessity of RICTOR, and thus mTORC2, in GCGR-mediated enhancement of liver and whole-body insulin action.
Introduction
Traditionally known for its counterregulatory role opposing insulin action, glucagon (GCG) is a 29–amino acid peptide released from α-cells of the pancreatic islet (1,2). GCG regulates a range of actions including hepatic glycogenolysis and gluconeogenesis, amino acid catabolism, lipolysis, ketogenesis, fatty acid oxidation, satiety, thermogenesis, energy expenditure, and bile acid metabolism (1). These GCG-mediated improvements in lipid and energy metabolism may be desirable in patients with the metabolic syndrome. Consequently, glucagon receptor (GCGR) agonism has been added to classic incretin hormones in single-molecule, multireceptor coagonists that elicit superior therapeutic efficacy. These compounds stimulate profound weight loss yet lack GCGR-associated hyperglycemic side effects, presumably due to the counteraction of the incretin components (3–7). However, GCGR activity has long been associated with diabetes and obesity-associated glucose dysregulation. Thus, it is important to elucidate the physiological conditions, target tissues, and potential mechanisms by which GCGR action regulates glucose homeostasis.
Cellular response to energetic supply and demand is essential in maintaining metabolic homeostasis. A crucial node in this response is the target of rapamycin (TOR) protein kinase, a 289-kDa serine/threonine protein kinase (8). Intriguingly, mTOR is the catalytic core of two independent complexes, mTOR complex 1 (mTORC1) and mTORC2, each with independent targets and cellular functions (9). The rapamycin-resistant mTORC2 complex is comprised of seven proteins including mammalian lethal with SEC13 protein 8 (mLST8), MAPK-interacting protein 1 (mSIN1), DEP-domain-containing mTOR-interacting protein (DEPTOR), protein associated with RICTOR 1 or 2 (PROTOR1/2), and the scaffolding protein RICTOR. RICTOR is the defining feature of the mTORC2 complex and facilitates mTORC2 activation of the Ser/Thr-specific kinase AKT (9). AKT is a critical and essential node for insulin receptor (INSR)-stimulated glucose homeostasis in liver and other glucoregulatory tissues (10). mTORC2 phosphorylates Ser473 of AKT, facilitating subsequent phosphorylation at Thr308 by the phosphoinositide-dependent kinase 1 (PDK1) (11). The combination of these two phosphorylation events is necessary for full AKT activation (11).
While chronic GCGR agonism stimulates hyperglycemia and glucose intolerance (12), we reported an unexpected improvement in insulin-stimulated glucose metabolism after acute GCGR agonism (13). This observation was confirmed to be dependent on hepatic GCGR signaling and mechanistically associated with enhanced phosphorylation of AKT at Ser473 (13). Here we expand on those initial observations to demonstrate that 1) GCGR agonism enhances systemic insulin sensitivity during both hypoglycemic and euglycemic conditions and 2) this regulation is dependent on hepatic mTORC2 signaling. Together, these data expand our mechanistic understanding of GCGR activation and its role in glucose homeostasis.
Research Design and Methods
Animal Models
All studies were approved by and performed according to the guidelines of the Institutional Animal Care and Use Committee of the University of Alabama at Birmingham. Mice were single or group housed on a 12 h:12 h light:dark cycle (light on from 0600 to 1800 h) at 22°C in constant humidity with free access to food and water, except as noted. Rictor-floxed and Alb-Cre mice were obtained from The Jackson Laboratory (Bar Harbor, ME). AAV8-TGB-iCre (2 * 1011 GC/mouse, no. VB1724; Vector BioLabs) was used to establish adult inducible, hepatic Rictor knockout (iRictorΔLiver mice). AAV-Cre or AAV-eGFP (VB1743; Vector BioLabs) were induced via retro-orbital delivery, and hepatocytes were isolated 7 days after induction. All mice were maintained in our facilities on a C57Bl/6J background and fed standard chow (Teklad LM-485, 5.6% fat).
Peptides
IUB288 was synthesized as previously described (12). Glucagon (1-29) trifluoroacetate salt was obtained from Thermo Fisher Scientific and insulin (Humulin R) from Eli Lilly and Co.
Glucose Phenotyping Tests
Glucose tolerance tests (GTT) were performed with injection of glucose (2 g/kg i.p., 25% w/v d-glucose [Sigma-Aldrich] in 0.9% w/v saline). Blood glucose was determined by Contour glucometer (9545C; Ascensia Diabetes Care). Glucose clamps were conducted as previously described (13,14). Briefly, catheters were implanted in 4-month-old male chow-fed, C57BL6 mice (30–32 g body wt) for hypoglycemic clamp or 4- to 6-month-old male RictorΔLiver mice and control littermates for euglycemic clamp. Seven days postoperative, 5-h-fasted mice were injected with saline or IUB288 (10 nmol/kg s.c.) during the final 60 min of fasting. Insulin (1.2 mU/kg/min for euglycemic clamp and 4 mU/kg/min for the hypoglycemic clamp, diluted in 3% O.N. fasted mouse plasma) was infused through the right jugular venous catheter and euglycemia (85 mg/dL) or hypoglycemia (45 mg/dL) was maintained with adjustment of the infusion rate of a 20% glucose solution. Euglycemic clamp level was defined by the average fasting blood glucose of each genotype (15). For the euglycemic clamp, glucose was mixed with [3-3H]-glucose (PerkinElmer, Boston, MA) at 0.02 µCi/µL. A tracer equilibration period (t = −120 to 0 min) was used as follows: a 1.6 µCi bolus of [3-3H]-glucose was given at t = −120 min followed by a 0.04 µCi/min infusion for 2 h. Blood samples (50 µL) were taken via the left carotid arterial catheter at −120, −15, −5, 80, 90, 100, 110, 120, 122, 127, 135, 145, and 155 min for the assessment of glucose, [3-3H]-glucose specific activity, and plasma insulin. Red blood cells were recovered and injected via arterial catheter to prevent a hematocrit deficit. 10 µCi of [1-14C]-2 deoxy-d-glucose ([1-14C]2DG) (PerkinElmer) was injected at t = 120 min via venous catheter to assess glucose uptake. Following the clamp, mice were euthanized and tissues (gastrocnemius, soleus, tibialis anterior, liver, epididymal white adipose tissue [eWAT], and interscapular brown adipose [BAT]) were snap frozen in liquid nitrogen.
Biochemical Assays
Plasma glucose specific activity, glucose turnover rates (Rd) (mg/kg/min), [3-3H]-glucose infusion rate (dpm/kg/min), hepatic glucose production rates (Ra) (mg/kg/min), and tissue-specific [1-14C]2DG uptake (Rg) (µg glucose/mg tissue/min) were calculated as previously described (13). Clamp plasma glucose was measured from 10 µL deproteinized samples (Glucose Assay Kit; Abcam, Cambridge, MA). Tissue-specific [1-14C]2DG-6-phosphate content was determined with supernatant with the Somogyi method (16). Glycogen was assessed from [3-3H]-glucose incorporated into ethanol-precipitated glycogen in KOH-lysed tissues (13). Plasma insulin and glucagon were measured with a mouse insulin ELISA kit (Crystal Chem, Elk Grove Village, IL) and mouse glucagon ELISA kit (Mercodia, Winston Salem, NC), respectively. Plasma nonesterified fatty acids were measured with Free Fatty Acid Colorimetric Assay kit (BioVision, Milpitas, CA).
Primary Hepatocyte Isolation
Primary hepatocytes were prepared from anesthetized male mice as previously described (13,17). Cells were treated with vehicle, IUB288 (10 nmol/L), insulin (1 nmol/L), Glucagon (GCG) (10 nmol/L), GCG and insulin, or IUB288 and insulin. Cotreatments were conducted simultaneously and halted after 2.5 min via snap freezing in liquid nitrogen.
Immunoblot Analyses
Cell extracts were prepared in lysis buffer (20 mmol/L Tris, pH 6.8; 3.8 mmol/L dithiothreitol; 10% glycerol; 1% SDS; and Halt protease inhibitor cocktail [Thermo Fisher Scientific]), sonicated for 10 s on ice, and centrifuged for 15 min at 14,000 rpm 4°C. The 40 µg lysates were separated by 7.5% SDS-PAGE. Resolved fractions were transferred to polyvinylidene fluoride membranes (Bio-Rad Laboratories), and phosphorylation was detected with phospho-specific antibodies to AktSer473, AktThr308, GSK3α/βSer21/9, FoxO1/03Thr24/32, PRAS40Thr246, CREBSer133, and P70S6KThr389 [Cell Signaling Technology, Danvers, MA]) and IRS1Tyr612 (Thermo Fisher Scientific, Waltham, MA). Phosphorylation was normalized to anti-AKT, anti-IRS1, anti-GSK3, anti-CREB, anti-Rictor, anti-FoxO1, or anti-PRAS40 (Cell Signaling Technology). Immunoblots were labeled with goat anti-rabbit horseradish peroxidase–conjugated secondary antibodies and quantified with Clarity ECL, ChemDoc Imaging System, and Image Lab 5.0 software (Bio-Rad Laboratories).
Statistics
All data are represented as mean ± SEM. Statistical significance was determined with unpaired Student t tests or, where appropriate, one-, two-, or three-way ANOVA with multiple comparisons Tukey posttest. Statistics were completed with GraphPad Prism, version 9.2, for Macintosh (GraphPad Software, San Diego, CA), and significance was assigned when P < 0.05.
Data and Resource Availability
The data sets generated during the current study are available from the corresponding author on reasonable request.
Results
Acute GCGR Agonism Enhances Insulin Sensitivity in Hypoglycemic Mice
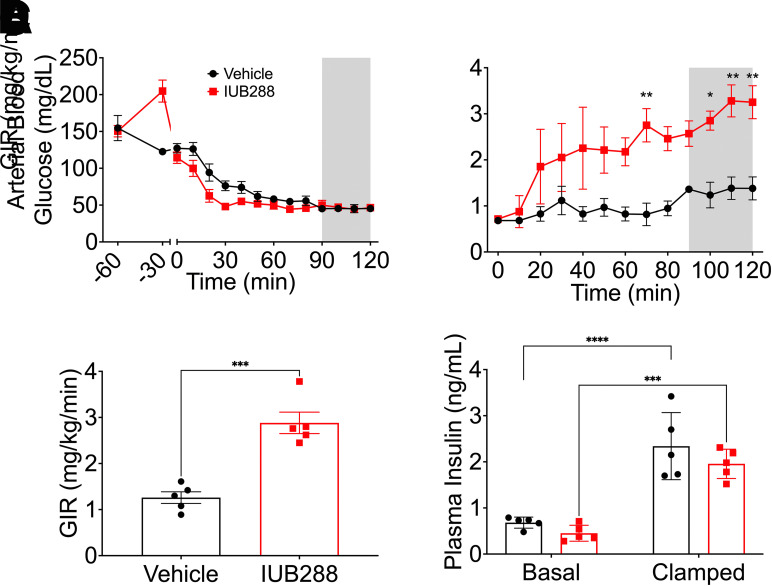
Glucagon is secreted from α-cells during hypoglycemia and likewise is used as a lifesaving drug against insulin-stimulated hypoglycemia. However, GCGR agonism during euglycemia enhances subsequent insulin-stimulated glucose disposal and suppression of hepatic glucose production (13). We performed hyperinsulinemic-hypoglycemic (HIHG) clamps in the presence or absence of a bolus IUB288 treatment to test GCGR-INSR cross talk during hypoglycemia (45 mg/dL glucose) (Fig. 1). IUB288 (10 nmol/kg s.c.) was administered 60 min prior to 4 mU/kg/min insulin infusion. IUB288-treated mice displayed early hyperglycemia (t = −30 to 0 min) (Fig. 1A) that was resolved prior to the introduction of insulin infusion.
Figure 1.
GCGR agonism enhances insulin sensitivity under hyperinsulinemic-hypoglycemic clamp. A: Arterial glycemia from −60 min to 120 min. GIR during insulin infusion period (B and C). Plasma insulin level under basal and clamped conditions (D). Shaded area of A and B used to calculate average clamped GIR. All data are represented as mean ± SEM (n = 5 mice/group) in adult C57Bl/6J mice. *P < 0.05, **P < 0.01, ***P < 0.001, ****P < 0.0001 vs. vehicle mice, using Student t test (C) or two-way ANOVA (A, B, D, and E).
Consistent with our findings in the euglycemic clamp (13), IUB288-treatment increased glucose infusion rate (GIR) during HIHG clamp as compared with vehicle-treated controls (Fig. 1B and C). Clamped plasma insulin (t = 120 min) was elevated three to fourfold over baseline (t = 0 min) (Fig. 1D). Importantly, the enhanced GIR observed in IUB288-treated mice was obtained under similar levels of circulating insulin (Fig. 1D). These data demonstrate that like euglycemia, GCGR agonism enhances whole-body insulin sensitivity during hypoglycemia.
Hepatic mTORC2 Regulates Glucose Homeostasis and Glucagon Sensitivity in Mice
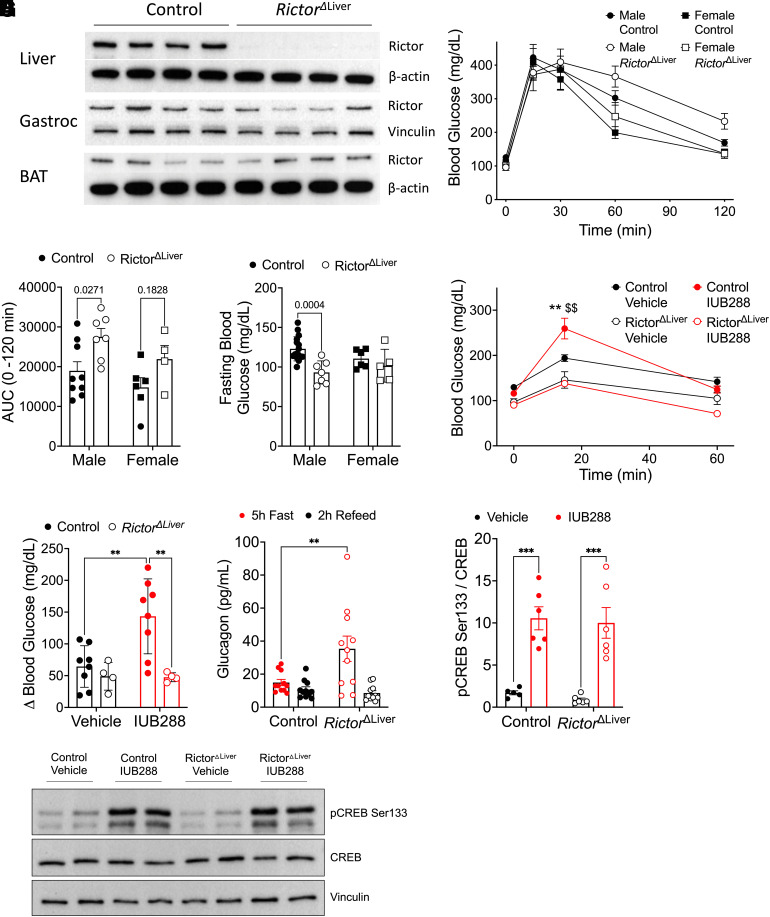
IUB288-enhanced, whole-body insulin sensitivity was associated with increased insulin-stimulated phosphorylation at AKTSer473 but not AKTThr308 (13). mTORC2 phosphorylates AKTSer473 (11), suggesting that mTORC2 may facilitate GCGR-INSR cross talk. The scaffolding protein RICTOR is essential for mTORC2 substrate targeting (9); thus, we used mice with hepatic Rictor deficiency (RictorΔLiver) to test the role of mTORC2 in GCGR-dependent potentiation of insulin sensitivity. Consistent with the findings of Lamming et al. (18), immunoblot analysis verified that both male (Fig. 2A) and female (data not shown) RictorΔLiver mice lack RICTOR in liver tissues, yet preserved expression in gastrocnemius and BAT.
Figure 2.
RictorΔLiver mice show glucose intolerance, lower blood glucose, and nonresponse to GCGR agonism. A: Western blot analysis of RICTOR (180 kDa) and β-actin or vinculin confirming liver-specific knockout. B: Blood glucose during GTT in male and female mice after 5-h fast. C: Area under the curve analysis of glucose excursion during GTT. D: Fasting blood glucose (5 h) in male and female mice. E: Blood glucose excursion during IUB288 challenge in male mice after 5 h fast. F: Change in blood glucose after vehicle or GCGR agonism challenge (t = 0–15 min) in male mice. G: Circulating glucagon in RictorΔLiver and littermate control mice after 5 h fast or 2 h (chow) refeed. H and I: Liver CREB phosphorylation in RictorΔLiver and littermate control mice 20 min after IUB288 challenge. All data are represented as mean ± SEM in 16-week-old mice with control mice represented by closed symbols and RictorΔLiver mice by open symbols (n = 4–7 mice/group). *P < 0.05, **P < 0.01 vs. genotype control, $$P < 0.01 vs. vehicle control, using two-way ANOVA (C, D, and F–H) or three-way ANOVA (B and E). B: Interaction of genotype and time (P < 0.01). AUC, area under the curve; Gastroc, gastrocnemius.
As previously reported (19), we observed glucose intolerance in male RictorΔLiver mice compared with their littermate controls (Fig. 2B and C). However, 5 h fasting blood glucose was surprisingly reduced in the male RictorΔLiver mice (Fig. 2D). Similar trends for glucose intolerance (P = 0.1828) and fasting glycemia (P = 0.1267) were observed in female RictorΔLiver mice (Fig. 2B–D). These data suggest that hepatic mTORC2 is important for insulin-stimulated glucose homeostasis and may also contribute to fasting glucose dynamics. To evaluate the role of hepatic mTORC2 in GCGR action, we administered a single injection of IUB288 (10 nmol/kg i.p.) and measured the resulting glucose excursion (Fig. 2E and F). In control mice, IUB288 stimulated a transient blood glucose elevation of ∼150 mg/dL (Fig. 2E and F). Consistent with their reduced fasting glycemia, RictorΔLiver mice exhibited a clear resistance to GCGR agonism compared with their littermate controls (Fig. 2E and F). Fasting plasma glucagon is elevated in RictorΔLiver mice (Fig. 2G), but these mice are still responsive to GCGR-stimulated phosphorylation of the cAMP-response element binding protein (CREB) (Fig. 2H and I). Together these data suggest that mTORC2 signaling is a component of both insulin- and glucagon-regulated glucose homeostasis.
Hepatic mTORC2 Contributes to Insulin Sensitivity in Mice
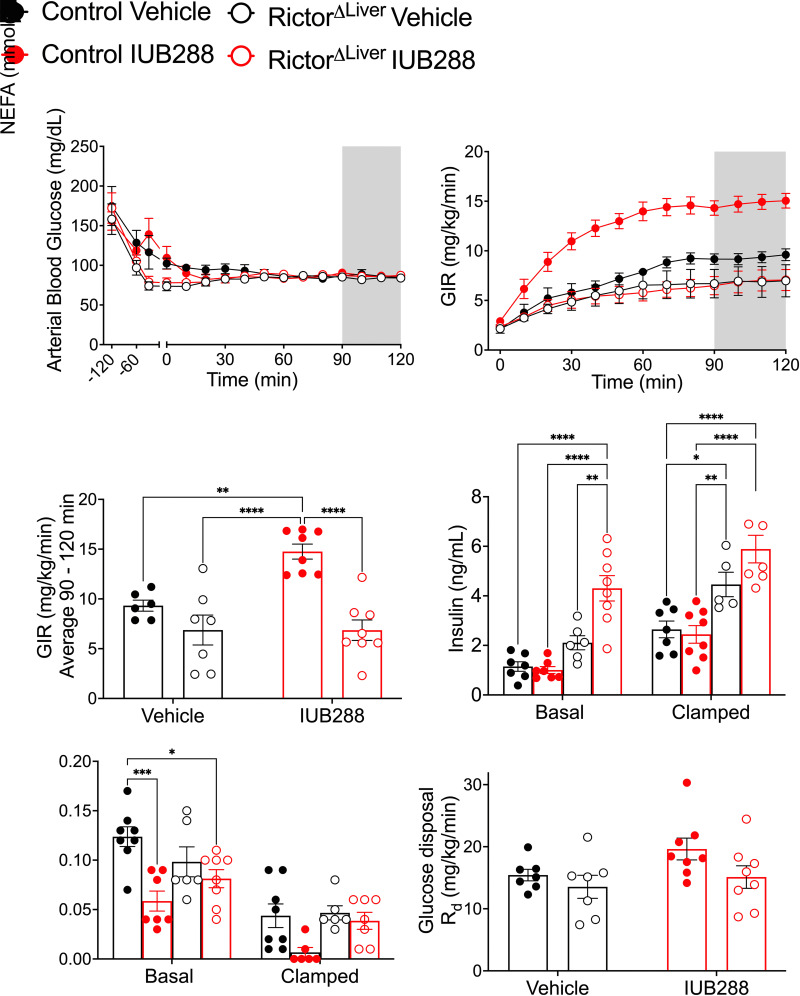
To test whether mTORC2 mediates GCGR-stimulated insulin action on glucose homeostasis, we performed hyperinsulinemic-euglycemic (HIEG) clamps in male RictorΔLiver mice and their littermate controls. Clamps (Fig. 3A–F) were conducted as previously described (13) using an infusion rate of 1.2 mU/kg/min to interrogate hepatic insulin sensitivity. Mice from each genotype were treated with either IUB288 or vehicle 60 min prior to insulin infusion (t = −60 min). IUB288-treated control mice displayed hyperglycemia (t = −45 min [Fig. 3A, closed red symbols], 15 min after injection t = −60) that was resolved prior to insulin infusion. Consistent with Figure 2, RictorΔLiver mice were resistant to IUB288-stimulated elevations in glycemia (Fig. 3A, open red symbols). Regardless of genotype or treatment, glycemia was clamped at ∼85 mg/dL (t = 90–120 min) (Fig. 3A). Consistent with our prior report (13), IUB288-treated control mice displayed a considerable increase in GIR (Fig. 3B and C). Vehicle-treated RictorΔLiver mice displayed a trend for reduced GIR (Fig. 3C) (P = 0.0810, Student t test) compared with that of vehicle-treated littermate controls. However, RictorΔLiver mice were completely resistant to IUB288-stimulated enhancements in whole-body insulin sensitivity (Fig. 3B and C). Together, these data place hepatic mTORC2 activity downstream of GCGR signaling and suggest that it is essential for GCGR-stimulated enhancement of insulin sensitivity.
Figure 3.
GCGR agonism enhances whole-body insulin sensitivity during euglycemic clamp. A: Time course of arterial blood glucose level from −120 min to 120 min. B: GIR during insulin infusion period. C: The average of GIR during steady state (shaded area of A and B) from 90 to 120 min. D: Plasma insulin level under basal and clamped conditions. E: Plasma NEFA under basal and clamped conditions. F: Glucose disposal rate (Rd). All data are represented as mean ± SEM in 20- to 24-week-old mice with control mice represented by closed symbols and RictorΔLiver mice by open symbols (n = 6–7 mice). *P < 0.05, **P < 0.01, ***P < 0.001, ****P < 0.0001, using two-way ANOVA (C and F) or three-way ANOVA (B, D, and E). B: Interaction of time, treatment, and genotype (P = 0.0003).
RictorΔLiver mice display fasting hyperinsulinemia (genotype effect, P < 0.0001 [three-way ANOVA]) (Fig. 3D). This hyperinsulinemia persisted during the clamp (t = 120 min), despite elevated insulin levels in all groups (clamp effect, P < 0.0001 [three-way ANOVA]) (Fig. 3D). Importantly, this hyperinsulinemia failed to increase GIR in RictorΔLiver mice compared with littermate controls, independent of GCGR agonism. Elevated insulin, absent of increased GIR, could be interpreted as insulin resistance and may reconcile the glucose intolerance in these mice with the GIR observed during clamp. Conversely, the enhanced GIR observed in IUB288-treated control mice was not attributable to differential levels of circulating insulin compared with the vehicle-treated controls (Fig. 3D). Plasma nonesterified fatty acids (NEFA) are reduced by insulin and provide a secondary confirmation of its action. In these samples, we observed a confirmatory suppression of NEFA in response to the hyperinsulinemic glucose clamp (clamp effect P < 0.0001 [three-way ANOVA]) (Fig. 3E). IUB288 treatment stimulated a significant NEFA reduction in control mice at both basal and clamped time points, which was not replicated in the RictorΔLiver mice. Glucose disposal (Rd) during the clamped period was similar in all groups; however, we observed a trend (P = 0.0642, Student t test) for increased Rd in IUB288-treated control mice compared with vehicle-treated controls (Fig. 3F). Collectively, these data support that RictorΔLiver mice display trends for reduced insulin sensitivity compared with littermate controls during the (1.2 mU/kg/min insulin) HIEG clamp protocol. However, RictorΔLiver mice are resistant to IUB288-stimulated enhancements in whole-body insulin sensitivity even under hyperinsulinemic conditions.
Hepatic mTORC2 Contributes to Tissue-Specific Glucose Metabolism in Mice
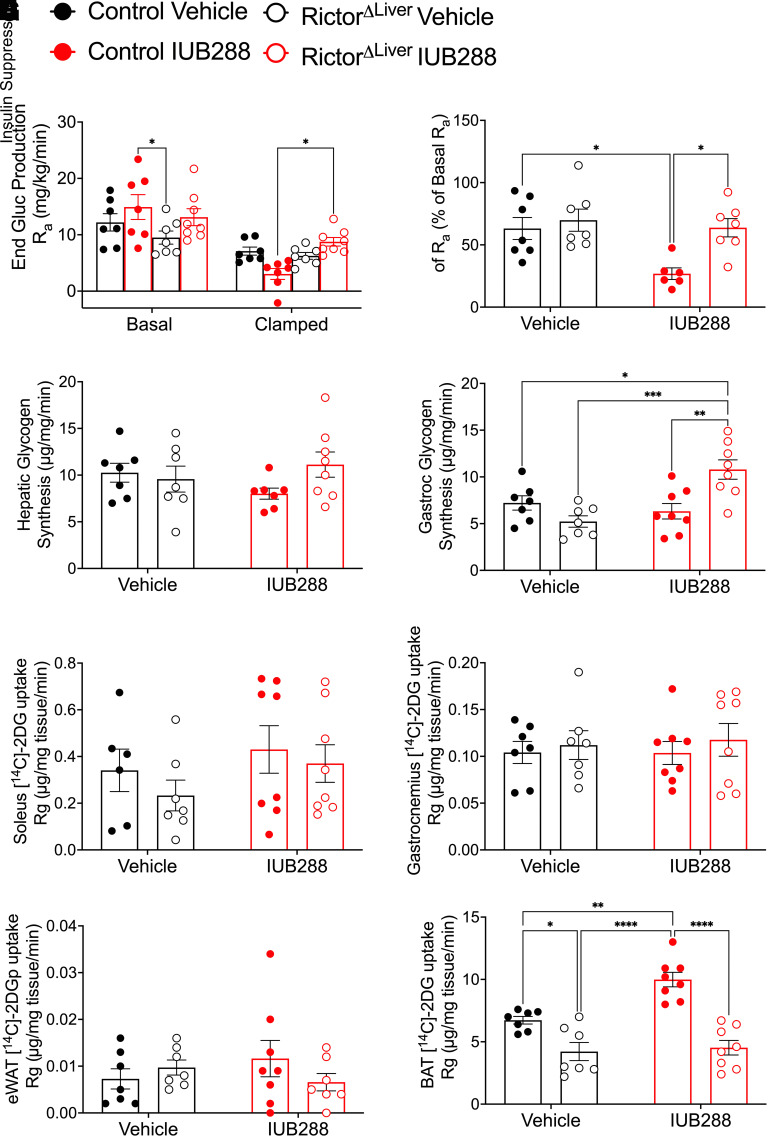
We incorporated continuous d-[3-3H]-glucose infusion to interrogate hepatic glucose metabolism in RictorΔLiver and control mice. Consistently, clamp conditions suppressed endogenous glucose production (Ra) (clamp effect P < 0.0001, two-way ANOVA) (Fig. 4A) in all groups. From this result, we calculated the insulin-stimulated suppression of Ra (% change from basal), the primary measure for hepatic insulin sensitivity (Fig. 4B). This analysis uncovered enhanced hepatic insulin sensitivity in IUB288-treated compared with vehicle-treated control mice (Fig. 4B). RictorΔLiver mice displayed similar hepatic insulin sensitivity (i.e., % suppression) compared with vehicle-treated control mice (Fig. 4B). However, as observed in GIR, RictorΔLiver mice were resistant to IUB288-stimulated enhancement of hepatic insulin sensitivity (Fig. 4B). In addition to Ra suppression, IUB288-treated control mice displayed a trend for reduced hepatic glycogen synthesis (P = 0.0801, Student t test) (Fig. 4C). No change in glycogen synthesis was observed in RictorΔLiver mice (Fig. 4C). Consistent with our prior report (13), skeletal muscle (i.e., gastrocnemius) glycogen synthesis was unchanged by IUB288 in control mice (Fig. 4D). However, we observed an unexpected increase in muscle glycogen synthesis in IUB288-treated RictorΔLiver mice compared with all other groups (Fig. 4D).
Figure 4.
GCGR agonism enhances insulin-stimulated hepatic glucose production during euglycemic-clamp. A: Endogenous glucose (End Gluc) production rate (Ra). B: Insulin-stimulated percent change of Ra. C and D: Glycogen synthesis rate in the liver (C) and gastrocnemius (D). E–H: [1-14C]2DG uptake rate into soleus (E), gastrocnemius (F), eWAT (G), and BAT (H). All data are represented as mean ± SEM with control mice represented by closed symbols and RictorΔLiver mice by open symbols (n = 6–7 mice). *P < 0.05, **P < 0.01, ***P < 0.001, ****P < 0.0001 using two-way ANOVA (B–G) or three-way ANOVA (A).
We included a [1-14C]2DG bolus during the last 30 min of the HIEG clamp to assess tissue-specific glucose uptake. [1-14C]2DG uptake in soleus, gastrocnemius, and eWAT was similar across all genotypes and treatments (Fig. 4E–G). However, [1-14C]2DG uptake into BAT was preferentially elevated in IUB288-treated controls as compared with all other groups (Fig. 4H). Thus, GCGR agonism appears to enhance whole-body glucose metabolism in an mTORC2-dependent manner via insulin-stimulated Ra suppression and BAT glucose uptake.
Hepatic mTORC2 Contributes to Glucagon Receptor and Insulin Receptor Signaling Interactions During HIEG Clamp
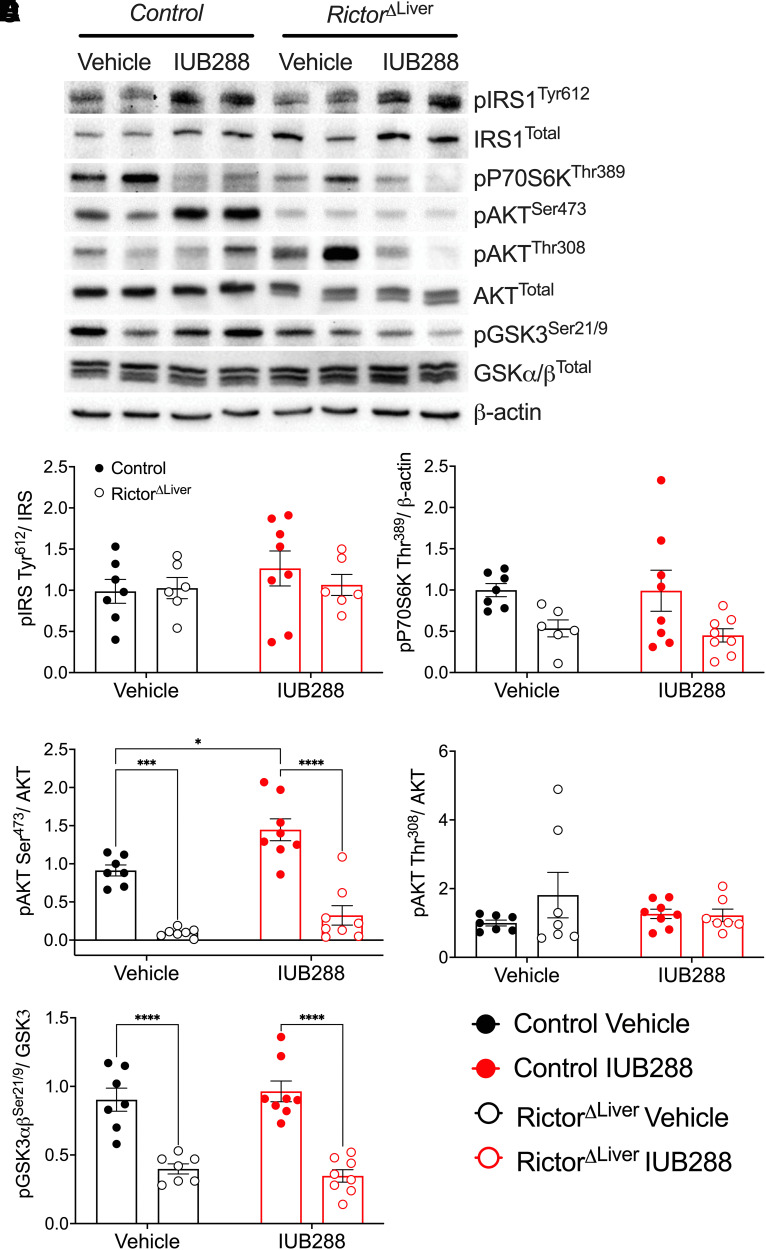
To test the role of mTORC2 in GCGR-INSR signaling cross talk, we interrogated INSR signaling pathways in liver tissues after HIEG clamp (i.e., 2 h of 1.2 mU/kg/min insulin). Phosphorylation of the insulin receptor substrate 1 (IRS1) in these samples was similar across all groups, regardless of treatment or genotype (Fig. 5A and B). In RictorΔLiver mice a subtle but significant reduction was observed in phosphorylation of ribosomal protein S6 kinase β-1 (P70S6K), classically considered a target of the mTORC1 complex (Fig. 5A and C). This observation suggests a potential compensatory effect in mTORC2 deficiency. IUB288 treatment had no effect on P70S6K phosphorylation, regardless of genotype (Fig. 5A and C). Consistent with our prior report (13), IUB288 treatment in control mice increased liver AKTSer473 but not AKTThr308 phosphorylation (Fig. 5A, D, and E). RictorΔLiver mice exhibited a considerable reduction in total AKT and AKTSer473 but not AKTThr308 phosphorylation (Fig. 5A, D, and E). Importantly, RictorΔLiver mice were unresponsive to IUB288-stimulated enhancement in AKTSer473 phosphorylation (Fig. 5A, D, and E). Similar trends were also observed in the AKT target, glycogen synthase kinase 3 (GSK3) (Fig. 5A and F). Together, these data support that GCGR signaling potentiates INSR signaling via the mTORC2 complex.
Figure 5.
The phosphorylation of AKTSer473 is abolished in the liver of RictorΔLiver mice. A: Representative images of Western blot analysis for insulin signaling. B–F: Quantitative data of pIRS1Tyr612/IRS1 (B), pP70S6KThr421/β-actin (C), pAKTSer473/AKT (D), pAKTThr308/AKT (E), and pGSK3α/βSer21/9/GSK3 (F). All data are represented as mean ± SEM with control mice represented by closed symbols and RictorΔLiver mice by open symbols. *P < 0.05, ***P < 0.001, ****P < 0.0001, using two-way ANOVA. C: Main effect of genotype (P = 0.0037).
Hepatic mTORC2 Contributes to Cell-Autonomous GCGR-Mediated Improvements in Insulin Signaling
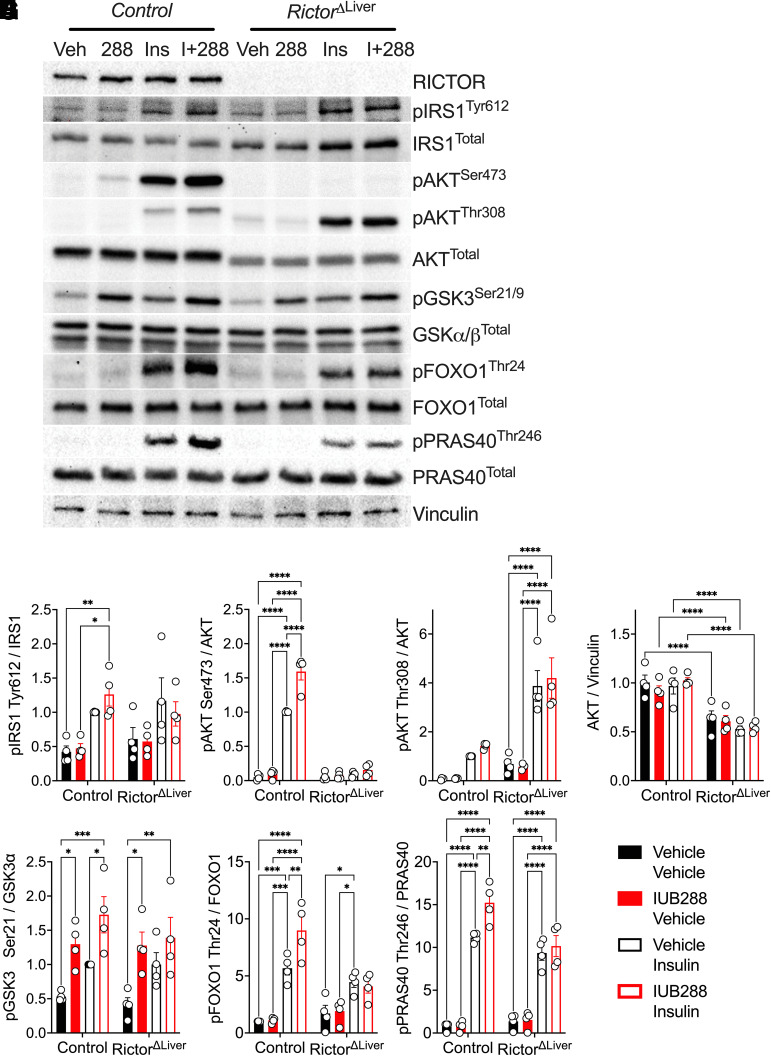
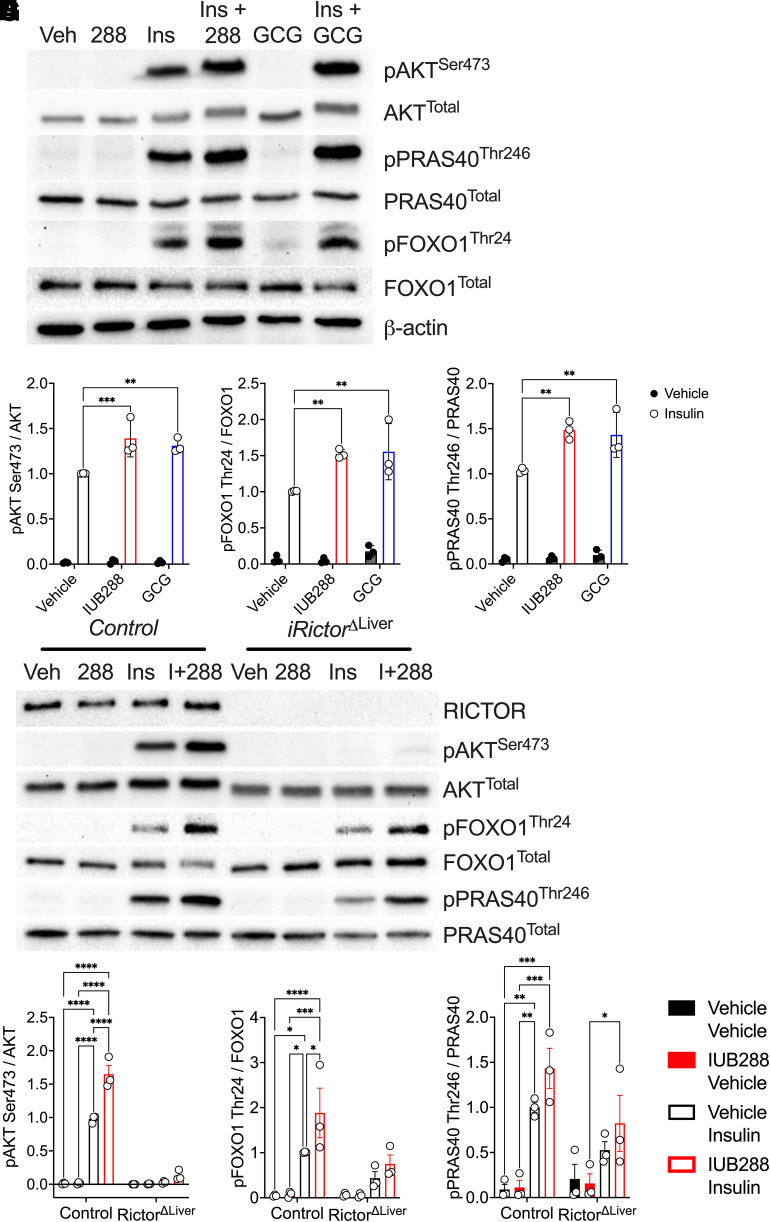
GCGR agonists enhance whole-body insulin action via potentiation of hepatocyte insulin signaling (13). To dissect the necessity of hepatocyte mTORC2 in this signaling cross talk, we interrogated GCGR and INSR signaling in primary hepatocytes isolated from RictorΔLiver and littermate control mice. Consistent with in vivo liver samples (Fig. 2), RICTOR was expressed in hepatocytes from control mice but predictably ablated in those isolated from RictorΔLiver mice (Fig. 6A). IRS1 phosphorylation was stimulated by insulin, but not further augmented by GCGR agonism, in hepatocytes from control and RictorΔLiver mice (Fig. 6A and B). Consistent with our earlier report (13), IUB288 treatment increased insulin-stimulated AKTSer473 but not AKTThr308 phosphorylation in control hepatocytes (Fig. 6A, C, and D). Insulin-stimulated AKTSer473 phosphorylation was nearly absent in hepatocytes from RictorΔLiver mice, regardless of IUB288 treatment (Fig. 6A and C). This was coupled with a decrease of ∼50% in total AKT (Fig. 6A and E). Similar regulation of insulin-stimulated phosphorylation was also observed in the AKT target, GSK3 (Fig. 6A and F). However, IUB288 was sufficient to stimulate its phosphorylation in the absence of insulin and mTORC2 (Fig. 6A and F), suggesting redundancy in GCGR signaling to this target. Two additional AKT targets, FOXO1Thr24 and PRAS40Thr246, displayed enhanced phosphorylation in combined IUB288 and insulin treatment that was ablated in the absence of RICTOR (Fig. 6G and H). Consistent signaling was observed in response to the native GCG peptide (Fig. 7A–D). Conversely, phosphorylation of the mTORC2 target PKCαThr638/641 was not regulated in response to insulin or IUB288 at this time or dose.
Figure 6.
The phosphorylation of AKTSer473 is mTORC2 dependent and cell autonomous. Representative images of Western blot analysis for insulin signaling in primary hepatocytes isolated from control and RictorΔLiver mice (A). Quantitative data of pIRS1Tyr612/IRS1 (B), pAKTSer473/AKT (C), pAKTThr308/AKT (D), AKTtotal (E), pGSK3α/βSer21/9/GSK3 (F), pFOXO1Thr24/FOXO1 (G), and pPRAS40Thr246/PRAS40 (H). All data are represented as mean ± SEM in 6- to 8-week-old mice. *P < 0.05, **P < 0.01, ***P < 0.001, and ****P < 0.0001, using two-way ANOVA. Veh, vehicle.
Figure 7.
AKT Ser473 phosphorylation is conserved with native glucagon and in adult inducible Rictor deficiency. Representative images of Western blot analysis for insulin signaling in primary hepatocytes isolated from control (A and E) and iRictorΔLiver mice (E). Quantitative data of pAKTSer473/AKT (B), pFOXO1Thr24/FOXO1 (C), and pPRAS40Thr246/PRAS40 (D) in response to IUB288 (I+288) or glucagon (GCG). Quantitative data of RICTOR (E), pAKTSer473/AKT (F), pFOXO1Thr24/FOXO1 (G), and pPRAS40Thr246/PRAS40 (H) in response to IUB288 in hepatocytes of adult inducible iRictorΔLiver mice. All data are represented as means ± SEM in 15- to 17-week-old mice. *P < 0.05, **P < 0.01, ***P < 0.001, and ****P < 0.0001, using two-way ANOVA. Veh, vehicle.
To ensure that the observed signaling changes were not dependent on compensatory effects secondary to developmental Rictor knockout, we confirmed phosphorylation of AKTSer473, FOXO1Thr24, and PRAS40Thr246 in hepatocytes from mice with inducible hepatic Rictor deficiency (iRictorΔLiver mice) (Fig. 7E–H). Collectively, these data support that acutely, hepatic GCGR signaling potentiates INSR signaling via the mTORC2 complex in a cell-autonomous manner.
Discussion
Results presented here identify mTORC2 as a novel mechanism for GCGR-dependent enhancement of insulin sensitivity. These data are supported by our prior report (13) and provide mechanistic insight into the cross talk between these two signaling pathways. It was previously assumed that glucagon opposes all of insulin’s actions, but emerging observations suggest that the physiological context of GCGR stimulation may profoundly influence its action, especially as it integrates with insulin (13,20). Our findings are consistent with the hypothesis that acute GCGR agonism enhances insulin action during both hypo- and euglycemic conditions and suggest that hepatic mTORC2 signaling is necessary for this action. An important caveat of these studies lies in our choice of agonist. IUB288 is a potent, long-acting, selective GCGR agonist (12). This peptide has been characterized in multiple studies and stimulates similar physiology as compared with the native GCG peptide (12,13,17,21,22). However, in each additional study, there is always the possibility that its extended bioavailability or off-target effects are contributing to the observed physiology. This is especially true of effects induced by chronic treatment where the long-acting pharmacodynamics of IUB288 may be additive. The current data confirm mTORC2-dependent signaling with both IUB288 and native GCG, observations that are consistent with our prior report (13). These observations suggest that acute IUB288-stimulated biology is representative of the endogenous hormone. They are likewise consistent with the hypothesis that while chronic GCGR activation impairs glucose tolerance, acute agonism synergistically enhances insulin action.
In this study we used various glucose clamp conditions to expand our understanding of GCGR signaling in insulin action. In our previous report, we infused somatostatin with insulin to suppress endogenous insulin and glucagon secretion under euglycemic (i.e., 150 mg/dL) clamp conditions. In the current report, we show that IUB288 increased GIR under hypoglycemic-hyperinsulinemic (i.e., 45 mg/dL) clamp conditions, where the counterregulatory neuro-adrenergic response is intensified. Glucagon has long been used as a rescue therapy to reverse insulin-stimulated hypoglycemia; thus, the insulin-enhancing effect of GCGR agonism was unexpected. While these hypoglycemic conditions may initially appear similar, one should consider the constant insulin infusion associated with the clamp. Subsequent HIEG clamps at 85 mg/dL (Fig. 3) confirmed IUB288-dependent increases in GIR. Thus, we interpret the combined findings to suggest that GCGR agonism enhances insulin sensitivity when insulin is present, regardless of the current glycemic load.
mTORC2 is widely expressed and is a crucial regulator of insulin signaling, circadian rhythms, and whole-body metabolism (23–25). This complex is composed of seven proteins including mTOR, the active kinase unit, and RICTOR, a scaffolding protein that dictates substrate binding (26) including AKTSer473 (11). As GCGR agonism potentiates insulin-stimulated phosphorylation of AKTSer473 (13), we generated mice with hepatic Rictor deficiency (RictorΔLiver) to test for the necessity of mTORC2 in GCGR-potentiated insulin action. RictorΔLiver mice are characterized by glucose intolerance, hyperinsulinemia, reduced hepatic glycogen ([3-3H]-glucose incorporation in overnight fasted mice [data not shown here]), and a lack of AKTSer473 phosphorylation. Although not specifically tested, the reduced hepatic glycogen may explain their resistance to IUB288-increased blood glucose. Unlike Hagiwara et al. (27), who reported fasting hyperglycemia, we observed subtle fasting hypoglycemia in male RictorΔLiver mice (Figs. 2D and 3A). Considering the similar strain and diet used in these studies, it is most likely that an age-associated mechanism is responsible for the observed differences.
We used the hyperinsulinemic-euglycemic clamp to investigate the role of mTORC2 signaling in the GCGR-dependent enhancement of insulin sensitivity. Consistent with their subtle glucose intolerance, RictorΔLiver mice displayed a trend for reduced GIR at steady state (t = 90–120 min). It should be noted that our clamp conditions included a 5 h fast, mild insulin infusion rate, and relatively low euglycemia (i.e., 1.2 mU kg/min and 85 mg/dL, respectively). Prior HIEG clamps were reported for the RictorΔLiver mice after an overnight fast, but circulating insulin and glucose levels were not reported (28). Thus, differences in protocols may account for the relative differences observed between the studies (28). Although these observed differences are interesting, the RictorΔLiver mice in our studies were used as a tool to investigate the mechanisms regulating GCGR and INSR cross talk.
GCGR agonism potentiates whole-body and hepatic insulin sensitivity. Intriguingly, this effect was completely abolished in RictorΔLiver mice, providing strong evidence for the mTORC2 kinase complex as a crucial node linking GCGR and INSR signaling. Furthermore, this observation allows us to reconcile the complicated glucose homeostasis observed in the RictorΔLiver mice. Specifically, mTORC2 appears to regulate both GCGR-dependent (i.e., fasting hypoglycemia and IUB288 resistance) and INSR-dependent (i.e., glucose tolerance) regulation.
mTOR is phosphorylated on two serine residues (Ser2448 and Ser2481) within its negative regulatory domain. Phosphorylation of mTORSer2448 has been associated with kinase activity, although this is somewhat controversial (29). Phosphorylation of mTORSer2481 is a marker of an intact mTORC2 complex (30). Both mTOR sites are phosphorylated in response to insulin, but not further modified by IUB288 treatment in control hepatocytes (data not shown). Instead, our findings are consistent with our prior observations of enhanced AKTSer473 phosphorylation and activity (13). PKCα phosphorylation (Thr638/641) is a target of mTORC2 and results in inhibition of both GCGR (at Gs) (31) and liver insulin signaling via phosphorylation of IRS (32). Moreover, PKCα is reduced in models of Rictor deficiency (33). However, we found no regulation (at the tested time and dose) in response to insulin or IUB288. Thus, further experimentation will be needed to identify the signaling nodes between GCGR and mTORC2. Lastly, our approach uses pharmacological GCGR agonism (i.e., IUB288) as a tool to interrogate GCGR and INSR cross talk. Therefore, it is possible that a portion of the considerable enhancements in glucose homeostasis may be influenced by the potency or pharmacodynamics of IUB288.
These current findings add to the growing appreciation of GCGR-dependent physiology. These results also provide deeper mechanistic understanding of the paradoxical glycemic benefits observed with use of GCGR-based coagonists agonism (3,4,34,35) and in patients using a wearable, bihormonal (GCG and insulin) bionic pancreas (36). In sum, these data suggest that GCGR agonism acts via the mTORC2 kinase complex to enhance hepatic insulin stimulated AKTSer473 phosphorylation and activity and thereby potentiates whole-body and hepatic insulin sensitivity.
Article Information
Funding. The project described was supported by National Institutes of Health grants 1R01DK112934 (to K.M.H.) and P30DK079626.
Duality of Interest. No potential conflicts of interest relevant to this article were reported.
Author Contributions. T.K. and K.M.H. were responsible for study conception and design, data analyses and interpretation, and drafting the manuscript. T.K., S.N., and J.A. generated experimental data. B.F., A.S., and R.D. advised regarding the study concept and critical revision of the article. K.M.H. is the guarantor of this work and, as such, had full access to all the data in the study and takes responsibility for the integrity of the data and the accuracy of the data analysis.
Prior Presentation. Parts of this study were presented in abstract form at the 82nd Scientific Sessions of the American Diabetes Association, New Orleans, Louisiana, 3–7 June 2022.
References
- 1. Habegger KM, Heppner KM, Geary N, Bartness TJ, DiMarchi R, Tschöp MH. The metabolic actions of glucagon revisited. Nat Rev Endocrinol 2010;6:689–697 [DOI] [PMC free article] [PubMed] [Google Scholar]
- 2. Müller TD, Finan B, Clemmensen C, DiMarchi RD, Tschöp MH. The new biology and pharmacology of glucagon. Physiol Rev 2017;97:721–766 [DOI] [PubMed] [Google Scholar]
- 3. Day JW, Ottaway N, Patterson JT, et al. A new glucagon and GLP-1 co-agonist eliminates obesity in rodents. Nat Chem Biol 2009;5:749–757 [DOI] [PubMed] [Google Scholar]
- 4. Finan B, Yang B, Ottaway N, et al. A rationally designed monomeric peptide triagonist corrects obesity and diabetes in rodents. Nat Med 2015;21:27–36 [DOI] [PubMed] [Google Scholar]
- 5. Ambery PD, Klammt S, Posch MG, et al. MEDI0382, a GLP-1/glucagon receptor dual agonist, meets safety and tolerability endpoints in a single-dose, healthy-subject, randomized, Phase 1 study. Br J Clin Pharmacol 2018;84:2325–2335 [DOI] [PMC free article] [PubMed] [Google Scholar]
- 6. Ali MM, Hafez A, Abdelgalil MS, et al. Impact of Cotadutide drug on patients with type 2 diabetes mellitus: a systematic review and meta-analysis. BMC Endocr Disord 2022;22:113. [DOI] [PMC free article] [PubMed] [Google Scholar]
- 7. Parker VER, Hoang T, Schlichthaar H, et al. Efficacy and safety of cotadutide, a dual glucagon-like peptide-1 and glucagon receptor agonist, in a randomized phase 2a study of patients with type 2 diabetes and chronic kidney disease. Diabetes Obes Metab 2022;24:1360–1369 [DOI] [PMC free article] [PubMed] [Google Scholar]
- 8. Sabatini DM. Twenty-five years of mTOR: Uncovering the link from nutrients to growth. Proc Natl Acad Sci USA 2017;114:11818–11825 [DOI] [PMC free article] [PubMed] [Google Scholar]
- 9. Liu GY, Sabatini DM. mTOR at the nexus of nutrition, growth, ageing and disease. Nat Rev Mol Cell Biol 2020;21:183–203 [DOI] [PMC free article] [PubMed] [Google Scholar]
- 10. Cho H, Mu J, Kim JK, et al. Insulin resistance and a diabetes mellitus-like syndrome in mice lacking the protein kinase Akt2 (PKB beta). Science 2001;292:1728–1731 [DOI] [PubMed] [Google Scholar]
- 11. Sarbassov DD, Guertin DA, Ali SM, Sabatini DM. Phosphorylation and regulation of Akt/PKB by the rictor-mTOR complex. Science 2005;307:1098–1101 [DOI] [PubMed] [Google Scholar]
- 12. Habegger KM, Stemmer K, Cheng C, et al. Fibroblast growth factor 21 mediates specific glucagon actions. Diabetes 2013;62:1453–1463 [DOI] [PMC free article] [PubMed] [Google Scholar]
- 13. Kim T, Holleman CL, Nason S, et al. Hepatic glucagon receptor signaling enhances insulin-stimulated glucose disposal in rodents. Diabetes 2018;67:2157–2166 [DOI] [PMC free article] [PubMed] [Google Scholar]
- 14. Kim T, He L, Johnson MS, et al. Carnitine palmitoyltransferase 1b deficiency protects mice from diet-induced insulin resistance. J Diabetes Metab 2014;5:361. [DOI] [PMC free article] [PubMed] [Google Scholar]
- 15. Alquier T, Poitout V. Considerations and guidelines for mouse metabolic phenotyping in diabetes research. Diabetologia 2018;61:526–538 [DOI] [PMC free article] [PubMed] [Google Scholar]
- 16. Mészáros K, Lang CH, Bagby GJ, Spitzer JJ. Contribution of different organs to increased glucose consumption after endotoxin administration. J Biol Chem 1987;262:10965–10970 [PubMed] [Google Scholar]
- 17. Nason SR, Kim T, Antipenko JP, et al. Glucagon-receptor signaling reverses hepatic steatosis independent of leptin receptor expression. Endocrinology 2020;161:bqz013. [DOI] [PMC free article] [PubMed] [Google Scholar]
- 18. Lamming DW, Demirkan G, Boylan JM, et al. Hepatic signaling by the mechanistic target of rapamycin complex 2 (mTORC2). FASEB J 2014;28:300–315 [DOI] [PMC free article] [PubMed] [Google Scholar]
- 19. Lamming DW, Ye L, Katajisto P, et al. Rapamycin-induced insulin resistance is mediated by mTORC2 loss and uncoupled from longevity. Science 2012;335:1638–1643 [DOI] [PMC free article] [PubMed] [Google Scholar]
- 20. Besse-Patin A, Jeromson S, Levesque-Damphousse P, Secco B, Laplante M, Estall JL. PGC1A regulates the IRS1:IRS2 ratio during fasting to influence hepatic metabolism downstream of insulin. Proc Natl Acad Sci USA 2019;116:4285–4290 [DOI] [PMC free article] [PubMed] [Google Scholar]
- 21. Kim T, Nason S, Holleman C, et al. Glucagon receptor signaling regulates energy metabolism via hepatic farnesoid X receptor and fibroblast growth factor 21. Diabetes 2018;67:1773–1782 [DOI] [PMC free article] [PubMed] [Google Scholar]
- 22. Nason SR, Antipenko J, Presedo N, et al. Glucagon receptor signaling regulates weight loss via central KLB receptor complexes. JCI Insight 2021;6:e141323. [DOI] [PMC free article] [PubMed] [Google Scholar]
- 23. Ramanathan C, Kathale ND, Liu D, et al. mTOR signaling regulates central and peripheral circadian clock function. PLoS Genet 2018;14:e1007369. [DOI] [PMC free article] [PubMed] [Google Scholar]
- 24. Entwisle SW, Martinez Calejman C, Valente AS, et al. Proteome and phosphoproteome analysis of brown adipocytes reveals that RICTOR loss dampens global insulin/AKT signaling. Mol Cell Proteomics 2020;19:1104–1119 [DOI] [PMC free article] [PubMed] [Google Scholar]
- 25. Tang Y, Wallace M, Sanchez-Gurmaches J, et al. Adipose tissue mTORC2 regulates ChREBP-driven de novo lipogenesis and hepatic glucose metabolism. Nat Commun 2016;7:11365. [DOI] [PMC free article] [PubMed] [Google Scholar]
- 26. Sarbassov DD, Ali SM, Kim DH, et al. Rictor, a novel binding partner of mTOR, defines a rapamycin-insensitive and raptor-independent pathway that regulates the cytoskeleton. Curr Biol 2004;14:1296–1302 [DOI] [PubMed] [Google Scholar]
- 27. Hagiwara A, Cornu M, Cybulski N, et al. Hepatic mTORC2 activates glycolysis and lipogenesis through Akt, glucokinase, and SREBP1c. Cell Metab 2012;15:725–738 [DOI] [PubMed] [Google Scholar]
- 28. Yuan M, Pino E, Wu L, Kacergis M, Soukas AA. Identification of Akt-independent regulation of hepatic lipogenesis by mammalian target of rapamycin (mTOR) complex 2. J Biol Chem 2012;287:29579–29588 [DOI] [PMC free article] [PubMed] [Google Scholar]
- 29. Figueiredo VC, Markworth JF, Cameron-Smith D. Considerations on mTOR regulation at serine 2448: implications for muscle metabolism studies. Cell Mol Life Sci 2017;74:2537–2545 [DOI] [PMC free article] [PubMed] [Google Scholar]
- 30. Copp J, Manning G, Hunter T. TORC-specific phosphorylation of mammalian target of rapamycin (mTOR): phospho-Ser2481 is a marker for intact mTOR signaling complex 2. Cancer Res 2009;69:1821–1827 [DOI] [PMC free article] [PubMed] [Google Scholar]
- 31. Ikegami T, Krilov L, Meng J, Patel B, Chapin-Kennedy K, Bouscarel B. Decreased glucagon responsiveness by bile acids: a role for protein kinase Calpha and glucagon receptor phosphorylation. Endocrinology 2006;147:5294–5302 [DOI] [PubMed] [Google Scholar]
- 32. Schmitz-Peiffer C, Biden TJ. Protein kinase C function in muscle, liver, and beta-cells and its therapeutic implications for type 2 diabetes. Diabetes 2008;57:1774–1783 [DOI] [PMC free article] [PubMed] [Google Scholar]
- 33. Ikenoue T, Inoki K, Yang Q, Zhou X, Guan KL. Essential function of TORC2 in PKC and Akt turn motif phosphorylation, maturation and signalling. EMBO J 2008;27:1919–1931 [DOI] [PMC free article] [PubMed] [Google Scholar]
- 34. Clemmensen C, Chabenne J, Finan B, et al. GLP-1/glucagon coagonism restores leptin responsiveness in obese mice chronically maintained on an obesogenic diet. Diabetes 2014;63:1422–1427 [DOI] [PubMed] [Google Scholar]
- 35. Tan TM, Field BC, McCullough KA, et al. Coadministration of glucagon-like peptide-1 during glucagon infusion in humans results in increased energy expenditure and amelioration of hyperglycemia. Diabetes 2013;62:1131–1138 [DOI] [PMC free article] [PubMed] [Google Scholar]
- 36. Russell SJ, El-Khatib FH, Sinha M, et al. Outpatient glycemic control with a bionic pancreas in type 1 diabetes. N Engl J Med 2014;371:313–325 [DOI] [PMC free article] [PubMed] [Google Scholar]


