Abstract
Protein-protein interactions and protein modifications play central roles in all living organisms. Of the more than 200 types of post-translational modifications, ubiquitylation is the most abundant, and it profoundly regulates the functionality of the eukaryotic proteome. Various in vitro and in vivo methodologies to study protein interactions and modifications have been developed, each presenting distinctive benefits and caveats. Here, we present a comprehensive protocol for applying a split-Chloramphenicol Acetyl-Transferase (split-CAT) based system, to study protein-protein interactions and ubiquitylation in E. coli . Functional assembly of bait and prey proteins tethered to the split-CAT fragments result in antibiotic resistance and growth on selective media. We demonstrate assays for protein interactions, protein ubiquitylation, and the system response to small compound modulators. To facilitate data collection, we provide an updated Scanner Acquisition Manager Program for Laboratory Experiments (SAMPLE; https://github.com/PragLab/SAMPLE ) that can be employed to monitor the growth of various microorganisms, including E. coli and S. cerevisiae . The advantage posed by this system lies in its sensitivity to a wide range of chloramphenicol concentrations, which allows the detection of a large spectrum of protein-protein interactions, without the need for their purification. The tight linkage between binding or ubiquitylation and growth enables the estimation of apparent relative affinity, and represents the system’s quantitative characteristics.
Graphical abstract:
Keywords: Chloramphenicol Acetyl Transferase , Bacterial two hybrid , Protein-protein interaction , Ubiquitylation readout , Self-ubiquitylation , Ubiquitin E3-ligase
Background
Most cellular processes are carried out and controlled by protein-protein interactions (PPIs) and post-translation protein modifications (PTMs). Therefore, detecting PPIs and PPI-dependent PTMs is critical for understanding normal and pathological conditions, and for potential therapeutic development. Indeed, many methodologies have been developed for identification and characterization of PPIs and PTMs. Each of these methods has its own benefits and caveats. In the 1980s, phage display and genetic yeast two-hybrid systems were developed to study PPIs ( Smith, 1985 ; Fields and Song, 1989 ; Bair et al., 2008). These methods allowed, for the first time, a high-throughput screening of a large repertoire of proteins or peptides. A great benefit of these methods is the linkage to the DNA sequence encoding the identified polypeptide. However, in the phage display systems, proteins interact in the extra-cellular environment, a process that leads to many false positive interactions, due to misfolding. In contrast, complementation of the split-Gal4 transcription factor in the yeast nucleus is required to activate the reporter, and consequently limits the positive readouts of the screen. Cleverly, Stagljar and co-workers circumvented this with a split-ubiquitin system [a system previously developed by Johnsson and Varshavsky ( Johnsson et al., 1994 )], in which the interaction of membrane proteins induces a proteolytic cleavage that releases a fused nuclear transcription factor, activating reporter genes in the nucleus ( Stagljar et al., 1998 ). Additionally, Michnick and co-workers developed two excellent Protein-fragment Complementation Assays (PCA) based on split dihydrofolate reductase (DHFR) and split-TEM-1 (β-lactamase) enzymes ( Pelletier et al., 1998 ; Galarneau et al., 2002 ). The split-DHFR system provides growth phenotypic readouts, both in bacteria and yeast. However, seeding of fairly low cell concentrations is required to prevent non-specific growth (Levin-Kravets et al., 2021). Split-reporters that provide fluorescence or luminescence are widely used to detect PPIs. Forster resonance energy transfer by fluorescence lifetime imaging (FRET-FLIM) and bimolecular fluorescence complementation (BiFC) are useful in live cell imaging ( Majoul et al., 2002 ; Walter et al., 2004 ). The advantage of this approach is the information regarding the cellular localization of the PPIs. Nevertheless, these methods require sophisticated microscopy equipment, which can frequently be a limiting factor.
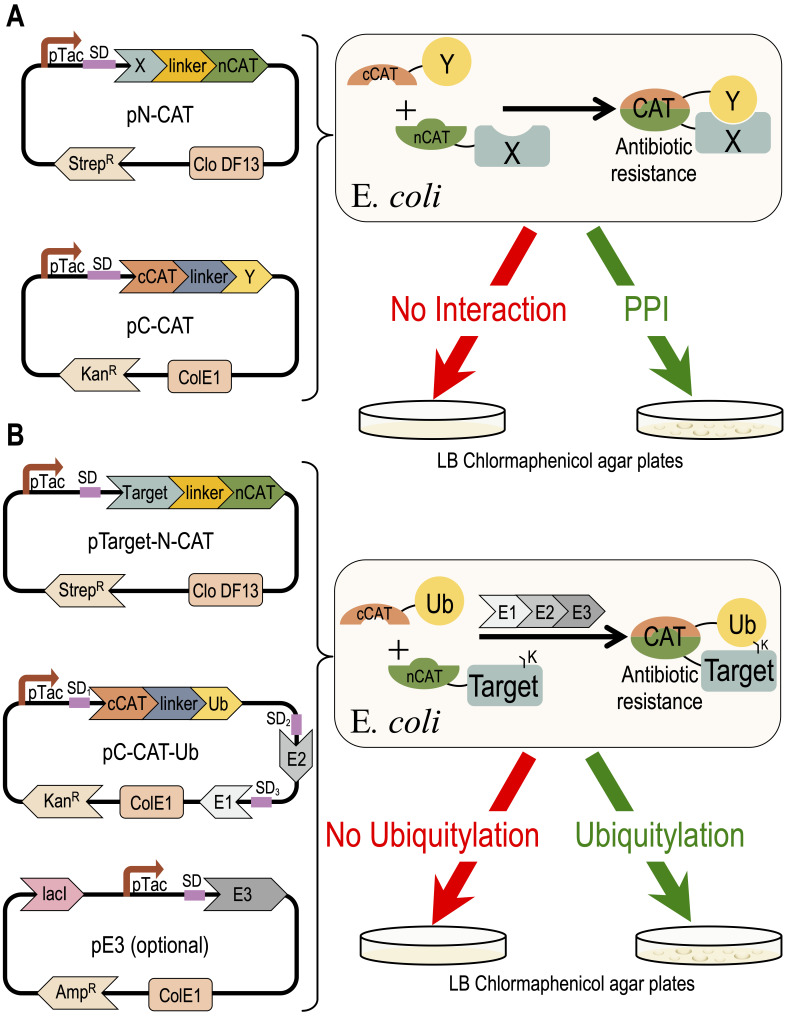
Eukaryotic protein interactions are often regulated by transient PTMs that challenge the identification of these PPIs. The high sensitivity of mass-spectrometry technologies are beneficial for the detection of a large spectra of PPIs and PTMs ( Blagoev et al., 2003 ; Peng et al., 2003 ). However, redundancy within the modifier enzymes challenges their linking to their respective targets. Protein microarray serves as an alternative, comprehensive approach for identification of PTMs, while linking them to their modifier enzyme ( Gupta et al., 2007 ). Sequence and structure-based in silico approaches provide predictions of PPIs, and thus facilitate analysis using the above described methods (Marcotte et al., 1999; London et al., 2012; Keren-Kaplan et al., 2013; Jumper et al., 2021). Among over 200 different PTMs in the eukaryotic proteome, ubiquitylation is the most abundant and complex modification, with over 600 ubiquitin E3-ligases in humans. Here, we present a detailed protocol for a recently developed application to detect and quantify PPIs and ubiquitylation, using a recombinant system that is expressed in E. coli , and based on Split-chloramphenicol Acetyl-Transferase (Split-CAT) (Levin-Kravets et al., 2021). Bacterial growth efficiency is the system readout, which can be estimated as endpoint, or continuously measured to obtain kinetics readouts. Contradictory to selection systems that report growth based on synthesis of essential metabolites, such as uracil, thymidine, or histidine, which pose limits on seeding concentration, the Split-CAT system modifies the antibiotic, thus allowing high-density seeding of bacteria. The sensitivity to a wide concentration range of chloramphenicol allows the detection of a large spectrum of affinities of PPIs. The tight correlation between binding or ubiquitylation and growth efficiency allows the estimation of apparent relative affinity (Keren-Kaplan et al., 2016). The system was constructed with several compatible plasmids, which provides modularity, and facilitates its transfer to different bacteria ( Figure 1 ).
Figure 1. Concept of the Split-CAT selection system.
The DNA plasmids encoding the system are shown on the left side. The activities of the proteins encoded by the system are shown to the right. (A) Shows a scheme of the PPI study. (B) Shows a scheme of the ubiquitylation study.
Split-CAT as reporter in self-ubiquitylation assay
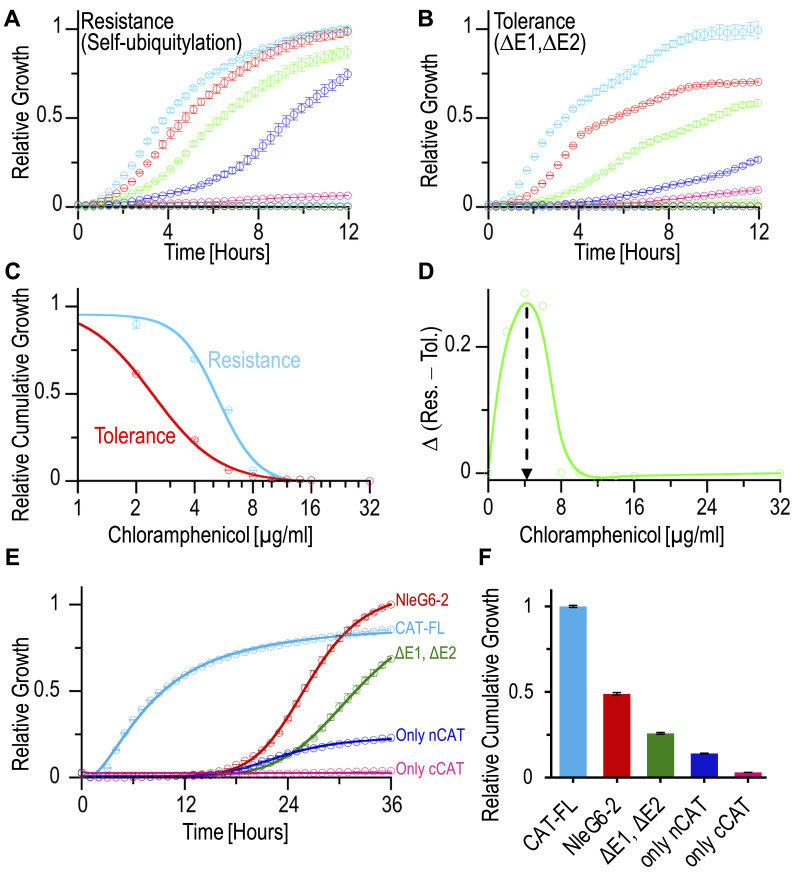
Here, we demonstrate how to harness the Split-CAT system for a self-ubiquitylation assay, using the ubiquitin E3-ligase NleG6-2 of EHEC as an example. In this assay, we co-express the E3-ligase along with a cognate ubiquitylation cascade, including ubiquitin, E1, and E2 in a 96-well plate, or in an agar Petri dish ( Figure 2 ). In this system, the NleG6-2 serves both as a ligase and as a ubiquitylation target, and therefore it was fused to the N-CAT fragment. The C-CAT fragment is fused to ubiquitin. Upon self-ubiquitylation, a stable covalent isopeptide bond between the C-terminus of ubiquitin and a lysine residue in the E3-ligase facilitates functional assembly of the split-CAT, giving rise to CAM resistance, and growth on selective media ( Figure 2A ). As a negative control, we co-express the system without the E1 and E2 enzymes (∆E1, ∆E2 in Figure 2B ). In this scenario, an attenuated E. coli growth is seen, due to antibiotic tolerance only in low antibiotic concentrations. Without CAM (curve with light blue circles), the growth of the strain with self-ubiquitylation (resistance) is identical to the ∆E1, ∆E2 strain (tolerance). But what is the optimal CAM concentration to run the assay? We found that expression of different protein cascades provides different optimal CAM concentrations. Here, we describe how to identify the optimal CAM concentration for further experiments, where one wishes to study the effect of mutations, small molecule modulators, and more on the ubiquitylation process. We recommend setting the experiment up with increased CAM concentrations, varied from zero to approximately 32 μg/mL (as shown in Figure 2 ). Cumulative growth is the integral (area under curve) of the growth curve in each of the CAM concentrations ( Figure 2C and 2F ). This provides a single value that represents the growth efficiency. A plot of the growth efficiencies against CAM concentrations (similar to an IC50 curve) is shown in Figure 2C . The growth efficiency of the strain with ‘resistance’ (light blue) is more significant than that of the strain with ‘tolerance’ (red). Subtraction of the two curves (Res.–Tol.) results in an optimum curve ( Figure 2D ). The maximum of the curve in Figure 2D provides an optimal CAM concentration for downstream experiments, where one can study the effect of mutants or small molecule modulators.
Figure 2. Self-ubiquitylation of NleG6-2 ubiquitin E3-ligase .
(A) Assays of NleG6-2 self-ubiquitylation dependent resistance under increased chloramphenicol (CAM) concentrations (0-light blue, 2-red, 4-green, 6-blue, 8-magenta, 10-dark green, 12-yellow, 16-cyan, and 32-brown μg/mL). (B) As a negative control for the experiment shown in A: tolerance growth for a strain that lacks ubiquitylation and resistance (∆E1, ∆E2) is shown. (C) Relative IC50 based on the cumulative growths (integrals) shown in A and B. (D) A curve showing the optimal CAM concentration to run downstream assays. (E) Spotting assay on LB agar Petri dish showing self-ubiquitylation of NleG6-2. The selection system provides a readout for self-ubiquitylation of NleG6-2 in red. Specific negative control for the ubiquitylation (∆E1, ∆E2) in green. Negative controls of only N- or C-CAT fragments are in blue and magenta, respectively. Positive control of the full-length CAT (CAT-FL) is in cyan. (F) The values in the bar-plot represent the ‘relative cumulative growth’ (integrals) of the growth curves shown in plot E.
Materials and Reagents
Tubes 1.5, 15, 50 mL (LIFEGENE catalog numbers: LMCT1.7B, LTB15, LTB50)
Multichannel pipet (Gilson PIPETMAN L Multichannel P12x200L, catalog number: FA10012)
LB agar (1.5% agar, BD Difco TM Agar, catalog number: 11793523)
Petri dishes 90, 50 mm (MINIPLAST, catalog numbers: 820-090-01-017, 872-050-05-000)
Black matte spray paint for plastic Petri dish covers (RUST-OLEUM 2X Ultra Cover Ultra Matte Spray)
96-well plate (CORNING, catalog number: 3596)
Highly efficient E. coli competent cells, rec A- strain (such as Mach1 or DH5α; ThermoFisher, catalog number: C862003 and 18265017 respectively)
Gibson assembly mix (NEB, catalog number: E2611S)
DNA plasmids: pC-CAT-Ub, pTarget-N-CAT and pE3 (available from our laboratory for academic use).
Antibiotics such as ampicillin, kanamycin, streptomycin, and chloramphenicol (FORMEDIUM, catalog number: AMP25, CAISSON LABS, catalog number: 05212005, CHEM-IMPEX INTERNATIONAL, catalog number: 0028, FORMEDIUM, catalog number: CLA01)
Luria-Bertani (LB) medium (NEOGEN, catalog number: NCM0173A)
SOC medium (FORMEDIUM, catalog number: SOC0201)
Equipment
Spectrophotometer (MRC, model: Spectro-V11D)
Vortex (Scientific Industries, model: Vortex-Genie 2, catalog number: SI-0236)
Thermostatic water bath (Fried Electric, WBS)
Incubators (for Petri dishes and shaker for tubes, MRC LABORATORY-INSTRUMUNTS, catalog number: BOD-80, INFORS HT, Ecotro1)
Flatbed office (US-letter/A4) scanner (such as Epson, model: Perfection V19 or V37)
Plate reader-shaker-incubator (TECAN, Sunrise)
Software
SAMPLE ( https://github.com/PragLab/SAMPLE )
Fiji/ImageJ ( https://fiji.sc or https://imagej.nih.gov/ij/ ) and its plugin Time Series Analyzer V3 (Balaji J. 2007); https://imagej.nih.gov/ij/plugins/time-series.html )
Analysis software such as Excel, KaleidaGraph, GraphPad Prism or SigmaPlot
Procedure
-
Cloning of bait and prey or ubiquitylation proteins
We recommend employing the Gibson assembly methodology for cloning ( Gibson et al., 2009 ). However, other methodologies may be used.
-
We will not provide a protocol for cloning here, but we would like to address a few important points regarding the structure of the final DNA plasmids in the system:
We recommend using a constitutive promoter, such as an un-regulated PTac. We recommend avoiding the use of IPTG, as it inhibits growth. Expression from the T7-promoter requires inducible T7-RNA polymerase, and therefore is also not recommended.
In plasmids for the expression of multiple genes (polycistronic), such as pC-CAT-Ub, that also expresses E1 (UBA1) and E2 (such as yeast Ubc4) enzymes, Shine-Dalgarno (SD) Ribosome Binding Site (RBS) sequences must be designed in front of each of the expressed genes ( Prag et al., 1997 ).
To maintain stabilized copies of each of the plasmids, we recommend using compatible origins of replication ( Figure 1 ).
-
Co-transformation of plasmid DNA
Use 20–50 μL of highly efficient [10 8 cfu/µg of DNA (pUC19)] E. coli competent cells. We mainly use Mach1 T1 R competent cells prepared by the Inoue Method in our laboratory (Inoue et al., 1990; Sambrook and Russell, 2006 ). Alternatively, these cells can be purchased from ThermoFisher. The benefit of Mach1 T1 R cells is their higher growth rate, which accelerates and thus facilitates the study. Nevertheless, other cells, including DH5α, W3110, or HMS174 can be used.
-
Use 300–500 ng of each plasmid ( Figure 1 ).
Note: Co-transformation of multiple plasmids is an inefficient procedure that requires high concentrations of DNA. If co-transformation of three plasmids fails, try to transform in steps, i.e., first transform one or two plasmids; then prepare competent cells harboring these plasmid(s), and transform them with the third plasmid.
To facilitate co-transformation, incubate the cells with the DNA plasmids on ice for 30 min, followed by a 45 s heat shock in a 42 °C water bath. Return the mixture to ice for 2 min, and add 1 mL of SOC medium. Incubate in a shaking incubator at 37 °C for 60 min.
Spread all the content of the transformed culture on prewarmed LB agar plates, supplemented with 15 μg/mL kanamycin and 12.5 μg/mL streptomycin (half concentrations of standard selective media plates for transformation; for three plasmids, use third concentrations of each antibiotic, and add 33 μg/mL ampicillin).
Place the plates in a stationary incubator at 37 °C overnight.
Store the plates in a refrigerator at 4 °C for future use (up to 1–2 weeks).
-
Preparation of culture starters
Prepare a volume of 5–10 mL LB culture of each sample (test, positive control, negative control, etc.), supplemented with 15 μg/mL kanamycin and 12.5 μg/mL streptomycin (we use 50 mL tubes).
-
Incubate the starters in a shaker incubator at 180 rpm and 37 °C for ~1–3 h, or until the cultures reach 0.3–0.5 OD 600nm .
Note: The growth rate in the starters can significantly vary. If one of the strains reaches ~0.5 OD 600nm before others, take it out of the incubator, and store it on the bench at room temperature. Cultures should be harvested in the early logarithmic phase of ~0.4 OD 600nm . Significant deviation of this concentration can affect the results. Solutions with high O.D. may contain a large number of dead bacteria.
To reduce noise, we recommend spinning down the bacteria, pour the old LB, and replace it with fresh LB that lacks antibiotics. Based on the measured OD 600nm , add the appropriate volume to achieve 0.4 OD 600nm .
For the spotting assay on an agar plate, adjust the OD of the cultures to 0.2 in new microcentrifuge tubes, at a volume of 500 μL. For a 96-well plate assay, adjust the OD to 0.4 at a volume of 10 mL.
-
Performing the assay
-
Assay with 96 well-plate reader in liquid medium
We first determine the optimal CAM concentration for the following binding or ubiquitylation assays. This is done by a series of growth experiments with increasing CAM concentrations, for comparing the growth efficiency of the wild-type with a negative control bacterial strain. The optimal CAM concentration is the one that presents the largest growth difference between the wild-type and the negative control ( Figure 2A –2D).
We recommend growing the bacteria in 0, 2, 4, 6, 8, 10, 12, 16, and 32 μg/mL of final CAM concentrations. First, prepare 10 mL of LB media supplemented with increased 2× CAM concentrations (i.e., 0, 4, 8, 12, 16, 20, 24, 32, and 64) in 15 mL tubes.
We recommend using a multi-channel pipettor to set the 96 well-plate. First, dispense half of the final volume of the 2× CAM LB (75 μL) in each well. Use a 25 mL pipetting reservoir for a multi-channel pipettor, start with the low concentration, and reuse the reservoir with increased CAM concentrations.
Then, dispense the culture (2× OD 600 ) 75 μL in each well, from a 25 mL pipetting reservoir, and mount the 96 well-plate in the shaker reader.
We typically grow the bacteria at 37°C with continuous shaking, and read the OD 600 at 20 min intervals. A typical assay takes 12–24 h.
-
Repeat the above set for the negative control. In the case of the ubiquitylation cascade, there are many negative control options, including ubiquitin mutant at the C-terminus (such as Ub-R77), deletion, or catalytically dead mutants of E1 and E2 enzymes, or targets that lack the E3 recognition element. For PPI experiments, replacement of the prey or the bait with a non-relevant protein is a useful negative control. In the negative control cells, we recommend expressing similar amounts and size of proteins to pose similar burden.
Note: Targets that contain ubiquitin-binding domain(s) (UBDs, such as Rpn10) typically undergo E3-independent ubiquitylation and may be used as a simple positive control.
As mentioned, cumulative growth for each CAM concentration was used to arrive at a single value representing growth efficiency. To arrive at this value, subtract the growth of the negative control from the wild type at each CAM concentration to obtain the optimal concentration for downstream experiments ( Figure 2D ).
-
Split-CAT based spots assay on agar plates
The two following assays (depicted in Figure 2E –2F and Figure 3A –3C) provide examples for using the system on regular agar Petri dishes with the spotting assay. Here, we will focus on how to handle and set up these experiments, while in the next example ( Figure 4 ), we will focus on how to collect and analyze the data of these spotting assays. Figure 2E –2F demonstrates the growth curves of E. coli strains that express a self-ubiquitylation system of NleG6-2 and the indicated controls, as well as their quantifications. These assays were performed on agar plates, as described below. Similarly, in Figure 3A –3C, PPIs and ubiquitylation assays of Rpn10 are shown, using the same spot assay procedure.
Prepare LB agar mini (50 mm) plates supplemented with the desired concentration of CAM (between 2–32 μg/mL; as described above, in the 96-well plate assay).
Spot 2.0–2.5 μL of the adjusted OD 600 (0.2) cultures on agar plates. We recommend spotting at least three technical repetitions of each strain to calculate the standard deviation.
A grid print below the plate may facilitate the spotting array.
-
Cover the plate with a black Petri dish cover, and mount on the scanner ( Figure 4 ).
Note: Mount the plates on the scanner with their bottom face down; the scanner scans through the agar. Black covers prevent reflection of the spots on the plastic dish. We spray a compatible Petri dish cover with standard black matte spray paint (at the inner side, to eliminate reflection), and sterilize the covers with 70% ethanol, for multiple uses. Alternatively, one can purchase premade black covers, or use glass Petri dish covers that can be autoclaved ( Figure 4 ).
Incubate plates at 28–37°C for 12–48 h, and scan images in intervals of 0.5–2 h, using SAMPLE software for further quantification and analyses of the growth efficiency (time-lapse scanning). This incubation and use of the SAMPLE software will be discussed further in a later section.
Figures 2D and 2E demonstrate results of NleG6-2 self-ubiquitylation assay, with the above-described spotting assay on agar plates.
Note: The CAM concentration in this experiment is 12 μg/mL. Growth on liquid or solid media presents different antibiotic resistance.
-
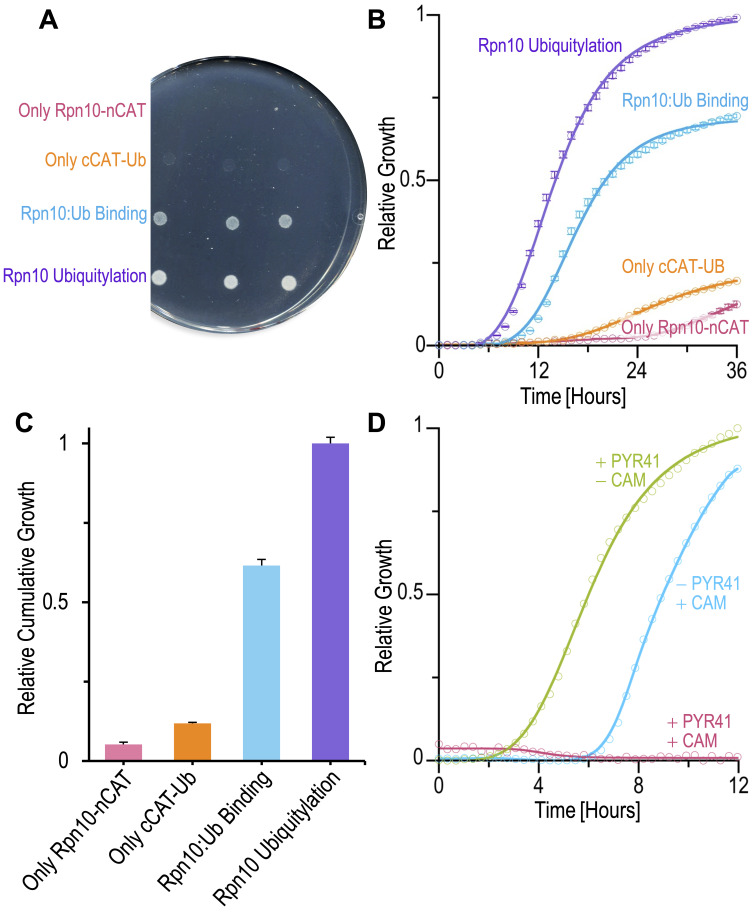
Figure 3. Split-CAT assay for protein-protein interactions, ubiquitylation, and small molecule modulator.
Split-CAT spot assay reporting Rpn10 ubiquitylation and Rpn10:Ub non-covalent binding on selective agar media supplemented with 12 μg/mL CAM. (A) Representative scan at 24 h post seeding. (B) Relative growth curves acquired with the time series analyzer V3 plugin. Quantification of the scans during 36 h represented in A, with standard deviation (n=3). (C) Relative cumulative growth of the curves in B. Single values of the integrals (area under curves) shown in B, presented as a bar-plot with standard deviation (n=3). (D) The E1 inhibitor PYR-41 (50 μM), arrests Rpn10 ubiquitylation dependent growth in liquid medium (24 μg/mL CAM).
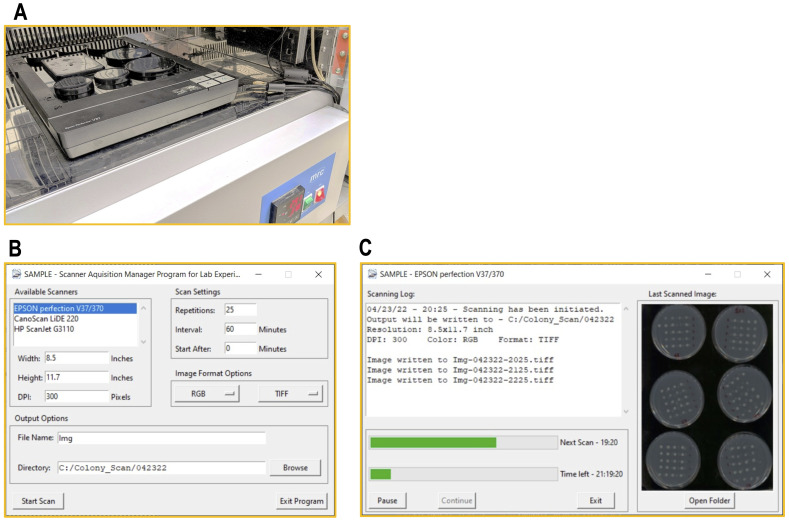
Figure 4. SAMPLE: a data acquisition software to capture time-lapse scans.
(A) Flatbed scanner stacked with black covered dishes in the incubator. (B) SAMPLE includes a simple graphical interface, which allows the user to initially set up the parameters of the time-lapse scan. (C) A second window shows the progress of the scan process.
Split-CAT assays for protein-protein interaction, ubiquitylation, and small molecule modulators
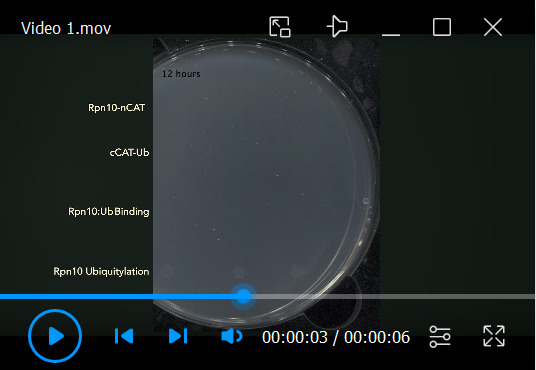
The Split-CAT system may report non-covalent PPIs, covalent PPIs, such as ubiquitylation, and the activity of small molecule modulators. To demonstrate these three utilities, we chose the Ub-receptor Rpn10 as reporter for binding and/or ubiquitylation ( Figure 3 and Video 1 ). Rpn10 is one of the ubiquitin-receptors of the proteasome, and it binds ubiquitin in a non-covalent manner. We discovered that this non-covalent binding directs Rpn10 ubiquitylation to a specific lysine residue (Keren-Kaplan et al., 2012). Therefore, Rpn10 serves as reporter for both binding and ubiquitylation ( Figures 3A –3C). As ubiquitylation turns the dynamic non-covalent binding into a stable covalent bond (due to the lack of deubiquitylation and degradation in the bacteria), it significantly increases the stability of the assembled split-CAT, thus providing resistance to a significantly higher CAM concentration (Levin-Kravets et al., 2021) . Moreover, like other Ub-receptors (also known as UBD-containing proteins), Rpn10 undergoes ubiquitylation directly by E2 (Levin-Kravets et al., 2016). This simplifies the presented system, as we do not need E3. The above assays were performed on LB-agar plates, to demonstrate their simplicity.
Video 1. Bacterial growth time-lapse shows Rpn10:ubiquitin non-covalent binding versus ubiquitylation.
For small molecule screening, liquid LB is recommended instead of LB-agar, as it allows the use of 96 and 384 well plates. In figure 3D , we demonstrated the system responses to the small molecule PYR-41, an inhibitor of E1 ( Yang et al., 2007 ). Note that, since Rpn10 binds ubiquitin in a non-covalent manner ( Figure 3A –3C), we increased the CAM concentration from 12 to 24 μg/mL to detect the effect of E1 inhibition. At 24 μg/mL CAM, non-covalent ubiquitin binding to Rpn10 does not promote growth, but as seen in figure 3D , ubiquitylation promotes growth. The assembly of the split-CAT fragments supports selective growth at this concentration, owing to ubiquitylation (covalent binding) but not to non-covalent binding.
Data collection with flatbed scanner
Following spotting the bacteria onto LB agar Petri-dishes, mount the dishes with their bottoms facing down on an office flatbed scanner located in an incubator (i.e., the spots are scanned through the agar; Figure 4A ). To capture time-lapse images from the scanner at a defined intervals (typically, 30–60 min), we developed a specialized software dubbed SAMPLE (Scanner Acquisition Manager Program for Laboratory Experiments, Figure 4B –4C), which is available from our website or in github ( https://github.com/PragLab/SAMPLE ). The software is available for Windows version 7 or newer. SAMPLE will automatically recognize scanners connected to the computer, with a windows image acquisition (WIA) compatible driver installed, i.e., the original manufacturer driver of the scanner. It allows for multiple scanners to simultaneously monitor growth with a single computer. SAMPLE was written using Python (Python Software Foundation, ver. 3.8, https://www.python.org ), but is available as a standalone Windows executable. Figures 4B –4C show the graphical user interface for this software.
Data quantification of scans and analyses
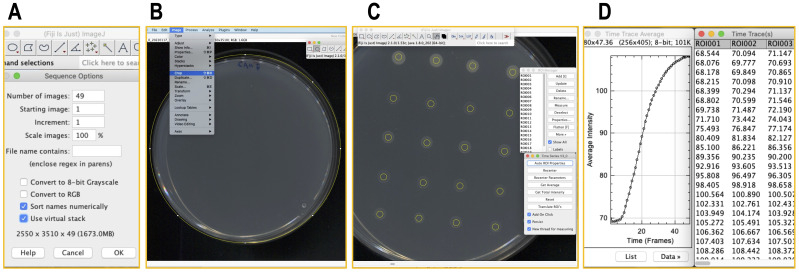
Use Fiji or ImageJ for the analysis and quantification of the scans (images). First, download and install the “Time Series Analyzer V3” plugin algorithm into the ImageJ/Fiji from http://rsb.info.nih.gov/ij/plugins/time-series.html .
To import the scans, click the “File” menu → select “Import” → “Image Sequence” → choose selected images directory → Check “Use virtual stack” → click “OK” ( Figure 5A ).
Crop the images to facilitate the analysis. Select the region of the plate → Click “Image” menu → Crop ( Figures 5B ).
Invoke “Time Series Analyzer V3” from the “Plugin” menu → select “Auto ROI (Region Of Interest) Properties” → adjust to “25 × 25” (pixels.) → Check the “Add on click” → click on the center of a desired set of spots (circles showing the ROI will appear; Figure 5C ).
Hit the “Get average” button in the “Time Series V3” window (“Time trace Average” and “Plot Values” windows, including a plot and the alpha numeric data, will appear; Figure 5D ).
Copy the raw numeric data to a spreadsheet (such as MS Excel) → Assemble data of different culture types. We recommend repeating the spotting assay in at least three independent cell cultures.
We ignore the derived standard errors, and use the raw data to calculate standard deviation instead.
-
To produce a time-lapse movie, one can save the ‘image sequence’ in various formats (using the ‘Save As’ option), such as AVI or Animated Gif (see Video 1 ).
Note: Change the ROI properties and number of samples in each spot, as desired. When choosing the desired ROIs, pick the homogenous area in the center of the spot to avoid marginal effects.
Following the quantification with Fiji, we use the Synergy software KaleidoGraph for data analysis, including sigmoidal curve fitting and integrals calculations. Other commercially available software, such as SigmaPlot, may apply. Given limited access to such software, one may skip the curve fitting and estimate the cumulative growth by summing the entire measured densities over time using Microsoft Excel, and present it as bar-plot with the appropriate standard deviations.
Figure 5. Quantification of the assay using Fiji.
(A) Import of sequence of scan images into Fiji. (B) Crop images. (C) Select spots using ‘Time Series Analyzer’ and (D) Quantification the selected ROIs.
Acknowledgments
We thank Ilan Rosenshine, from the faculty of medicine, Hebrew University, Jerusalem, for kindly providing the plasmid DNA of NleG6-2. This research was supported by the Israeli Science Foundation (grants numbers 651/16 and 1440/21), by the Cooperation Program in Cancer Research of the Deutsches Krebsforschungszentrum (DKFZ) and Israel’s Ministry of Science and Technology (MOST), and by Acceleration Grant program of the Israel Cancer Research Fund (ICRF) Award Number: 940283. The current protocol is derived from the original paper of the Split-CAT system that was published in the Journal of Molecular Biology (JMB) by Levin-Kravets et al. (2021).
Competing interests
GP has equity in Coltac therapeutics LTD, other authors declare no competing interests.
Company and patents: Patents: US10982252, US20200385706, and US20210356467.
Citation
Readers should cite both the Bio-protocol article and the original research article where this protocol was used.
Q&A
Post your question about this protocol in Q&A and get help from the authors of the protocol and some of its users.
References
- 1. Bair C. L. , Oppenheim A. , Trostel A. , Prag G. and Adhya S. ( 2008 . ). A phage display system designed to detect and study protein-protein interactions . Mol Microbiol 67 ( 4 ): 719 - 728 . [DOI] [PubMed] [Google Scholar]
- 2. Blagoev B. , Kratchmarova I. , Ong S. E. , Nielsen M. , Foster L. J. and Mann M. ( 2003 . ). A proteomics strategy to elucidate functional protein-protein interactions applied to EGF signaling . Nat Biotechnol 21 ( 3 ): 315 - 318 . [DOI] [PubMed] [Google Scholar]
- 3. Fields S. and Song O. ( 1989 . ). A novel genetic system to detect protein-protein interactions . Nature 340 ( 6230 ): 245 - 246 . [DOI] [PubMed] [Google Scholar]
- 4. Galarneau A. , Primeau M. , Trudeau L. E. and Michnick S. W. ( 2002 . ). Beta-lactamase protein fragment complementation assays as in vivo and in vitro sensors of protein protein interactions . Nat Biotechnol 20 ( 6 ): 619 - 622 . [DOI] [PubMed] [Google Scholar]
- 5. Gupta R. , Kus B. , Fladd C. , Wasmuth J. , Tonikian R. , Sidhu S. , Krogan N. J. , Parkinson J. and Rotin D. ( 2007 . ). Ubiquitination screen using protein microarrays for comprehensive identification of Rsp5 substrates in yeast . Mol Syst Biol 3 : 116 . [DOI] [PMC free article] [PubMed] [Google Scholar]
- 6. Inoue H. , Nojima H. and Okayama H. ( 1990 . ). High efficiency transformation of Escherichia coli with plasmids . Gene 96 ( 1 ): 23 - 28 . [DOI] [PubMed] [Google Scholar]
- 7. Johnsson N. and Varshavsky A. ( 1994 . ). Split ubiquitin as a sensor of protein interactions in vivo . Proc Natl Acad Sci U S 22 ): 10340 - 10344 [DOI] [PMC free article] [PubMed] [Google Scholar]
- 8. Jumper J. , Evans R. , Pritzel A. , Green T. , Figurnov M. , Ronneberger O. , Tunyasuvunakool K. , Bates R. , Zidek A. , Potapenko A. , et al. .( 2021 . ). Highly accurate protein structure prediction with AlphaFold . Nature 596 ( 7873 ): 583 - 589 . [DOI] [PMC free article] [PubMed] [Google Scholar]
- 9. Keren-Kaplan T. , Attali I. , Estrin M. , Kuo L. S. , Farkash E. , Jerabek-Willemsen M. , Blutraich N. , Artzi S. , Peri A. , Freed E. O. , et al. .( 2013 . ). Structure-based in silico identification of ubiquitin-binding domains provides insights into the ALIX-V:ubiquitin complex and retrovirus budding . EMBO J 32 ( 4 ): 538 - 551 . [DOI] [PMC free article] [PubMed] [Google Scholar]
- 10. Keren-Kaplan T. , Zeev Peters L. , Levin-Kravets O. , Attali I. , Kleifeld O. , Shohat N. , Artzi S. , Zucker O. , Pilzer I. , Reis N. , et al. .( 2016 . ). Structure of ubiquitylated-Rpn10 provides insight into its autoregulation mechanism . Nat Commun 7 : 12960 . [DOI] [PMC free article] [PubMed] [Google Scholar]
- 11. Keren-Kaplan T. and Prag G. ( 2012 . ). Purification and crystallization of mono-ubiquitylated ubiquitin receptor Rpn10. Acta Crystallogr Sect F Struct Biol Cryst Commun. 68:1120-1123 [DOI] [PMC free article] [PubMed]
- 12. Levin-Kravets O. , Kordonsky A. , Shusterman A. , Biswas S. , Persaud A. , Elias S. , Langut Y. , Florentin A. , Simpson-Lavy K. J. , Yariv E. , et al. .( 2021 . ). Split Chloramphenicol Acetyl-Transferase Assay Reveals Self-Ubiquitylation-Dependent Regulation of UBE3B . J Mol Biol 433 ( 23 ): 167276 . [DOI] [PubMed] [Google Scholar]
- 13. London N. , Gulla S. , Keating A. E. and Schueler-Furman O. ( 2012 . ). In silico and in vitro elucidation of BH3 binding specificity toward Bcl-2 . Biochemistry 51 ( 29 ): 5841 - 5850 . [DOI] [PMC free article] [PubMed] [Google Scholar]
- 14. Majoul I. , Straub M. , Duden R. , Hell S. W. and Soling H. D. ( 2002 . ). Fluorescence resonance energy transfer analysis of protein-protein interactions in single living cells by multifocal multiphoton microscopy . J Biotechnol 82 ( 3 ): 267 - 277 . [DOI] [PubMed] [Google Scholar]
- 15. Marcotte E. M. , Pellegrini M. , Ng H. L. , Rice D. W. , Yeates T. O. and Eisenberg D. ( 1999 . ). Detecting protein function and protein-protein interactions from genome sequences . Science 285 ( 5428 ): 751 - 753 . [DOI] [PubMed] [Google Scholar]
- 16. Pelletier J. N. , Campbell-Valois F. X. and Michnick S. W. ( 1998 . ). Oligomerization domain-directed reassembly of active dihydrofolate reductase from rationally designed fragments . Proc Natl Acad Sci U S A 95 ( 21 ): 12141 - 12146 . [DOI] [PMC free article] [PubMed] [Google Scholar]
- 17. Peng J. , Schwartz D. , Elias J. E. , Thoreen C. C. , Cheng D. , Marsischky G. , Roelofs J. , Finley D. and Gygi S. P. ( 2003 . ). A proteomics approach to understanding protein ubiquitination . Nat Biotechnol 21 ( 8 ): 921 - 926 . [DOI] [PubMed] [Google Scholar]
- 18. Prag G. , Greenberg S. , and Oppenheim A. B. ( 1997 . ). Structural principles of prokaryotic gene regulatory proteins and the evolution of repressors and gene activators . Mol Microbiol . 26 ( 3 ): 619 - 620 . [DOI] [PubMed] [Google Scholar]
- 19. Sambrook J. , and Russell D.W. ( 2006 . ). The inoue method for preparation and transformation of competent Escherichia coli :“ultra-competent” cells . CSH Protoc . 2006 . [DOI] [PubMed] [Google Scholar]
- 20. Smith G. P. ( 1985 . ). Filamentous fusion phage: novel expression vectors that display cloned antigens on the virion surface . Science 228 ( 4705 ): 1315 - 1317 . [DOI] [PubMed] [Google Scholar]
- 21. Stagljar I. , Korostensky C. , Johnsson N. and Heesen S. t. ( 1998 . ). A genetic system based on split-ubiquitin for the analysis of interactions between membrane proteins in vivo . Proc Natl Acad Sci U S A 95 ( 9 ): 5187 - 5192 . [DOI] [PMC free article] [PubMed] [Google Scholar]
- 22. Walter M. , Chaban C. , Schutze K. , Batistic O. , Weckermann K. , Nake C. , Blazevic D. , Grefen C. , Schumacher K. , Oecking C. , et al. .( 2004 . ). Visualization of protein interactions in living plant cells using bimolecular fluorescence complementation . Plant J 40 ( 3 ): 428 - 438 . [DOI] [PubMed] [Google Scholar]
- 23. Yang Y. , Kitagaki J. , Dai R. M. , Tsai Y. C. , Lorick K. L. , Ludwig R. L. , Pierre S. A. , Jensen J. P. , Davydov I. V. , Oberoi P. , et al. .( 2007 . ). Inhibitors of ubiquitin-activating enzyme(E1), a new class of potential cancer therapeutics . Cancer Res 67 ( 19 ): 9472 - 9481 . [DOI] [PubMed] [Google Scholar]


