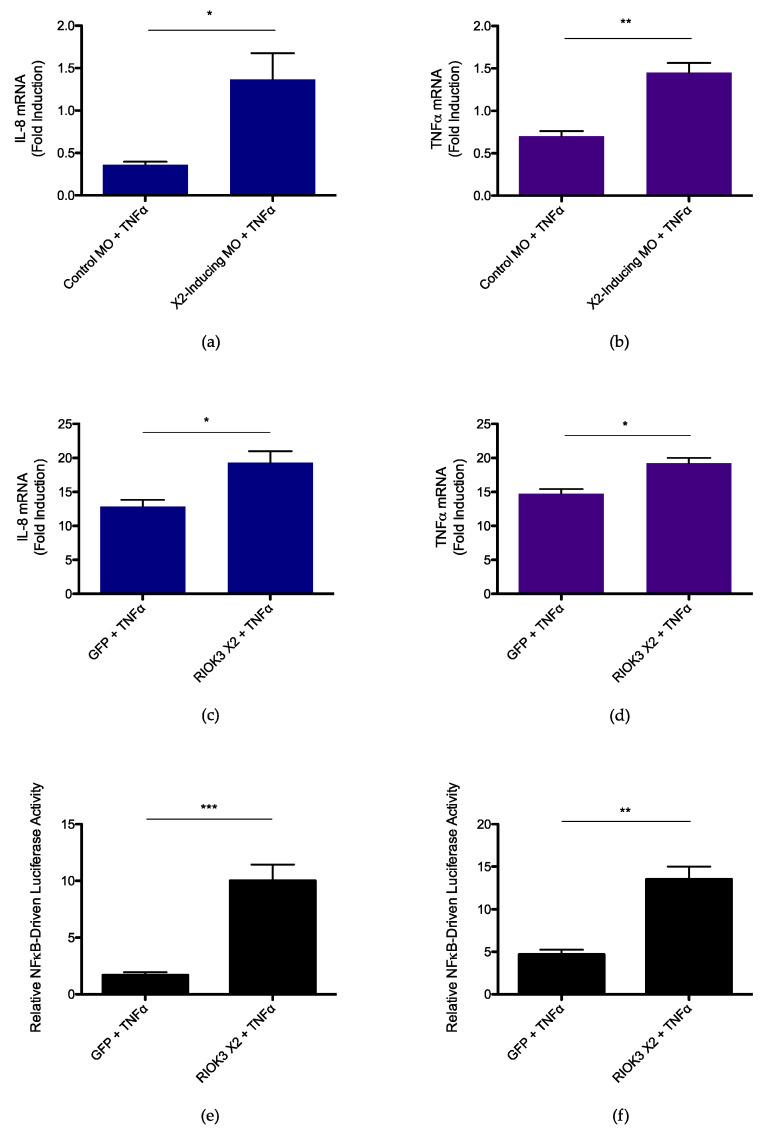
Figure 5.
RIOK3 X2 expression triggers inflammatory pathway activation. (a) IL-8 mRNA expression in X2-inducing MO- vs. standard control MO-treated WT HEK 293 cells (b) TNFα mRNA expression in X2-inducing MO- vs. standard control MO-treated WT HEK 293 cells (c) IL-8 mRNA expression in GFP- vs. RIOK3 X2-transfected WT HEK 293 cells (d) TNFα mRNA expression in GFP- vs. RIOK3 X2-transfected WT HEK 293 cells (e) Luciferase assay measuring NFκB promoter activity in GFP- vs. RIOK3 X2-transfected WT HEK 293 cells (f) Luciferase assay measuring NFκB promoter activity in GFP- vs. RIOK3 X2-transfected RIOK3 KO HEK 293 cells. In plots (a,b), fold induction is relative to values of cells transfected with standard control MO and that were not treated with TNFα. Cells were grown in 12-well plates, seeded at a density ~0.2 × 10⁶ cells/well, and treated with 80 ng/mL TNFα for 4 h. In (c,d), fold induction is relative to values of cells transfected with GFP and that were not treated with TNFα. In (c–f), cells were grown in 12-well plates, seeded at a density ~0.1 × 10⁶ cells/well, and treated with 20 ng/mL TNFα. In (c–e), cells were treated with TNFα for 4 h, and in (f), cells were treated with TNFα for 24 h. Plots in (a–f) present the data as the mean value of 3 biological replicates +/− SEM. Student’s t-test: * p < 0.05, ** p < 0.01, *** p < 0.001.

