

Abstract
Motivation
UMI-4C, a technique that combines chromosome conformation capture (4C) and unique molecular identifiers (UMI), is widely used to profile and quantitatively compare targeted chromosomal contact profiles. The analysis of UMI-4C experiments presents several computational challenges, including the removal of the PCR duplication bias and the identification of differential chromatin contacts.
Results
We have developed UMI4Cats (UMI-4C Analysis Turned Simple), an R package that facilitates processing, analyzing and visualizing of data obtained by UMI-4C experiments.
Availability and implementation
UMI4Cats is implemented as an R package supported on Linux, MacOS and MS Windows. UMI4Cats is available from Bioconductor (https://www.bioconductor.org/packages/release/bioc/html/UMI4Cats.html) and GitHub (https://github.com/Pasquali-lab/UMI4Cats).
Supplementary information
Supplementary data are available at Bioinformatics online.
1 Introduction
Profiling of chromatin contacts is increasingly used in regulatory genomics to map physical interactions between distal genomic elements. This data is then often used to infer regulatory relationships between genomic regulatory elements (Schoenfelder and Fraser, 2019). Our knowledge regarding the general characteristics and mechanisms of the 3D chromatin architecture is improving, yet much less is known regarding the mechanisms and functional significance of dynamic chromatin looping events during biological processes (Dekker et al., 2017; Ramos-Rodríguez et al., 2019; Rowley and Corces, 2018; Stadhouders et al., 2019; Yu and Ren, 2017).
Proximity ligation-based chromosome conformation capture (3C) derived methods were successfully applied to capture the spatial organization of the 3D genome in different cell types. Techniques such as 3C, 4C, 5C or HiC allow detecting chromatin contacts broadly in the genome or at target genomic loci with different levels of resolution, thus exhibiting different strengths and limitations (Kempfer and Pombo, 2020). Nevertheless, an amplification step shared by all these techniques, limits a robust quantitative comparison of the contact intensities detected in different cell types or conditions. In 2016, Schwartzman et al. (2016) developed a method which tackles this limitation by combining 4C-seq with unique molecular identifiers (UMI), thus allowing the removal of duplicated molecules and enabling quantitative comparison of chromatin contacts.
We have now developed UMI4Cats (UMI-4C Analysis Turned Simple), a multi-platform R package that facilitates processing and analyzing of data obtained from UMI-4C experiments.
2 Software description
UMI4Cats is an application developed in the widely used R programming environment and available through Bioconductor. This package is designed to analyze paired-end FastQ reads obtained from UMI-4C experiments and facilitates key steps of the data analysis: (i) preprocessing, (ii) loading and manipulation of UMI counts, (iii) identification of significant interactions, (iv) differential analysis and (v) visualization. A UMI4Cats analysis example is provided in Supplementary Information.
UMI4Cats enhances the methods implemented in umi4cpackage (Schwartzman et al., 2016), an R package published together with the UMI-4C protocol, by allowing the use of additional genomes and restriction enzymes. Importantly, UMI4Cats includes statistical analyses for identifying significant interactions with the viewpoint and for detecting those that are differential between two conditions. UMI4Cats relies on dependencies established by Bioconductor and is available for different OS (Linux, Windows and MacOSX).
2.1 Preprocessing and generation of UMI counts
Given a UMI-4C experiment, defined by the viewpoint and the restriction enzyme used, the paired-end FastQ files are preprocessed and summarized into a table containing the in silico digested restriction fragments and their UMI counts, which relate to the viewpoint contact frequencies.
This preprocessing step is wrapped in the contactsUMI4C() function, and requires the previous generation of an in silico digested genome using the digestGenome() function. Internally, contactsUMI4C() runs sequentially the following processes: (i) prepUMI4C() function, which filters out reads that do not contain the viewpoint sequence (bait + pad + restriction enzyme sequences, see Supplementary Information) or that present Phred quality scores <20, and identifies UMI sequences; (ii) splitUMI4C() digests the given reads using the defined restriction enzyme; (iii) alignmentUMI4C() aligns the digested reads to the reference genome using Rbowtie2 (Wei, 2018) and (iv) counterUMI4C() collapses the number of molecules present for each ligation applying a UMI filtering algorithm to remove PCR duplicates (see Supplementary Information). The end product of this function is a tab-separated file for each analyzed sample summarizing the number of UMI counts at each digested fragment located in a 10 Mb window centered at the viewpoint. Additional functions and functionalities related to this module are described in Supplementary Information.
2.2 Construction of the UMI4C object
After preprocessing the FastQ reads, the obtained UMI counts need to be transformed by the makeUMI4C() function into an object of class UMI4C, which is based on the Bioconductor SummarizedExperiment class. This function takes as input the tab-separated file, together with a sample information table that contains all relevant experiment information needed for downstream analysis (e.g. replicate and/or condition). By default, the generated UMI4C object will group UMI counts from different replicates together by condition, to use for downstream analysis. Additional groupings (e.g. by replicate) can be added using the addGrouping() function.
Additionally, makeUMI4C(): (i) removes digested fragments around the bait (by default using a 3 kb window), as they are generally biased by their proximity to the viewpoint, (ii) focuses the scope of the analysis in a specific region around the bait (by default a 2 Mb window) and (iii) normalizes the samples by scaling them to the sample or group with less UMIs. To allow downstream visualization of the interaction profiles, this function will also generate a domainogram for each sample or group, and their adaptive smoothing trends (see Supplementary Information).
2.3 Calling significant interactions
Once the UMI4C object is created and when multiple replicates are available, significant interactions with the viewpoint can be inferred by obtaining z-scores in genomic windows or in a user-defined set of regions. The method is based on Klein et al. (2015) and is explained in detail in Supplementary Information. Briefly, count data is first variance-stabilized and next fitted using a smooth monotone function to account for the signal decay from the viewpoint, which is typical of the 4C-seq data. Z-scores are then calculated from the residuals and converted into one-sided P-values. Finally, a false discovery rate (FDR) multiple testing correction is applied to control for false positive results. Regions significantly interacting with the viewpoint can then be defined as those fragments with a significant adjusted P-values and passing the z-score threshold. All these steps are wrapped in the callInteractions() function.
The results of this function can be visualized using the plotInteractionsUMI4C() function and significant regions can be extracted with getSignRegions() and used as input for the differential analysis.
2.4 Differential contacts analysis
The UMI counts stored in the UMI4C object can be tested for differential interactions between conditions using two different methods: Fisher’s Exact Test, implemented in the fisherUMI4C() function, and DESeq2’s Wald Test (Love et al., 2014), implemented in the waldUMI4C() function (see Supplementary Information for details on the usage of the differential tests). While the use of the DESeq2’s Wald statistics is recommended, the fisherUMI4C() function can be used in case that a reduced number of UMIs or a limited number of replicates precludes the possibility of applying DESeq2 Wald statistics. In both cases it is ideal to test differential contacts at user-defined candidate genomic regions, such as putative regulatory elements, open chromatin sites or a list of regions significantly interacting with the viewpoint obtained from the previous step.
Regions with adjusted P-values < 0.05 are considered to present significant differences in chromatin interactions. These results are appended to the UMI4C object and can be retrieved using the resultsUMI4C() function.
2.5 Visualization of chromatin contact profiles and differential interactions
The UMI4C object can be visualized by running the plotUMI4C() function. This function will generate a composed plot (Fig. 1) showing: (i) a legend, (ii) the protein-coding gene annotation in the plotted window, (iii) contact profiles represented by their adaptive smoothing trends, (iv) differential interactions, when present, are illustrated with their odds-ratio (OR) or log2 fold change (FC) values and, if available, significant differences are depicted with an asterisk and (v) domainogram of the UMI fold changes [full description of a domainogram available at Schwartzman et al. (2016)].
Fig. 1.
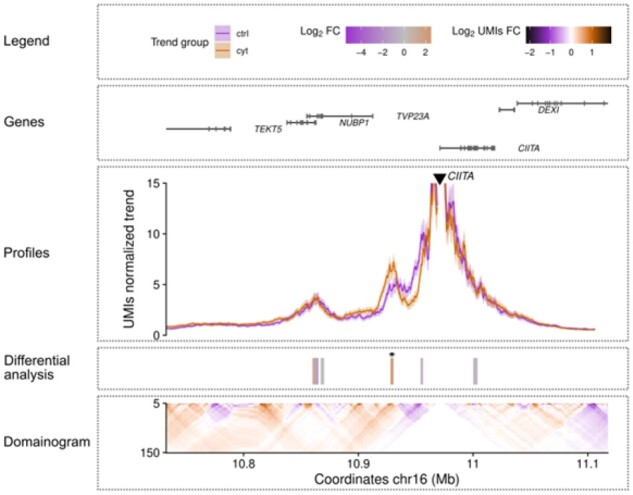
Example of a differential UMI4Cats plot at the CIITA locus. This plot illustrates the cis differential interaction profile of the CIITA promoter in human pancreatic islet cells in two different conditions: control (ctrl) and cytokine-exposed (cyt) [data obtained from Ramos-Rodríguez et al. (2019)]. The ‘Profiles’ panel includes the smoothed trend lines describing the contact profiles of the viewpoint which is depicted by a black triangle. A heatmap under the ‘Profiles’ panel (‘Differential analysis’ panel) represents the log2 fold change (FC) of the UMI-4C contacts difference between conditions, at regions identified to interact with the viewpoint. Significant differences (DESeq2’s Wald Test adjusted P < 0.05) are indicated by small black asterisks. In the bottom panel, a domainogram illustrates the mean contact intensity fold changes between conditions
3 Conclusions
We developed an R package that deals with the quality control, preprocessing, analysis, contact identification and differential testing of UMI-4C data. UMI4Cats performs all necessary steps to collapse ligation fragments with the same UMIs, allowing a quantitative assessment of chromatin contacts. Finally, UMI4Cats is able to detect significant interactions using z-scores and to test differential contacts among conditions using a Fisher's Exact Test or DESeq2’s Wald Test with multiple testing correction.
UMI4Cats is a highly flexible and user-friendly package that allows users to fine tune the analysis to their experiment design and the characteristics of the targeted genomic region. The results can be visualized in rich graphical output plots, integrating chromatin contact profiles with genomic annotations. The package is compliant with Bioconductor standards which ensures inter-operability with other tools and minimizes compatibility issues.
Funding
This work was supported by Spanish Ministry of Economy and Competiveness [SAF2017-86242-R], EFSD/JDRF/Lilly Programme on Type 1 Diabetes Research, ‘Unidad de Excelencia Maria de Maeztu’ [CEX2018-000792-M] and Premi Gonçal Lloveras i Vallès a l’Excelència en Investigació junior 2020.
Conflict of Interest: none declared.
Supplementary Material
Contributor Information
Mireia Ramos-Rodríguez, Endocrine Regulatory Genomics, Department of Experimental & Health Sciences, University Pompeu Fabra, Barcelona 08003, Spain.
Marc Subirana-Granés, Endocrine Regulatory Genomics, Department of Experimental & Health Sciences, University Pompeu Fabra, Barcelona 08003, Spain.
Lorenzo Pasquali, Endocrine Regulatory Genomics, Department of Experimental & Health Sciences, University Pompeu Fabra, Barcelona 08003, Spain.
References
- Dekker J. et al. (2017) The 4D nucleome project. Nature, 549, 219–226. [DOI] [PMC free article] [PubMed] [Google Scholar]
- Kempfer R., Pombo A. (2020) Methods for mapping 3D chromosome architecture. Nat. Rev. Genet., 21, 207–226. [DOI] [PubMed] [Google Scholar]
- Klein F.A. et al. (2015) FourCSeq: analysis of 4C sequencing data. Bioinformatics, 31, 3085–3091. [DOI] [PMC free article] [PubMed] [Google Scholar]
- Love M.I. et al. (2014) Moderated estimation of fold change and dispersion for RNA-seq data with DESeq2. Genome Biol., 15, 550. [DOI] [PMC free article] [PubMed] [Google Scholar]
- Ramos-Rodríguez M. et al. (2019) The impact of proinflammatory cytokines on the β-cell regulatory landscape provides insights into the genetics of type 1 diabetes. Nat. Genet., 51, 1588–1595. [DOI] [PMC free article] [PubMed] [Google Scholar]
- Rowley M.J., Corces V.G. (2018) Organizational principles of 3D genome architecture. Nat. Rev. Genet., 19, 789–800. [DOI] [PMC free article] [PubMed] [Google Scholar]
- Schoenfelder S., Fraser P. (2019) Long-range enhancer–promoter contacts in gene expression control. Nat. Rev. Genet., 20, 437–455. [DOI] [PubMed] [Google Scholar]
- Schwartzman O. et al. (2016) UMI-4C for quantitative and targeted chromosomal contact profiling. Nat. Methods, 13, 685–691. [DOI] [PubMed] [Google Scholar]
- Stadhouders R. et al. (2019) Transcription factors and 3D genome conformation in cell-fate decisions. Nature, 569, 345–354. [DOI] [PubMed] [Google Scholar]
- Wei,Z. et al. (2018) esATAC: an easy-to-use systematic pipeline for ATAC-seq data analysis. Bioinformatics, 34, 2664–2665. 10.1093/bioinformatics/bty141 [DOI] [PMC free article] [PubMed] [Google Scholar]
- Yu M., Ren B. (2017) The three-dimensional organization of mammalian genomes. Annu. Rev. Cell Dev. Biol., 33, 265–289. [DOI] [PMC free article] [PubMed] [Google Scholar]
Associated Data
This section collects any data citations, data availability statements, or supplementary materials included in this article.