

Summary
Breath volatile organics (VOCs) may provide immediate information on infection mechanisms and host response. We conducted real-time mass spectrometry-based breath profiling in 708 non-preselected consecutive subjects in the screening scenario of a COVID-19 test center. Recruited subjects were grouped based on PCR-confirmed infection status and presence or absence of flu-like symptoms. Exhaled VOC profiles of SARS-CoV-2-positive cases (n = 36) differed from healthy (n = 256) and those with other respiratory infections (n = 416). Concentrations of most VOCs were suppressed in COVID-19. VOC concentrations also differed between symptomatic and asymptomatic cases. Breath markers mirror effects of infections onto host’s cellular metabolism and microbiome. Downregulation of specific VOCs was attributed to suppressive effects of SARS-CoV-2 onto gut or pulmonary microbial metabolism. Breath analysis holds potential for monitoring SARS-CoV-2 infections rather than for primary diagnosis. Breath profiling offers unconventional insight into host-virus cross-talk and infection microbiology and enables non-invasive assessment of disease manifestation.
Subject areas: Health sciences, Clinical finding, Metabolomics
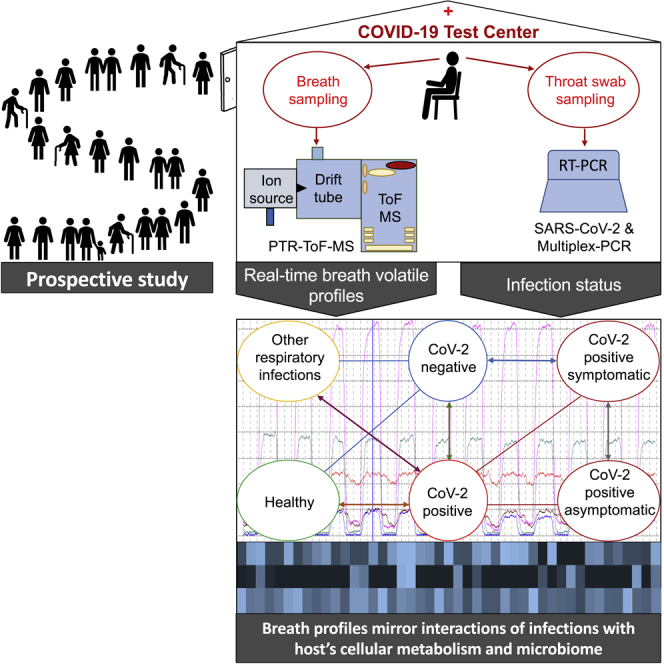
Graphical abstract
Highlights
-
•
VOC profiles of corona cases differed from healthy and other respiratory infections
-
•
Concentrations of most relevant VOCs were underexpressed in COVID-19 cases
-
•
VOC profiles are related to host’s response and effects of respiratory infections
-
•
Breath analysis is suitable for monitoring COVID-19 rather than for primary diagnosis
Health sciences; Clinical finding; Metabolomics;
Introduction
Even two years after the first emergence of the virus, the corona pandemic is still ongoing. Death toll is still menacingly high and health care systems worldwide are working at their very limits (Kenny and Mallon, 2021). One of the urgent problems in the fight against the pandemic is timely and early diagnosis to prevent the virus from spreading. Although commonly used PCR tests are sufficiently sensitive and antigen test are fast (Arevalo-Rodriguez et al., 2020; Tahamtan and Ardebili, 2020) and available at the point-of-care, knowledge on the disease and disease progression is still limited and additional monitoring procedures would be desirable.
Recent studies have proposed breath VOC-based tests as an alternative option for COVID-19 detection (Chen et al., 2021; Grassin-Delyle et al., 2021; Ibrahim et al., 2021, p. 19; Liangou et al., 2021). VOC-based complimentary information on virus infection mechanisms could enable detection of coronavirus infections. Results and proposed marker compounds of these pilot studies in pre-set patient cohorts are, however, divergent and the pilot setups often do not reflect realistic scenarios for COVID-19 screening.
In contrast to many other biomarkers, volatile organic compounds (VOCs) in exhaled breath may immediately mirror physiological (Sukul et al., 2017b, 2020, 2022a), metabolic (Sukul et al., 2018, 2021, 2022b), and pathological (Löser et al., 2020; Trefz et al., 2019a, 2019b) processes in the whole body. VOCs generated at the cellular level are transferred into the blood stream and exhaled within minutes after their generation. As VOC concentrations may change fast and pronouncedly depending on underlying mechanisms, repeated analysis of breath VOC patterns could provide additional and early information on infection processes (Lough et al., 2017). In a perspective, VOC monitoring could help to tailor therapy of viral infections and—in that way—help to minimize the risk of viral-bacterial co-infections.
Recent in vivo studies (in large animals—swine) have demonstrated the potential of VOC analysis for monitoring of influenza A infections (Traxler et al., 2018). Increase of viral load could be observed from breath profiles well before clinical symptoms occurred. Changes in VOC profiles can result from pathogens directly, from interactions between host and pathogen or also from immune response. As viruses do not have an own metabolism, potential VOC marker compounds must be related to the latter causes.
In vitro studies have confirmed the cellular origin of the observed biomarkers (Traxler et al., 2019). Infections caused by bacteria resulted in different VOC profiles (Ahmed et al., 2017; Korpi et al., 2009; Traxler et al., 2019). From these and other previous studies on bacterial infections, we know that VOC profiles show a very dynamic behavior and that concentrations of marker substances depend on growth/infection phases (i.e. elevated concentrations of VOC marker occur or disappear within hours or days).
The aim of this study was, therefore, to apply real-time breath profiling under conditions of a realistic screening scenario in a COVID-19 test center. To exclude confounding factors, the participants were not only screened for SARS-CoV-2 but also for other respiratory bacterial and/or viral infections.
Results
Figure 1 represents heat maps of relative differences in exhaled alveolar abundances between groups (A) and between subjects (B). Here, 1 (A) represents the mean (group wise) of normalized (onto corresponding maximum) values of VOCs in six groups viz. all SARS-CoV-2 positive, asymptomatic SARS-CoV-2 positive, symptomatic SARS-CoV-2 positive, all SARS-CoV-2 negative, SARS-CoV-2 negative with other respiratory pathogens, and SARS-CoV-2 negative healthy. 1 (B) represents the normalized (onto corresponding maximum) values of VOCs in 708 subjects who are either SARS-CoV-2 positive or SARS-CoV-2 negative with other respiratory pathogens and healthy. Selection criteria of VOCs are described in the STAR Methods section. Relative differences are observed within and/or between different groups and subjects.
Figure 1.

Heat maps showing relative differences in exhaled alveolar concentrations between groups (A) and between subjects (B)
Selection criteria of VOCs are described in the STAR Methods section. Relative differences were observed within and/or between different groups and subjects. As denoted via numeric range between 0.0 and 1.0 within the color scales, red and blue colors indicate relatively high and low values, respectively.
1 (A) represents the group wise mean of normalized (onto corresponding maximum) concentrations of VOCs in six groups viz. all CoV-2 positive, asymptomatic CoV-2 positive, symptomatic CoV-2 positive, all CoV-2 negative, CoV-2 negative with other respiratory pathogens (ORP), and CoV-2 negative healthy. X axis represents the six groups and Y axis represents normalized concentrations of protonated VOCs.
1 (B) represents normalized (onto corresponding maximum) concentrations of VOCs in 708 subjects who are either CoV-2 positive or CoV-2 negative with other respiratory pathogens and healthy. X axis represents normalized concentrations of protonated VOCs and Y axis represents subjects.
In order to elaborate the complex and heterogenous data set (Figure 1), the results of five different statistical comparisons (i.e. depicting queries: Q1 – Q5) between groups/cohorts are shown in Table 1. Demographic data from all subjects are presented in Table 2.
Table 1.
Results overview of different statistical evaluation queries
| Kruskal-Wallis-ANOVA on ranks (p value ≤0.05) | Q1 |
Q2 |
Q3 |
Q4 |
Q5 |
|---|---|---|---|---|---|
| n = 708 |
n = 697 |
n = 452 |
n = 292 |
n = 36 |
|
| 36 vs. 672 | 25 vs. 672 | 36 vs. 416 | 36 vs. 256 | 25 vs. 11 | |
| Exhaled VOCs | p values | ||||
| Formaldehyde | 0.281 | 0.648 | 0.859 | 0.017 | 0.440 |
| Methanol | 0.018 | 0.003 | 0.011 | 0.052 | 0.250 |
| Hydrogen sulphide | 0.012 | 0.000 | 0.003 | 0.116 | 0.010 |
| Acetone | 0.383 | 0.298 | 0.779 | 0.009 | 0.770 |
| Acetic acid | 0.043 | 0.018 | 0.007 | 0.385 | 0.264 |
| Isopropanol | 0.442 | 0.458 | 0.925 | 0.043 | 0.744 |
| Croton aldehyde | 0.035 | 0.041 | 0.017 | 0.122 | 0.744 |
| Butyric Acid | 0.000 | 0.003 | 0.000 | 0.002 | 0.548 |
| Butanethiol | 0.082 | 0.061 | 0.049 | 0.204 | 0.481 |
Kruskal-Wallis ANOVA on Ranks test for independent samples was performed between defined groups. Statistically significant differences in substance concentrations (p value ≤ 0.05) are marked in bold.
Table 2.
Demographic data
| All | Men | Women | |
|---|---|---|---|
| N° of subjects (%) | 708 | 355 (50.1) | 353 (49.9) |
| Age [years] (mean ± SD) | 39.3 ± 14.8 | 40.8 ± 14.7 | 37.8 ± 14.9 |
| N° of CoV-2-positive tested patients (%) | 36 | 14 (38.8) | 22 (61.1) |
| Age of CoV-2-positive tested patients [years] (mean ± SD) | 37.8 ± 15.1 | 40.3 ± 13.6 | 36.2 ± 16.1 |
Q1 resulted in 5 significantly different VOC concentrations, such as hydrogen sulfide, methanol, acetic acid, butyric acid, and crotonaldehyde. Exhaled concentrations of all five compounds were lower in COVID-19 participants. Figure 2A describes the statistically significant differences of these 5 alveolar VOC concentrations when corona-infected patients were compared to all other volunteers.
Figure 2.

Comparisons of differences (as per queries Q1–Q5 of Figure 4) in VOC concentrations between groups
Boxplots of exhaled alveolar VOC concentrations from different groups and corresponding room-air. Y axis shows substance concentrations in ppbV. Statistical significances were tested by means of Kruskal-Wallis-ANOVA on ranks (p value ≤0.05) and are indicated by # (expiration vs. expiration).
Figure 2A represents Q1. Boxplots of exhaled alveolar VOC concentrations from corona-positive (CoV-2 positive, n = 36) vs. all corona-negative individuals (CoV-2 negative, n = 672). X axis represents expiration of each group (Corona positive vs. Corona negative) as well as room air concentrations.
Figure 2B represents Q2. Exhaled alveolar VOC concentrations from symptomatic corona-positive (CoV-2 positive symptomatic, n = 25) vs. all corona-negative individuals (CoV-2 negative, n = 672). X axis represents expiration of each group (Corona positive symptomatic vs. Corona negative) as well as room air concentrations.
Figure 2C represents Q3. Exhaled alveolar VOC concentrations from corona-positive (CoV-2 positive, n = 36) vs. corona-negative individuals with other respiratory pathogens or symptoms (ORP) (CoV-2 negative with ORP, n = 416). X axis represents expiration of each group (Corona positive vs. Corona negative with ORP) as well as room air concentrations.
Figure 2D represents Q4. Exhaled alveolar VOC concentrations from corona-positive (CoV-2 positive, n = 36) vs. corona-negative individuals without any respiratory pathogens or symptoms (ORP) (CoV-2 negative, n = 256). X axis represents expiration of each group (Corona positive vs. Corona negative without ORP) as well as room air concentrations.
Figure 2E represents Q5. Exhaled alveolar VOC concentrations from symptomatic corona-positive (CoV-2 positive symptomatic, n = 25) vs. asymptomatic corona-positive individuals (CoV-2 positive asymptomatic, n = 11). X axis represents expiration of each group (Corona positive symptomatic vs. Corona positive asymptomatic) as well as room air concentrations.
For Q2 five substances, hydrogen sulfide, methanol, acetic and butyric acid, as well as crotonaldehyde showed significant differences in substance concentration levels. These five substances also match in their behavior, as of getting lower concentrations in the SARS-CoV-2-positive group. Boxplots of these 5 exhaled alveolar VOC concentrations from symptomatic patients with corona and all corona negative individuals are shown in Figure 2B.
Figure 2C shows the results of Q3 when VOC concentrations between SARS-CoV-2-positive volunteers were compared to the group of volunteers with respiratory pathogens and symptoms. Hereby, 6 significantly different substances could be observed, such as methanol, crotonaldehyde, acetic and butyric acid, and sulfur-containing compounds like butanethiol and hydrogen sulfide.
Figure 2D illustrates the significantly different substance concentrations of butyric acid, formaldehyde, acetone, and isopropanol discriminating between SARS-CoV-2 positive vs. the healthy group without respiratory pathogens (Q4). Formaldehyde, acetone, and isopropanol displayed higher exhaled concentrations in infected individuals, while exhaled concentrations of butyric acid were again lower.
The results of Q5 are shown in Figure 2E. Only exhaled concentrations of hydrogen sulfide differed significantly in this specific issue.
Expressions of endogenous VOCs based on low, medium, and high Ct values and results of statistical analyses are plotted in supplement (Figure S1). Clustering SARS-CoV-2-infected individuals according to high, medium, and low virus loads, we observed differences (p value <0.05) in dimethyl sulfide exhalation between cohorts with high and low Ct values. Correlation coefficients between VOCs of interest and Ct values and respective p values are presented in supplement (Table S1).
Discussion
In this study, 708 consecutive patients were prospectively analyzed in a corona test center. Based on PCR-confirmed infection status, Ct values, and presence or absence of flu-like symptoms, recruited subjects were grouped for further comparisons. In contrast to previous setups on breath VOC profiles and COVID-19, this is the first study on breath VOCs under realistic screening conditions. Exhaled breath composition of SARS-CoV-2-infected and non-infected subjects was characterized at the point-of-care via a real-time mass spectrometric method, adapted to the high safety conditions of the COVID-19 test center. Standard corona infection precautions were adhered to at any time of the study. There were not any adverse effects to participants or to medical staff carrying out the analyses.
In accordance with the population infection rate from October 2020 to February 2021 in Germany (Corona-Pandemie, 2020, pp. 2019–2022), 5.08% of the recruited subjects (36/708) were SARS-CoV-2 positive. Exhaled breath VOC profiles of SARS-CoV-2-infected patients differed from non-infected subjects. Most of the differing VOC concentrations were lower in infected cases than in healthy ones. Exhaled concentrations of various substance classes such as volatile sulfides, thiols, alcohols, acids, aldehydes, and ketones could be linked to responses of the host microbiome and immune response to infections. Our results are in line with recent metagenomic and biochemical reports on host metabolic and/or microbial changes and cross-talk under SARS-CoV-2 infection (Aouadi et al., 2016, p. 10; Enaud et al., 2020; Giron et al., 2021; Hussain et al., 2021; Kryukov et al., 2021; Magalhães et al., 2021; Soffritti et al., 2021; Wu et al., 2021; Yeoh et al., 2021, p. 19).
In contrast to other recent publications (Berna et al., 2021; Ibrahim et al., 2021; Liangou et al., 2021), we could not identify any positively expressed marker for SARS-CoV-2 infections. Considering that viruses do not have their own metabolism, it is not surprising that in terms of VOC exhalation virus infection impacts on volatiles usually produced by cells or bacteria. Due to their endogenous origin, these substances will always be present in human breath and their production can be expected to be suppressed through virus-cell or virus-microbiome interaction. Seen the variability of human breath composition and the huge number of volatile substances found in breath, it will always be possible to find differences between defined patient groups whenever a large number of parameters (i.e. exhaled substance concentrations) are used to seek for differences in a smaller number of independent measures by means of sophisticated statistical methods.
Our study was done in an actual prospective manner and represents a realistic screening scenario. Nevertheless, our results suggest that regardless of stage and severity of corona infection, host response to the virus induces a VOC profile characterized through diminished concentrations of microbiome or cell-dependent metabolites. Previous papers have reported a dynamic behavior of breath VOCs during SARS-CoV-2 infections but no direct correlation between VOC concentrations to viral load or to disease severity (Grassin-Delyle et al., 2021). In a precedent large animal model (Traxler et al., 2018, 2019) with H1N1, we could demonstrate that breath profiling holds great promise for monitoring viral infections rather than for primary diagnosis.
In order to assess the impact of other respiratory pathogens onto results, SARS-CoV-2-positive participants were compared with healthy controls having negative PCR results for corona and other respiratory pathogens. Infected individuals exhaled more formaldehyde, acetone and isopropanol and less butyric acid than the group without any respiratory pathogens. This suggests that the decrease of exhaled butyric acid may be characteristic for SARS-CoV-2 infections, while differences in concentrations of methanol, hydrogen sulfide, acetic acid, croton aldehyde, and butyric acid seem to be influenced by the presence of other viral or bacterial pathogens in the only SARS-CoV-2 negative control group.
A considerable proportion of exhaled volatile metabolites are contributed by the wide variety of microbiota residing within our respiratory and digestive tract. Substances such as volatile organosulfur, aliphatic alcohols, and short-chain fatty acids (SCFAs) are continuously sourced from those microbial metabolisms. For instance, oral cavity bacteria predominantly produce hydrogen sulfide (Sukul et al., 2017a; Tangerman, 2009). Within this setup, we observed high room-air concentrations of H2S throughout the study. This clearly indicates a mixed source of this substance in participant’s breath. Recent studies have indicated oral microbial dysbiosis and altered diversity due to immune/inflammatory response to SARS-CoV-2 infection (Soffritti et al., 2021; Wu et al., 2021). Despite having a steady source from the ambient air, significantly reduced breath H2S in the SARS-CoV-2-infected cohort supports the above metagenomic observations, and thereby denote a suppression of H2S-producing microbiota in the oral cavity.
Besides its dietary origin, methanol can be produced in vivo via gut microbial fermentation of pectin in lower gut and colon and from S-adenosylmethionine-driven pathways (Dorokhov et al., 2015; Siragusa et al., 1988). Here, decreased exhaled methanol concentrations in SARS-CoV-2-infected individuals when compared to the entire non-COVID-19 cohort indicate downregulation of those metabolic processes. This supports the recently reported alterations and dysbiosis of gut-microbiota in patients with COVID-19 (Magalhães et al., 2021; Yeoh et al., 2021) as well as the increased association and allosteric activation of plasma S-adenosylmethionine with IL-6 and glutathione due to hosts’ responses to coronavirus (Aouadi et al., 2016; Kryukov et al., 2021, p. 19). Above-indicated differences disappeared upon exclusion of non-COVID-19 subjects with other respiratory pathogens from the statistical comparison. Thus, the pathophysiological effects of SARS-CoV-2 on the gut and respiratory microbiota are different than that of other respiratory pathogens (Enaud et al., 2020). The expression of breath methanol also remained independent of disease symptoms.
Alike methanol, SCFAs such as acetic and butyric acid are also potentially produced by bacterial breakdown of dietary fibers and/or starch in the lower gut (Silva et al., 2020; Sukul et al., 2022b). Therefore, exhalation profiles of SCFAs behaved as methanol and they remained independent of symptoms.
Sulfur-reducing bacteria of the lower gut produce free/active thiol (-SH) as gasotransmitter (Linden, 2014; Tangerman, 2009) from anaerobic methylation. Those help to maintain the anaerobic environment of the gut and regulate nutrient absorption, membrane permeability, and host’s immune response (Singhal and Shah, 2020; Sukul et al., 2022a). Therefore, reduced butanethiol exhalation by SARS-CoV-2-infected subjects indicates dysbiosis of these bacteria (Yeoh et al., 2021, p. 19). In line with other reports (Abdulrahman et al., 2021, p. 19; Pawar et al., 2021, p. 19), the presence or absence of COVID-19 symptoms was not directly related to viral loads. Therefore, the negative correlation of exhaled dimethyl sulfide with viral loads (Table S1 and Figure S1) may indicate suppression of systemic microbial activity.
Breath aldehydes originate from both exogenous and/or endogenous sources. Formaldehyde is ubiquitous in clinical environment and observed exhaled profiles clearly reflect its higher inspiratory concentrations. Other studies reported elevated concentrations of potentially endogenous aldehydes in patients with COVID-19, and attributed that to increased oxidative stress (Berna et al., 2021; Grassin-Delyle et al., 2021). In our study, endogenous crotonaldehyde decreased significantly in SARS-CoV-2-infected cases. Underexpression of crotonaldehyde indicates a complex systemic cross-talk between intestinal-microbial (ethanol producing) dysbiosis, gut-permeability, intestinal glucose uptake, and hepatocellular glycolysis. Crotonaldehyde is generated through condensation of acetaldehyde molecules (Dick et al., 2016; Sukul et al., 2022a), which are produced via hepatic metabolism of ethanol by microsomal ethanol-oxidizing systems. Endogenous ethanol flux is largely regulated by microbial metabolism of carbohydrate in the small intestine in order to maintain healthy gut permeability (Elshaghabee et al., 2016) and optimal glucose uptake for cellular and hepatic glycolysis. As SARS-CoV-2 infection causes dysbiosis of intestinal flora and disrupts gut barrier integrity leading toward leaky gut (Giron et al., 2021; Hussain et al., 2021), it is likely to reduce upstream production of crotonaldehyde but to increase uptake of glucose. Consequently, the exhalation of the putative biproduct of hepatic and cellular glycolysis, i.e. acetone (Kalapos, 2003), increased significantly in the SARS-CoV-2-infected individuals, while compared to the healthy subjects. In line with our findings, elevated breath acetone concentrations in COVID-19 patients are also reported in a recent study (Ruszkiewicz et al., 2020). The higher expression of partly endogenous isopropanol (also partly inhaled from clinical environment) (Trefz et al., 2013) in the SARS-CoV-2-infected cohort can be attributed to the concomitant hyperglycemia-driven activation of polyol and hexosamine pathways (Rolo and Palmeira, 2006; Trefz et al., 2019b).
In contrast to previous studies with pre-selected patient groups, we executed a prospective observational study with realistic disease prevalence for screening scenarios. From the findings of these cross-sectional comparisons, we do not claim any “disease-specific biomarker(s)’ as this would require a validation of the findings in large, independent patient cohorts. Recent pilot studies (Berna et al., 2021; Chen et al., 2021; Ibrahim et al., 2021; Ruszkiewicz et al., 2020; Steppert et al., 2021) have applied “fitting” of already pre-processed data in small patient groups with very high disease prevalence to define predictive biomarker(s)/patterns for COVID-19 detection. This kind of approach certainly may lead to good virtual diagnostic values/models butwithout the required blinded validation of candidate marker changes in large independent patient cohorts in realistic diagnostic/screening scenarios—would have no practical or clinical relevance due to partial dependence/independence of the measured variables and effect of confounding factors (Bennett et al., 2009; Miekisch et al., 2012; Vul et al., 2009).
Our data however suggest that VOC profiles found during SARS-CoV-2 infections mirror interaction between virus and host factors such as cell metabolism and pulmonary and gut microbiome. Breath analysis, therefore, holds promise for monitoring corona infections rather than for primary diagnosis. Processes linked to virus invasion and replication can be monitored through a non-invasive window and valuable information beyond current microbiology on host-virus interplay can be gathered via VOC profiling.
Limitations of the study
Despite recruiting more than 700 subjects, the present study could only obtain a limited number of SARS-CoV-2-infected subjects. Observations may differ in another population/ethnicity under varying transmission rates, comorbidity, viral variants, and corresponding disease mechanisms/manifestation. In order to avoid any pre-selection bias within a realistic setting of a screening scenario, we did not consider external factors such as lifestyle, smoking habits, or comorbidities (and corresponding therapy) other than respiratory infections during recruitment or while grouping them into cohorts. These lead to broader variations of results if compared to previous studies with pre-selected patient groups (Chen et al., 2021; Grassin-Delyle et al., 2021; Ibrahim et al., 2021; Liangou et al., 2021). Sampling and analytical optimization/adjustment under high safety condition and associated confounding effects may further influence clinical interpretation of data. While there is a vast range of other clinical symptoms reported globally for COVID-19, within this study, we have considered only the flu-like symptoms (e.g. cold, fever, headache, runny nose, breathing difficulty, pneumonia etc.) during recruitment. Since viruses do not have an own metabolism, certain correlations between specific symptoms and VOCs may exist. Given the fact that we had obtained only 25 symptomatic subjects, the number was not enough to group our symptomatic subjects further according to symptom types and execute a valid correlation statistic between VOCs and symptoms in the COVID-19 group. In comparison to well-established PCR or antigen tests, VOC profiles cannot unequivocally be assigned to a certain respiratory disease or the presence or absence of COVID-19 in the participants. Due to the relatively low number of SARS-CoV-2-infected cases in our study, potential VOC profile changes for COVID-19 detection as well as effects of high, medium, and low viral loads on VOC profiles must be considered as trends rather than as final biomarker profiles.
STAR★Methods
Key resources table
| REAGENT or RESOURCE | SOURCE | IDENTIFIER |
|---|---|---|
| Chemicals, peptides, and recombinant proteins | ||
| Standard VOC mixture canisters | Ionicon Analytik | https://www.ionicon.com/ |
| Critical commercial assays | ||
| RT-qPCR test for Coronavirus 2019 nCoV assay | Seegene | https://www.seegene.com/ |
| RT-qPCR test (Multiplex) for respiratory viruses, Allplex, Resp. Panel 1A,2,3,4 | Seegene | https://www.seegene.com/ |
| Software and algorithms | ||
| TofDaq Viewer | TOFWERK | https://www.tofwerk.com/software/tofdaq/ |
| Breath Tracker, MATLAB v7.12.0.635, R2011a | MathWorks | https://www.mathworks.com/products/matlab.html |
| SPSS Sofrware v27 | IBM | https://www.ibm.com/analytics/spss-statistics-software |
| SigmaPlot v14 | SYSTAT | http://www.systat.de/SigmaPlot_Produktseite.html |
| PTR-MS viewer software | Ionicon Analytik | https://www.ionicon.com/ |
| Other | ||
| Mainstream HEPA-filter (Ultipor BB25G Hydrophobic filter, CE 0088, PALL | Pall Medical | https://www.pall.com/ |
| Side stream syringe filter (Sartorius PTFE 0.2 mm, 16596-HYK, Non-pyrogenic CE 1639, Minisart) | Sartorius | https://www.sartorius.com/ |
| PTR-ToF-MS-1000 | Ionicon Analytik | https://www.ionicon.com/ |
Resource availability
Lead contact
Further information and requests for resources should be directed to and will be fulfilled by the lead contact, Pritam Sukul (pritam.sukul@uni-rostock.de).
Materials availability
This study did not generate new unique reagents.
Experimental model and subject details
Ethics and human subjects
After obtaining ethical approval by the institutional ethics committee (IEC) of Rostock University Medical Centre (approval No: A 2020 0085, date of permission 17th April 2020) and after having obtained signed informed consent, 708 non-preselected subjects were enrolled from the COVID-19 test centre of our university. Participants were enrolled consecutively at randomly chosen (working) days during the study period (10.2020 – 01.2021). Recruitments were conducted each day between 9.00 am in the morning until 1.00 pm in the afternoon (i.e. 4 h/day). The single centre prospective observational study was carried out in accordance with the amended ‘Declaration of Helsinki’ guidelines. Demographic data from 708 subjects (355 males, 353 females) are shown in Table 2.
Experimental setup
Experiments were carried out at the Corona test centre without hampering or delaying the screening process. Standard Corona infection precautions were adhered to at all time of the study. There were no adverse effects to participants or to medical staff carrying out the analyses. Breath samples were taken in a prospective way from non-preselected subjects. SARS-CoV-2 infection and presence of other respiratory pathogens were determined by means of the RT-qPCR test and by means of a commercially available standardized Multiplex PCR test, respectively. The RT-qPCR cycle threshold (Ct) values in SARS-CoV-2 positive cases were also recorded in order to qualitatively estimate viral loads (Al Bayat et al., 2021; Walker et al., 2021) in throat swab samples.
In order to perform breath sampling under high safety conditions, a room divider (150 cm × 225 cm) made of plexiglass was placed between patient and investigator(s). In addition, two different virus filters were applied: a mainstream HEPA-filter (Ultipor BB25G Hydrophobic filter, CE 0088, PALL®, Pall Medical, NY, USA) and a side stream syringe filter (Sartorius PTFE 0.2 μm, 16596-HYK, Non-pyrogenic CE 1639, Minisart®, Göttingen, Germany). The mainstream HEPA filter (blue, cornered) was placed at the rare-end of the breathing mouthpiece to avoid contaminations of the room air and the side-stream syringe filter (white, round) was applied at the transfer line of the PTR-ToF-MS to avoid viral contamination to the instrument (Figure S2). All disposable materials such as mainstream and side-stream filters, connectors, tube coating (Tube sleeve, OMNIA®, Fidenza, Italy) were replaced after single use. After each measurement the participant’s chair was disinfected and the room was aired/vented frequently to minimize the risk of infection. The detailed sampling setup and methods are available elsewhere (Sukul et al., 2022c).
Breath sampling protocol
Volunteers wore a face-mask and rested in sitting position on a chair for at least 5 min before breath sampling. Breath samples were collected from patients in sitting position (Sukul et al., 2015). Volunteers were asked to remove the face mask and perform normal breathing (i.e. inspiration and expiration) via mouth (Sukul et al., 2017a) into the sterile mouthpiece (T-piece, Intersurgical GmbH, Sankt Augustin, Germany) for 3 min. The transfer line of the PTR-ToF-MS was connected to the sterile mouthpiece in a side-stream mode just after the syringe filter, which continuously sampled (at sampling flow of 100 mL/min) exhaled breath and inspiratory room-air in real-time. The HEPA filter introduced minimal breathing resistance (Sukul et al., 2022c).
Method details
PTR-ToF-MS measurements of breath VOCs
Breath VOCs were measured continuously via a PTR-ToF-MS 1000 (Ionicon Analytik GmbH, Innsbruck, Austria) and with pre-optimized experimental conditions (Herbig et al., 2009; Sukul et al., 2014). Therefore, a continuous side-stream mode of sampling was applied via a 6 m long heated (at 100°C) silico-steel transfer-line connected to a sterile mouthpiece via a side-stream filter. A continuous sampling flow of 100 mL/min and a time resolution of the PTR-ToF-MS measurements of 200 ms were used. Drift tube temperature was set to 75°C, voltage was 610 V and the pressure was 2.3 mbar. The resulting E/N ratio was 139 Td. After every minute a new data file was recorded automatically and the mass scale was recalibrated after each run (60 s). We used the following masses for mass calibration: 21.0226 (H3O+-Isotope), 29.9980 (NO+) and 59.049 (C3H6O).
VOC data processing
VOCs were measured in counts per seconds (cps) and corresponding intensities were normalised onto primary ion (H3O+) counts. Raw data were processed via PTR-MS viewer software (version 3.228). As PTR-MS continuously records both exhaled breath and inhaled room-air, the ‘breath tracker’ algorithm (based on Matlab version 7.12.0.635, R2011a) was applied to identify expiratory and inspiratory phases (Sukul et al., 2014). Here, acetone (an endogenous substance) was used as the tracker mass, which has significantly higher signal intensity in expiration than in inhalation. Room air was also measured separately at 15 min intervals.
As the mass resolution of PTR-ToF-MS (1000–2000 m/Δm) can assign volatiles upon their measured mass and corresponding sum formula with high precision (Sukul et al., 2017a), compound names are used while discussing results. Identification of the VOCs presented in this study is relatively certain as they fall into lower mass range and typical compounds known to appear in breath from exogenous (e.g. formaldehyde, benzene, toluene, acetonitrile, furan, monoterpenes etc.) and endogenous (e.g. hemiterpenes, ketone, SCFAs, aldehydes, alcohols and organosulfur etc.) sources. Most of these substances are confirmed within previous method validation studies via GC-MS. VOCs were partly quantified via reaction rate coefficients (k-rates) between VOC and H3O+ (Cappellin et al., 2012) that are calculated at the E/N ratio of 140 Th and partly confirmed via multi-component mixture of matrix adapted standard reference substances. Quantification process using standard VOC mixtures under adapted sample humidity (as in exhaled breath) was carried out with a liquid calibration unit (LCU, Ionicon Analytik GmbH, Innsbruck, Austria) (Trefz et al., 2018). Substances calibrated by reference VOC standards are namely: formaldehyde, acetaldehyde, crotonaldehyde, acrolein, butanal, pentanal, hexanal, methanol, ethanol, isopropanol, acetone, isoprene, dimethyl sulfide, butanone, benzene, toluene, xylene, alpha-pinene and limonene.
As the absolute quantification of substances like H2S is challenging due to the retraction equilibrium within the drift tube, the humidity of the sample may affect results (Feilberg et al., 2010). Relative humidity (RH) in the room air may vary based on geographical and physical variations (Mansour et al., 2020). As all our measurements were performed at the same room in a controlled environment, we could not observe any significant variation (<5%) in ambient room air humidity. As exhaled breath is always a water saturated (100% RH) matrix, the humidity in expiratory samples is not affected by inhaled humidity.
Details of PTR-ToF-MS calibration
To consider all possible effects of humidity onto quantitative values, VOCs in different concentrations and under different sample humidity were analysed for calibration (Trefz et al., 2018). The influence of humidity on VOCs intensities, calibrations and LOD/LOQ was critically evaluated. Moreover, normalization to H3O+ along with H3O+ in combination with hydrated H3O+ ions (water clusters) was compared. The effects of RH of 100% was investigated under the breath conditions. Calibrations with different amounts of humidity were analyzed for all substances over a concentration range at around 2–100 ppbV. The exact concentrations vary slightly between different VOCs, due to their actual concentrations within the undiluted gas standard. Six concentrations were measured (2, 5, 10, 25, 50 and 100 ppbV). By applying LCU water flow of 0, 1, 13, 25 and 30 μL/min (at operating temperature of 75°C), humidity was verified in five steps between 0, 1, 12.8, 24.2 and 47 g/m3, which correspond to relative humidity of 0%, 2%, 30%, 55% and 107% at 37°C. LCU gas flow (nitrogen and VOCs standard) was kept constant at 1000 sccm. Two replicates were measured for each concentration and humidity levels. Two blanks were also measured for each test.
Selection of VOCs for analysis
Different criteria were used to select compounds of interest. Compounds with well-known exogenous origin were excluded from further analysis and VOCs with concentrations below LOD (limit of detection, mean of blank +3 SD) were excluded from statistical analysis. In this way, 45 remaining compounds of interest were quantified in subject’s breath.
Quantification and statistical analysis
Analysis of variance (ANOVA) was applied to determine the sample size. In order to detect even less than 5% differences in exhaled VOCs at trace concentration levels, a minimum detectable difference in mean substance intensities of 350 cps and a standard deviation of 275 was estimated. To attain an alpha value of 0.005 and a test power of 0.99, while considering a population of 100,000, the case group size resulted at 35. Given the expected/observed occurrence of infected and/or symptomatic cases in the Rostock region (Mecklenburg-Vorpommern, Germany), we had included 708 subjects and achieved 36 COVID-19 positive cases.
Mean values of VOC concentrations from each participant were calculated over each minute of breath-resolved measurement. Data from every 2nd minute were included for statistical analysis. Statistically significant differences between exhaled VOC concentrations in different cohorts were assessed by Kruskal-Wallis ANOVA on ranks test for independent samples (p value ≤0.05) in SigmaPlot (v. 14).
In order to qualify our data five different statistical evaluation queries were processed (Figure S3). First and most importantly we investigated Q1 with SARS-CoV-2 positive (36/708; 5,1%) versus all SARS-CoV-2 negative participants (672/708; 94,9%). Secondly, we examined an additional Q2 to inspect the role of symptoms and the immune system. Hereby, SARS-CoV-2 positive participants with symptoms (25/697; 3,6%) were compared with all SARS-CoV-2 negative participants (672/697; 96,4%). In the next step we were interested in the influence of other respiratory pathogens onto the VOC profiles and made a comparison (Q3) between participants with respiratory pathogens or symptoms (416/452; 92.1%) and SARS-CoV-2 positive participants (36/452; 7.9%). In addition, we investigated Q4 with COVID-19 positive participants (36/292; 12.3%) versus the healthy control group (256/292; 87.7%). This healthy control group (n = 256) was defined by a negative COVID-19 test, negative PCR test on respiratory pathogens, provided by commercially available standardized Multiplex PCR test from the Laboratory of the University of Rostock, and no flu like symptoms. In order to confirm these findings, we compared (Q5) between SARS-CoV-2 positive participants with (25/36; 69,44%) and without (11/36; 30,56%) symptoms.
Finally, we compared SARS-CoV-2 positive participants based on low (≤24), medium (25–30) and high (31–39) Ct values via one-way ANOVA(Dunn’s post-hoc method, p value ≤0.05) test. In order to understand the correlations between differentially expressed VOCs and Ct values, a dimension reduction factor analysis (Factor extraction via principal components method, factor scores via regression method and 1-tailed significance at p value ≤ 0.05) was performed in SPSS (v. 27).
Acknowledgments
The authors would like to thank all physicians and medical staff from the COVID-19 test center and all members from the ROMBAT group for their valuable support during the sampling procedures.
The study was supported by European Union’s Regional Development Fund (EFRE) (J.K. Schubert and W. Miekisch), H2020-EU-ITN-IMPACT Marie Skłodowska-Curie grant (IMPACT. 674911) (J.K. Schubert and W. Miekisch) and the Inno-INDIGO-NCDs-CAPomics Project (BMBF 01DQ16010) (J.K. Schubert and W. Miekisch). Funders had no role in the design, data collection, analysis, interpretation, manuscript preparations, or decision to submit the manuscript for publication.
Author contributions
J.K.S. and W.M. conceived the idea and supervised the entire project. P.T., R.R., A.C.K., P.F., and P.S. contributed to the conception and study design. P.S., P.T., R.R., A.C.K., P.F., J.K.S., and W.M. optimized methods for high safety condition. R.R., N.K., L.R., and J.B. recruited subjects and carried out measurements. P.T., R.R., N.K., J.B., P.F., J.K.S., and P.S. executed data analysis. R.R., P.F. L.R., and P.S. prepared the results. W.M., P.F., and J.K.S. administered the project. W.M. and J.K.S. provided all resources. L.R., P.T., P.F., P.S., and J.K.S. performed statistical analysis. P.T., R.R., P.F., W.M., P.S., and J.K.S. did analytical, clinical interpretations and validation of data. J.K.S., P.S., R.R., J.B., P.F., and W.M. prepared the original draft. All authors certify that they have participated sufficiently in this work to take public responsibility for the content, including participation in the concept, design, analysis, writing, or revision of the manuscript. All authors have read the journal’s authorship agreement, reviewed, and approved the manuscript.
Declaration of interests
The authors declare no competing interests.
Published: October 21, 2022
Footnotes
Supplemental information can be found online at https://doi.org/10.1016/j.isci.2022.105195.
Supplemental information
Data and code availability
-
•
The data are available upon reasonable request by contacting the lead contact.
-
•
No new code was generated during the course of this study.
-
•
Any additional information required to reanalyse the data reported in this paper is available from the lead contact upon request.
References
- Abdulrahman A., Mallah S.I., Alqahtani M. COVID-19 viral load not associated with disease severity: findings from a retrospective cohort study. BMC Infect. Dis. 2021;21:688. doi: 10.1186/s12879-021-06376-1. [DOI] [PMC free article] [PubMed] [Google Scholar]
- Ahmed W.M., Lawal O., Nijsen T.M., Goodacre R., Fowler S.J. Exhaled volatile organic compounds of infection: a systematic review. ACS Infect. Dis. 2017;3:695–710. doi: 10.1021/acsinfecdis.7b00088. [DOI] [PubMed] [Google Scholar]
- Al Bayat S., Mundodan J., Hasnain S., Sallam M., Khogali H., Ali D., Alateeg S., Osama M., Elberdiny A., Al-Romaihi H., Al-Thani M.H.J. Can the cycle threshold (Ct) value of RT-PCR test for SARS CoV2 predict infectivity among close contacts? J. Infect. Public Health. 2021;14:1201–1205. doi: 10.1016/j.jiph.2021.08.013. [DOI] [PMC free article] [PubMed] [Google Scholar]
- Aouadi W., Blanjoie A., Vasseur J.-J., Debart F., Canard B., Decroly E. Binding of the methyl donor S-Adenosyl-l-Methionine to Middle East respiratory syndrome Coronavirus 2′-O-methyltransferase nsp16 promotes recruitment of the allosteric activator nsp10. J. Virol. 2016;91 doi: 10.1128/JVI.02217-16. 022177-e2316. [DOI] [PMC free article] [PubMed] [Google Scholar]
- Arevalo-Rodriguez I., Buitrago-Garcia D., Simancas-Racines D., Zambrano-Achig P., Del Campo R., Ciapponi A., Sued O., Martinez-García L., Rutjes A.W., Low N., et al. False-negative results of initial RT-PCR assays for COVID-19: a systematic review. PLoS One. 2020;15:e0242958. doi: 10.1371/journal.pone.0242958. [DOI] [PMC free article] [PubMed] [Google Scholar]
- Bennett C., Miller M., Wolford G. Neural correlates of interspecies perspective taking in the post-mortem Atlantic Salmon: an argument for multiple comparisons correction. Neuroimage. 2009;47:S125. doi: 10.1016/S1053-8119(09)71202-9. [DOI] [Google Scholar]
- Berna A.Z., Akaho E.H., Harris R.M., Congdon M., Korn E., Neher S., M’Farrej M., Burns J., Odom John A.R. Reproducible breath metabolite changes in children with SARS-CoV-2 infection. ACS Infect. Dis. 2021;7:2596–2603. doi: 10.1021/acsinfecdis.1c00248. [DOI] [PMC free article] [PubMed] [Google Scholar]
- Cappellin L., Karl T., Probst M., Ismailova O., Winkler P.M., Soukoulis C., Aprea E., Märk T.D., Gasperi F., Biasioli F. On quantitative determination of volatile organic compound concentrations using proton transfer reaction time-of-flight mass spectrometry. Environ. Sci. Technol. 2012;46:2283–2290. doi: 10.1021/es203985t. [DOI] [PubMed] [Google Scholar]
- Chen H., Qi X., Zhang L., Li X., Ma J., Zhang C., Feng H., Yao M. COVID-19 screening using breath-borne volatile organic compounds. J. Breath Res. 2021;15 doi: 10.1088/1752-7163/ac2e57. [DOI] [PubMed] [Google Scholar]
- Corona-Pandemie (COVID-19) 2019-2022 [WWW Document], (2020). Statista. URL https://de.statista.com/statistik/studie/id/71015/dokument/corona-pandemie-2019-20/
- Dick M., Hartmann R., Weiergräber O.H., Bisterfeld C., Classen T., Schwarten M., Neudecker P., Willbold D., Pietruszka J. Mechanism-based inhibition of an aldolase at high concentrations of its natural substrate acetaldehyde: structural insights and protective strategies. Chem. Sci. 2016;7:4492–4502. doi: 10.1039/C5SC04574F. [DOI] [PMC free article] [PubMed] [Google Scholar]
- Dorokhov Y.L., Shindyapina A.V., Sheshukova E.V., Komarova T.V. Metabolic methanol: molecular pathways and physiological roles. Physiol. Rev. 2015;95:603–644. doi: 10.1152/physrev.00034.2014. [DOI] [PubMed] [Google Scholar]
- Elshaghabee F.M.F., Bockelmann W., Meske D., de Vrese M., Walte H.-G., Schrezenmeir J., Heller K.J. Ethanol production by selected intestinal microorganisms and lactic acid bacteria growing under different nutritional conditions. Front. Microbiol. 2016;7:47. doi: 10.3389/fmicb.2016.00047. [DOI] [PMC free article] [PubMed] [Google Scholar]
- Enaud R., Prevel R., Ciarlo E., Beaufils F., Wieërs G., Guery B., Delhaes L. The gut-lung Axis in health and respiratory diseases: a place for inter-organ and inter-kingdom crosstalks. Front. Cell. Infect. Microbiol. 2020;10:9. doi: 10.3389/fcimb.2020.00009. [DOI] [PMC free article] [PubMed] [Google Scholar]
- Feilberg A., Liu D., Adamsen A.P.S., Hansen M.J., Jonassen K.E.N. Odorant emissions from intensive pig production measured by online proton-transfer-reaction mass spectrometry. Environ. Sci. Technol. 2010;44:5894–5900. doi: 10.1021/es100483s. [DOI] [PubMed] [Google Scholar]
- Giron L.B., Dweep H., Yin X., Wang H., Damra M., Goldman A.R., Gorman N., Palmer C.S., Tang H.-Y., Shaikh M.W., et al. Plasma markers of disrupted gut permeability in severe COVID-19 patients. Front. Immunol. 2021;12:686240. doi: 10.3389/fimmu.2021.686240. [DOI] [PMC free article] [PubMed] [Google Scholar]
- Grassin-Delyle S., Roquencourt C., Moine P., Saffroy G., Carn S., Heming N., Fleuriet J., Salvator H., Naline E., Couderc L.-J., et al. Garches COVID-19 Collaborative Group RECORDS Collaborators and Exhalomics® Collaborators Metabolomics of exhaled breath in critically ill COVID-19 patients: a pilot study. EBioMedicine. 2021;63:103154. doi: 10.1016/j.ebiom.2020.103154. [DOI] [PMC free article] [PubMed] [Google Scholar]
- Herbig J., Müller M., Schallhart S., Titzmann T., Graus M., Hansel A. On-line breath analysis with PTR-TOF. J. Breath Res. 2009;3:027004. doi: 10.1088/1752-7155/3/2/027004. [DOI] [PubMed] [Google Scholar]
- Hussain I., Cher G.L.Y., Abid M.A., Abid M.B. Role of gut microbiome in COVID-19: an insight into pathogenesis and therapeutic potential. Front. Immunol. 2021;12:765965. doi: 10.3389/fimmu.2021.765965. [DOI] [PMC free article] [PubMed] [Google Scholar]
- Ibrahim W., Cordell R.L., Wilde M.J., Richardson M., Carr L., Sundari Devi Dasi A., Hargadon B., Free R.C., Monks P.S., Brightling C.E., et al. Diagnosis of COVID-19 by exhaled breath analysis using gas chromatography–mass spectrometry. ERJ Open Res. 2021;7:00139–02021. doi: 10.1183/23120541.00139-2021. [DOI] [PMC free article] [PubMed] [Google Scholar]
- Kalapos M.P. On the mammalian acetone metabolism: from chemistry to clinical implications. Biochim. Biophys. Acta. 2003;1621:122–139. doi: 10.1016/s0304-4165(03)00051-5. [DOI] [PubMed] [Google Scholar]
- Kenny G., Mallon P.W. COVID19- clinical presentation and therapeutic considerations. Biochem. Biophys. Res. Commun. 2021;538:125–131. doi: 10.1016/j.bbrc.2020.11.021. [DOI] [PMC free article] [PubMed] [Google Scholar]
- Korpi A., Järnberg J., Pasanen A.-L. Microbial volatile organic compounds. Crit. Rev. Toxicol. 2009;39:139–193. doi: 10.1080/10408440802291497. [DOI] [PubMed] [Google Scholar]
- Kryukov E.V., Ivanov A.V., Karpov V.O., Vasil’evich Aleksandrin V., Dygai A.M., Kruglova M.P., Kostiuchenko G.I., Kazakov S.P., Kubatiev A.A. Plasma S-adenosylmethionine is associated with lung injury in COVID-19. Dis. Markers. 2021;2021:7686374. doi: 10.1155/2021/7686374. [DOI] [PMC free article] [PubMed] [Google Scholar]
- Liangou A., Tasoglou A., Huber H.J., Wistrom C., Brody K., Menon P.G., Bebekoski T., Menschel K., Davidson-Fiedler M., DeMarco K., et al. A method for the identification of COVID-19 biomarkers in human breath using Proton Transfer Reaction Time-of-Flight Mass Spectrometry. EClinicalMedicine. 2021;42:101207. doi: 10.1016/j.eclinm.2021.101207. [DOI] [PMC free article] [PubMed] [Google Scholar]
- Linden D.R. Hydrogen sulfide signaling in the gastrointestinal tract. Antioxidants Redox Signal. 2014;20:818–830. doi: 10.1089/ars.2013.5312. [DOI] [PMC free article] [PubMed] [Google Scholar]
- Löser B., Grabenschröer A., Pugliese G., Sukul P., Trefz P., Schubert J.K., Miekisch W. Changes of exhaled volatile organic compounds in postoperative patients undergoing analgesic treatment: a prospective observational study. Metabolites. 2020;10:321. doi: 10.3390/metabo10080321. [DOI] [PMC free article] [PubMed] [Google Scholar]
- Lough F., Perry J.D., Stanforth S.P., Dean J.R. Detection of exogenous VOCs as a novel in vitro diagnostic technique for the detection of pathogenic bacteria. TrAC, Trends Anal. Chem. 2017;87:71–81. doi: 10.1016/j.trac.2016.12.004. [DOI] [Google Scholar]
- Magalhães N.S., Savino W., Silva P.M.R., Martins M.A., Carvalho V.F. Gut microbiota dysbiosis is a crucial player for the poor outcomes for COVID-19 in elderly, diabetic and hypertensive patients. Front. Med. 2021;8:644751. doi: 10.3389/fmed.2021.644751. [DOI] [PMC free article] [PubMed] [Google Scholar]
- Mansour E., Vishinkin R., Rihet S., Saliba W., Fish F., Sarfati P., Haick H. Measurement of temperature and relative humidity in exhaled breath. Sensor. Actuator. B Chem. 2020;304:127371. doi: 10.1016/j.snb.2019.127371. [DOI] [Google Scholar]
- Miekisch W., Herbig J., Schubert J.K. Data interpretation in breath biomarker research: pitfalls and directions. J. Breath Res. 2012;6:036007. doi: 10.1088/1752-7155/6/3/036007. [DOI] [PubMed] [Google Scholar]
- Pawar R.D., Balaji L., Mehta S., Cole A., Liu X., Peradze N., Grossestreuer A.V., Issa M.S., Patel P., Kirby J.E., et al. Viral load and disease severity in COVID-19. Intern. Emerg. Med. 2021;17:359–367. doi: 10.1007/s11739-021-02786-w. [DOI] [PMC free article] [PubMed] [Google Scholar]
- Rolo A.P., Palmeira C.M. Diabetes and mitochondrial function: role of hyperglycemia and oxidative stress. Toxicol. Appl. Pharmacol. 2006;212:167–178. doi: 10.1016/j.taap.2006.01.003. [DOI] [PubMed] [Google Scholar]
- Ruszkiewicz D.M., Sanders D., O’Brien R., Hempel F., Reed M.J., Riepe A.C., Bailie K., Brodrick E., Darnley K., Ellerkmann R., et al. Diagnosis of COVID-19 by analysis of breath with gas chromatography-ion mobility spectrometry - a feasibility study. EClinicalMedicine. 2020;29:100609. doi: 10.1016/j.eclinm.2020.100609. [DOI] [PMC free article] [PubMed] [Google Scholar]
- Silva Y.P., Bernardi A., Frozza R.L. The role of short-chain fatty acids from gut microbiota in gut-brain communication. Front. Endocrinol. 2020;11:25. doi: 10.3389/fendo.2020.00025. [DOI] [PMC free article] [PubMed] [Google Scholar]
- Singhal R., Shah Y.M. Oxygen battle in the gut: hypoxia and hypoxia-inducible factors in metabolic and inflammatory responses in the intestine. J. Biol. Chem. 2020;295:10493–10505. doi: 10.1074/jbc.REV120.011188. [DOI] [PMC free article] [PubMed] [Google Scholar]
- Siragusa R.J., Cerda J.J., Baig M.M., Burgin C.W., Robbins F.L. Methanol production from the degradation of pectin by human colonic bacteria. Am. J. Clin. Nutr. 1988;47:848–851. doi: 10.1093/ajcn/47.5.848. [DOI] [PubMed] [Google Scholar]
- Soffritti I., D’Accolti M., Fabbri C., Passaro A., Manfredini R., Zuliani G., Libanore M., Franchi M., Contini C., Caselli E. Oral microbiome dysbiosis is associated with symptoms severity and local immune/inflammatory response in COVID-19 patients: a cross-sectional study. Front. Microbiol. 2021;12:687513. doi: 10.3389/fmicb.2021.687513. [DOI] [PMC free article] [PubMed] [Google Scholar]
- Steppert C., Steppert I., Sterlacci W., Bollinger T. Rapid detection of SARS-CoV-2 infection by multicapillary column coupled ion mobility spectrometry (MCC-IMS) of breath. A proof of concept study. J. Breath Res. 2021;15:027105. doi: 10.1088/1752-7163/abe5ca. [DOI] [PubMed] [Google Scholar]
- Sukul P., Bartels J., Fuchs P., Trefz P., Remy R., Rührmund L., Kamysek S., Schubert J.K., Miekisch W. Effects of COVID-19 protective face-masks and wearing durations onto respiratory-haemodynamic physiology and exhaled breath constituents. Eur. Respir. J. 2022;60:2200009. doi: 10.1183/13993003.00009-2022. [DOI] [PMC free article] [PubMed] [Google Scholar]
- Sukul P., Grzegorzewski S., Broderius C., Trefz P., Mittlmeier T., Fischer D.-C., Miekisch W., Schubert J.K. Physiological and metabolic effects of healthy female aging on exhaled breath biomarkers. iScience. 2022;25:103739. doi: 10.1016/j.isci.2022.103739. [DOI] [PMC free article] [PubMed] [Google Scholar]
- Sukul P., Oertel P., Kamysek S., Trefz P. Oral or nasal breathing? Real-time effects of switching sampling route onto exhaled VOC concentrations. J. Breath Res. 2017;11:027101. doi: 10.1088/1752-7163/aa6368. [DOI] [PubMed] [Google Scholar]
- Sukul P., Richter A., Schubert J.K., Miekisch W. Deficiency and absence of endogenous isoprene in adults, disqualified its putative origin. Heliyon. 2021;7:e05922. doi: 10.1016/j.heliyon.2021.e05922. [DOI] [PMC free article] [PubMed] [Google Scholar]
- Sukul P., Schubert J.K., Kamysek S., Trefz P., Miekisch W. Applied upper-airway resistance instantly affects breath components: a unique insight into pulmonary medicine. J. Breath Res. 2017;11:047108. doi: 10.1088/1752-7163/aa8d86. [DOI] [PubMed] [Google Scholar]
- Sukul P., Schubert J.K., Trefz P., Miekisch W. Natural menstrual rhythm and oral contraception diversely affect exhaled breath compositions. Sci. Rep. 2018;8:10838. doi: 10.1038/s41598-018-29221-z. [DOI] [PMC free article] [PubMed] [Google Scholar]
- Sukul P., Schubert J.K., Zanaty K., Trefz P., Sinha A., Kamysek S., Miekisch W. Exhaled breath compositions under varying respiratory rhythms reflects ventilatory variations: translating breathomics towards respiratory medicine. Sci. Rep. 2020;10:14109. doi: 10.1038/s41598-020-70993-0. [DOI] [PMC free article] [PubMed] [Google Scholar]
- Sukul P., Trefz P., Kamysek S., Schubert J.K., Miekisch W. Instant effects of changing body positions on compositions of exhaled breath. J. Breath Res. 2015;9:047105. doi: 10.1088/1752-7155/9/4/047105. [DOI] [PubMed] [Google Scholar]
- Sukul P., Trefz P., Schubert J., Miekisch W. Advanced Setup for Safe Breath Sampling and Patient Monitoring under Highly Infectious Conditions in the Clinical Environment. 2022. [DOI] [PMC free article] [PubMed]
- Sukul P., Trefz P., Schubert J.K., Miekisch W. Immediate effects of breath holding maneuvers onto composition of exhaled breath. J. Breath Res. 2014;8:037102. doi: 10.1088/1752-7155/8/3/037102. [DOI] [PubMed] [Google Scholar]
- Tahamtan A., Ardebili A. Real-time RT-PCR in COVID-19 detection: issues affecting the results. Expert Rev. Mol. Diagn. 2020;20:453–454. doi: 10.1080/14737159.2020.1757437. [DOI] [PMC free article] [PubMed] [Google Scholar]
- Tangerman A. Measurement and biological significance of the volatile sulfur compounds hydrogen sulfide, methanethiol and dimethyl sulfide in various biological matrices. J. Chromatogr. B Analyt. Technol. Biomed. Life Sci. 2009;877:3366–3377. doi: 10.1016/j.jchromb.2009.05.026. [DOI] [PubMed] [Google Scholar]
- Traxler S., Barkowsky G., Saß R., Klemenz A.-C., Patenge N., Kreikemeyer B., Schubert J.K., Miekisch W. Volatile scents of influenza A and S. pyogenes (co-)infected cells. Sci. Rep. 2019;9:18894. doi: 10.1038/s41598-019-55334-0. [DOI] [PMC free article] [PubMed] [Google Scholar]
- Traxler S., Bischoff A.-C., Saß R., Trefz P., Gierschner P., Brock B., Schwaiger T., Karte C., Blohm U., Schröder C., et al. VOC breath profile in spontaneously breathing awake swine during Influenza A infection. Sci. Rep. 2018;8:14857. doi: 10.1038/s41598-018-33061-2. [DOI] [PMC free article] [PubMed] [Google Scholar]
- Trefz P., Obermeier J., Lehbrink R., Schubert J.K., Miekisch W., Fischer D.-C. Exhaled volatile substances in children suffering from type 1 diabetes mellitus: results from a cross-sectional study. Sci. Rep. 2019;9:15707. doi: 10.1038/s41598-019-52165-x. [DOI] [PMC free article] [PubMed] [Google Scholar]
- Trefz P., Schmidt M., Oertel P., Obermeier J., Brock B., Kamysek S., Dunkl J., Zimmermann R., Schubert J.K., Miekisch W. Continuous real time breath gas monitoring in the clinical environment by proton-transfer-reaction-time-of-flight-mass spectrometry. Anal. Chem. 2013;85:10321–10329. doi: 10.1021/ac402298v. [DOI] [PubMed] [Google Scholar]
- Trefz P., Schmidt S.C., Sukul P., Schubert J.K., Miekisch W., Fischer D.-C. Non-invasive assessment of metabolic adaptation in paediatric patients suffering from type 1 diabetes mellitus. J. Clin. Med. 2019;8:E1797. doi: 10.3390/jcm8111797. [DOI] [PMC free article] [PubMed] [Google Scholar]
- Trefz P., Schubert J.K., Miekisch W. Effects of humidity, CO2 and O2 on real-time quantitation of breath biomarkers by means of PTR-ToF-MS. J. Breath Res. 2018;12:026016. doi: 10.1088/1752-7163/aa9eea. [DOI] [PubMed] [Google Scholar]
- Vul E., Harris C., Winkielman P., Pashler H. Puzzlingly high correlations in fMRI studies of emotion, personality, and social cognition. Perspect. Psychol. Sci. 2009;4:274–290. doi: 10.1111/j.1745-6924.2009.01125.x. [DOI] [PubMed] [Google Scholar]
- Walker A.S., Pritchard E., House T., Robotham J.V., Birrell P.J., Bell I., Bell J.I., Newton J.N., Farrar J., Diamond I., et al. COVID-19 Infection Survey team. COVID-19 Infection Survey team Ct threshold values, a proxy for viral load in community SARS-CoV-2 cases, demonstrate wide variation across populations and over time. Elife. 2021;10:e64683. doi: 10.7554/eLife.64683. [DOI] [PMC free article] [PubMed] [Google Scholar]
- Wu Y., Cheng X., Jiang G., Tang H., Ming S., Tang L., Lu J., Guo C., Shan H., Huang X. Altered oral and gut microbiota and its association with SARS-CoV-2 viral load in COVID-19 patients during hospitalization. npj Biofilms Microbiomes. 2021;7:61–69. doi: 10.1038/s41522-021-00232-5. [DOI] [PMC free article] [PubMed] [Google Scholar]
- Yeoh Y.K., Zuo T., Lui G.C.-Y., Zhang F., Liu Q., Li A.Y., Chung A.C., Cheung C.P., Tso E.Y., Fung K.S., et al. Gut microbiota composition reflects disease severity and dysfunctional immune responses in patients with COVID-19. Gut. 2021;70:698–706. doi: 10.1136/gutjnl-2020-323020. [DOI] [PMC free article] [PubMed] [Google Scholar]
Associated Data
This section collects any data citations, data availability statements, or supplementary materials included in this article.
Supplementary Materials
Data Availability Statement
-
•
The data are available upon reasonable request by contacting the lead contact.
-
•
No new code was generated during the course of this study.
-
•
Any additional information required to reanalyse the data reported in this paper is available from the lead contact upon request.