Abstract
Genetic structure and distinctive features of landraces, such as adaptability to local agro-ecosystems and specific qualitative profiles, can be substantially altered by the massive introduction of allochthonous germplasm. The landrace known as “Cipolla rossa di Acquaviva” (Acquaviva red onion, further referred to as ARO) is traditionally cultivated and propagated in a small area of the Apulia region (southern Italy). However, the recent rise of its market value and cultivation area is possibly causing genetic contamination with foreign propagating material. In this work, genotyping-by-sequencing (GBS) was used to characterize genetic variation of seven onion populations commercialized as ARO, as well as one population of the landrace “Montoro” (M), which is phenotypically similar, but originates from another cultivation area and displays different qualitative features. A panel of 5011 SNP markers was used to perform parametric and non-parametric genetic structure analyses, which supported the hypothesis of genetic contamination of germplasm commercialized as ARO with a gene pool including the M landrace. Four ARO populations formed a core genetic group, homogeneous and clearly distinct from the other ARO and M populations. Conversely, the remaining three ARO populations did not display significant differences with the M population. A set of private alleles for the ARO core genetic group was identified, indicating the possibility to trace the ARO landrace by means of a SNP-based molecular barcode. Overall, the results of this study provide a framework for further breeding activities and the traceability of the ARO landrace.
Keywords: onion, landrace, SNPs, genetic structure, traceability
1. Introduction
Common or bulb onion (Allium cepa L. 2n = 2x = 16) is cultivated on about 5.6 million ha worldwide (FAOSTAT data, 2020 [1]) and widely used for human consumption. It is also one of the main ingredients of several traditional recipes, and a valuable source of nutrients, vitamins, minerals, and bioactive compounds [2,3,4,5,6]. Southwestern Asia is considered the onion domestication center, while several secondary diversification centers occur in the Mediterranean Basin [7].
Considerable genetic diversity is available in common onion landraces and cultivars that are cultivated in the field and/or preserved in ex situ collections established worldwide [8]. A few studies investigated the genetic variation of global diversity panels [9,10], whereas several works focused on the phenotypic and genetic characterization of landraces of main interest for local economies and breeding purposes (e.g., [11,12,13,14,15,16]).
The Italian onion production is significant at the global level (458 thousand tons/ha—FAOSTAT data, 2020 [1]) and is mostly referable to open-pollinated landraces, adapted to local agro-ecosystems and showing wide phenotypic variation with respect to shape, dormancy, bulb color, pungency, and nutritional features. The genetic diversity of these landraces was poorly investigated so far, thus limiting the possibility to protect them from genetic contaminants and frauds, as well as their exploitation in breeding programs [9].
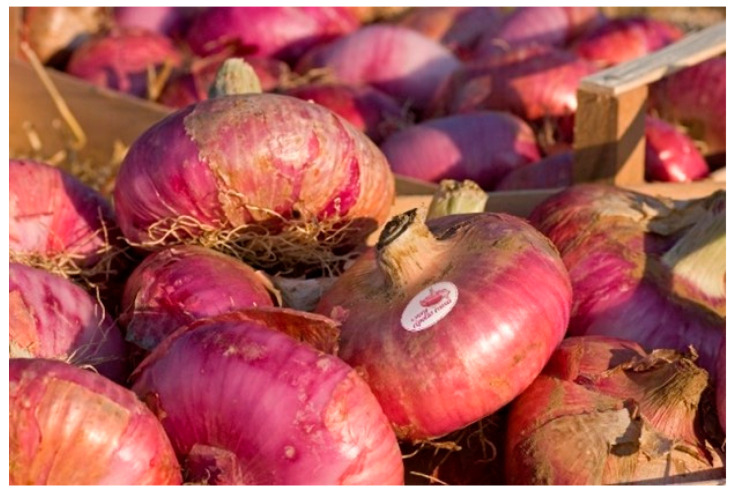
The landrace known as “Cipolla rossa di Acquaviva” (Acquaviva red onion, further referred to as ARO) is cultivated and propagated by local smallholders in the municipality of Acquaviva delle Fonti (Province of Bari, Apulia Region of Southern Italy), an area characterized by freshwater availability and deep well-drained soils. It produces red-colored and flattened bulbs, weighting about 500 g and displaying high solid soluble content and low pungency (Figure 1) [14]. The ARO landrace was originally cultivated as a niche local product; however, its appreciated gustatory profile, recently resulting in the obtainment of the “Slow Food Presidium” quality mark, led to a recent sudden rise of its market value and thus cultivation area. This might have ultimately caused the intentional or unintentional contamination of bulbs intended for crop propagation with foreign germplasm. Possible contamination might have occurred with the gene pool including the onion landrace “Cipolla ramata di Montoro” (further referred to as M), cultivated in the Montorese plain area (Provinces of Avellino and Salerno, Campania Region of Southern Italy). Indeed, the M landrace is phenotypically similar to the ARO landrace but displays a longer shelf life and different soluble solid, anthocyanin, and flavonoid contents [14]. In the framework of a regional project for the safeguard, conservation, and characterization of Apulian germplasm, a preliminary characterization of the ARO landrace was performed, using 11 simple sequence repeat (SSR) markers. This highlighted the occurrence of significant differentiation among ARO populations [14].
Figure 1.
Bulbs of the “Cipolla di Acquaviva” landrace.
Genotyping-by-sequencing (GBS) is a reduced-representation sequencing method allowing to perform low-cost and high-throughput genotyping of crops with large and complex genomes [17,18,19]. Moreover, the use of de novo bioinformatic pipelines, such as UNEAK and Stacks, proved effective in extending the use of GBS to species, such as onion, lacking a reference genome sequence [20,21,22].
Here we describe the application of GBS on onion samples referable to populations commercialized as ARO and M, aiming to investigate the genetic structure of the ARO landrace and provide a basis for its further genetic improvement and traceability.
2. Results
2.1. GBS Experiment and SNP Calling
Sequencing of a 59-plex GBS library yielded 456 million good barcoded reads. The quality control procedure, including steps to filter variants as well as individuals, resulted in a variant call format (vcf) file containing 5011 SNPs and 53 individuals, which was retained and used for downstream analyses. The filtered vcf file was uploaded and is publicly available at the FigShare repository (https://www.doi.org/10.6084/m9.figshare.20301198, accessed on 4 September 2022).
2.2. Population Structure
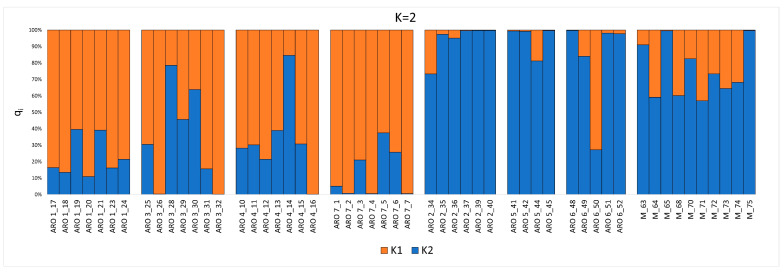
The genetic structure of the onion germplasm under study was first investigated using the parametric model implemented by STRUCTURE [23]. According to the Evanno’s ΔK test [24], two ancestral subpopulations (K = 2) were assumed to best fit genetic data from the germplasm under study (Figure 2 and Figure S1). With a few exceptions, the K1 ancestry was predominant in individuals belonging to the populations ARO1, ARO3, ARO4, and ARO7, further referred to as the ARO_K1 populations. Conversely, the K2 ancestry was predominant in most individuals of the ARO2, ARO5, and ARO6 populations, further referred to as the ARO_K2 populations, as well as in individuals of the M population.
Figure 2.
STRUCTURE bar plots referring to 53 onion individuals genotyped in this study for two ancestral subpopulations (K = 2). Each bar refers to an individual and is colored according to the proportion of the genome (qi) associated with each K detected.
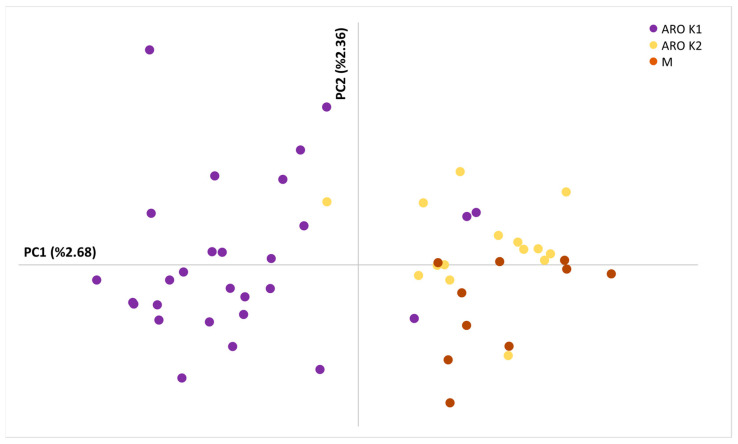
Principal component analysis (PCA) was performed as a first non-parametric alternative to study genetic structure (Figure 3). With a few exceptions, the PCA plot based on the first two principal axes (PC1 and PC2) clearly separated individuals belonging to the ARO_K1 population from those belonging to the ARO_K2 and M populations, which fell in different quadrants.
Figure 3.
Scatter plot for genetic variation explained by the first two principal components (PCs). Individuals belonging to the ARO_K1, ARO_K2 and M populations are marked with different colors.
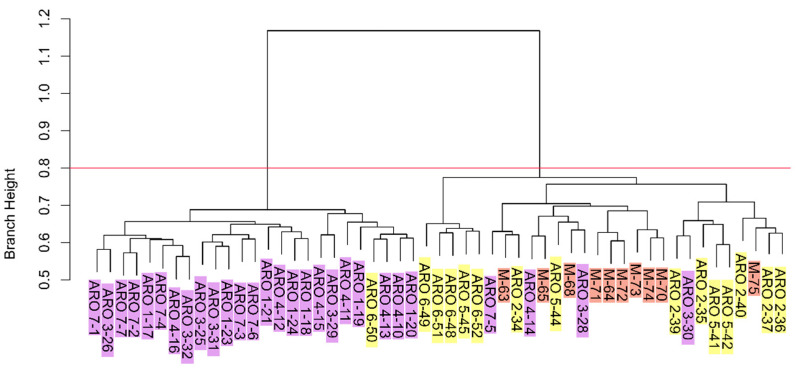
In accordance with the results mentioned above, hierarchical clustering highlighted the occurrence of two major clusters, one mainly referable to ARO_K1 individuals, and the other to ARO_K2 and M individuals (further referred to as the ARO_K1 and ARO_K2/M clusters, respectively) (Figure 4). Exceptions included four individuals belonging to the ARO_K1 populations (one from the ARO4 and ARO7 populations, and two from the ARO3 population) that grouped in the ARO_K2/M cluster. ARO1 was the only ARO_K1 population whose individuals all grouped in the ARO_K1 cluster.
Figure 4.
Hierarchical clustering. Labels at the leaves of the dendrogram indicate the population ID (ARO1-7 and M) and the individual ID number. Purple, yellow, and orange label highlighting indicate sampling of individuals within the ARO_K1, ARO_K2 and M populations, respectively. The red line cuts the dendrogram for two major genetic clusters.
Pairwise estimates of the Wright’s FST statistics ranged from 0 (ARO3 vs. ARO1, ARO4 vs. ARO3, and ARO7 vs. ARO1) to 0.113 (ARO5 vs. ARO7) (Table 1). Permutation analysis on FST estimates indicated, for the p = 0.05 threshold, non-significant differences among the ARO_K1 populations, and significant differences between any of the ARO_K1 populations and the M population (Table 1). Notably, in accordance with genetic structure analyses, no significant difference was found between any of the ARO_K2 populations and the M population (Table 1).
Table 1.
Pairwise Population FST values (below diagonal). Probability, P (rand ≥ data) based on 999 permutations, is shown above diagonal.
| ARO_K1 | ARO_K2 | ||||||||
|---|---|---|---|---|---|---|---|---|---|
| ARO1 | ARO3 | ARO4 | ARO7 | ARO2 | ARO5 | ARO6 | M | ||
| ARO_K1 | ARO1 | 0 | 0.509 | 0.470 | 0.433 | 0.001 | 0.001 | 0.012 | 0.012 |
| ARO3 | 0 | 0 | 0.497 | 0.421 | 0.003 | 0.009 | 0.045 | 0.030 | |
| ARO4 | 0.001 | 0 | 0 | 0.319 | 0.001 | 0.006 | 0.070 | 0.037 | |
| ARO7 | 0 | 0.002 | 0.006 | 0 | 0.001 | 0.001 | 0.002 | 0.002 | |
| ARO_K2 | ARO2 | 0.078 | 0.061 | 0.062 | 0.093 | 0 | 0.464 | 0.316 | 0.082 |
| ARO5 | 0.094 | 0.073 | 0.077 | 0.113 | 0.003 | 0 | 0.438 | 0.161 | |
| ARO6 | 0.048 | 0.036 | 0.033 | 0.063 | 0.010 | 0.011 | 0 | 0.279 | |
| M | 0.030 | 0.022 | 0.022 | 0.042 | 0.019 | 0.021 | 0.009 | 0 | |
Population genetic analysis showed a higher number of alleles (Na), the number of effective alleles (Ne), the Shannon’s information index (I) and the observed heterozygosity (Ho) for the ARO_K1 populations, indicating higher genetic diversity. The observed heterozygosity (Ho) was close to the expected heterozygosity (He) for the ARO_K1 populations, thus determining a low fixation index (F), ranging from 0.022 to 0.057. On the contrary, the F values obtained for the ARO_K2 and M populations were considerably higher, ranging from 0.145 to 0.279 (Table 2).
Table 2.
Statistics on the onion populations genotyped in this study.
| CODE | Na | Ne | I | Ho | He | F | |
|---|---|---|---|---|---|---|---|
| ARO_K1 | ARO1 | 1.911 | 1.619 | 0.518 | 0.33 | 0.352 | 0.056 |
| ARO3 | 1.904 | 1.61 | 0.513 | 0.327 | 0.349 | 0.054 | |
| ARO4 | 1.891 | 1.615 | 0.511 | 0.325 | 0.348 | 0.057 | |
| ARO7 | 1.905 | 1.617 | 0.515 | 0.343 | 0.351 | 0.022 | |
| ARO_K2 | ARO2 | 1.69 | 1.469 | 0.399 | 0.181 | 0.272 | 0.279 |
| ARO5 | 1.481 | 1.349 | 0.311 | 0.163 | 0.215 | 0.19 | |
| ARO6 | 1.696 | 1.481 | 0.406 | 0.225 | 0.277 | 0.145 | |
| M | 1.88 | 1.578 | 0.49 | 0.23 | 0.332 | 0.278 | |
| Mean | 1.795 | 1.542 | 0.458 | 0.265 | 0.312 | 0.126 |
2.3. Private Allele Identification
Aiming to provide a tool for product traceability, a search was performed to identify alleles that distinguish the ARO_K1 populations from the M population. In total, 596 private alleles were identified. Private alleles occurred in most cases at low frequency (Figure S2); however, 25 were highly discriminant, as they occurred with a frequency higher than 0.5 and up to 0.65 (Table S1).
3. Discussion
The concept of landrace has been debated for a long time by the scientific community [25]. Zeven [26] was the first author to consider landraces as dynamic plant populations, which may evolve through contamination from allochthonous genetic material. However, as stressed by the same author, such a contamination should involve “a few individuals”, and therefore be of limited extent, in order to preserve two key attributes contributing to the formal definition of a landrace, i.e., long history of cultivation in a specific area and recognizable phenotypic identity [27]. Here, we performed a fine-scale genetic study to test the hypothesis that the recent rise of the ARO market value, and thus the ARO cultivation area, resulted in significant contamination with foreign germplasm, which altered the original genetic structure of this landrace. Such contamination was mostly expected from the gene pool of the widespread allochthonous M landrace, which displays a similar bulb appearance but a longer shelf life, and therefore would allow higher income when marketed as ARO. Both parametric and non-parametric genetic structure analyses indicated genetic contamination of germplasm commercialized as ARO with a gene pool including the M landrace, as several ARO individuals, especially from the ARO2, ARO5 and ARO6 populations, were genetically closer to M than other ARO individuals (Figure 2, Figure 3 and Figure 4). Out of seven populations marketed as ARO, each one propagated by a different smallholder, there were three, named ARO_K2 populations after STRUCTURE analysis, that were not significantly different from the M population. The remaining four populations considered in our study, collectively named ARO_K1 populations, formed a distinct group, and contained a population (ARO1) that, based on interviews with farmers, was indicated for sure as directly descendant from germplasm cultivated in the municipality of Acquaviva delle Fonti during the 1980s. Based on this body of evidence, we speculate that the ARO_K1 populations indeed reflect the original genetic structure of the ARO landrace.
The reduction of agronomic performance due to inbreeding (i.e., mating among closely related individuals), referred to as inbreeding depression, strongly limits genetic gains in outcrossing crop species, including onion [28,29,30]. Here, based on the estimation of the fixation index parameter (F), we found that negligible inbreeding gave rise to the ARO_K1 populations (0.022 ≤ F ≤ 0.057), whereas significant inbreeding contributed to the ARO_K2 populations (0.145 ≤ F ≤ 0.279) and the M population (F = 0.278). This result, which likely reflects a larger number of individuals used to propagate the ARO_K1 populations, has two major implications: (i) selection within the ARO_K1 populations might lead to phenotypic improvement without causing obvious deleterious phenotypic effects due to inbreeding depression; (ii) the ARO_K2 and the M populations might possibly already suffer from inbreeding depression, which could be exacerbated by further within-population selection activities. Higher chance of success in performing selection on the ARO_K1 populations derives from their higher genetic diversity, as revealed by the number of alleles (Na), the number of effective alleles (Ne), the Shannon’s index statistics, and the observed heterozygosity (Ho) statistics (Table 2).
Genetic traceability of landraces is of great value for the valorization of typical productions, as well as their protection from frauds [31]. Here, the analysis of about 5000 polymorphic loci identified by GBS allowed the identification of several private alleles for the ARO_K1 populations, which contributed, together with loci with different allele frequency, to the genetic differentiation between the ARO_K1 and M populations (Table 1). Most of the private alleles occurred at low frequency, in accordance with the notion that most SNPs identified by GBS have a low minor allele frequency [18]. Nonetheless, 25 alleles occurred at high frequency (p ≥ 0.5), suggesting the possibility to implement traceability tests for the ARO landrace. In general, the results of our study indicate the possibility to exploit SNP variation to develop molecular barcodes for onion landrace traceability or protection. This might be facilitated by the availability of user-friendly technologies for high-throughput SNP detection [32,33,34], together with recent advances in onion genomics [35].
Overall, this study clearly indicates the occurrence of genetic structure in germplasm marketed as ARO, which likely arose from genetic contamination of the original landrace. In addition, it delivers valuable information for breeding activities to be performed on the ARO landrace, and actions to be addressed for its valorization and protection by means of molecular tools.
4. Materials and Methods
4.1. Plant Material
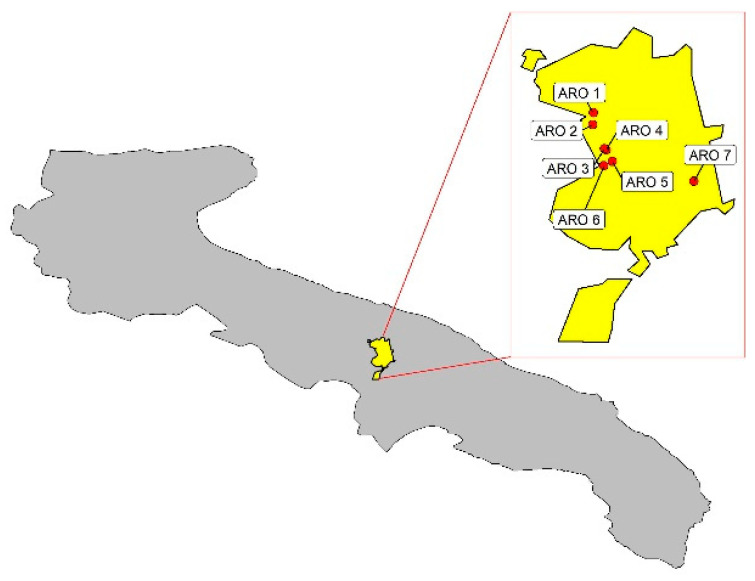
A collection of 59 individuals was analyzed in this study. Of these, 49 represent seven onion ARO populations, each one collected from a different smallholder operating in the municipality of Acquaviva delle Fonti (Figure 5), and 10 were obtained from the Committee for the promotion of the M landrace (https://www.cipollaramatadimontoro.it/index.php, accessed on 4 September 2022). Based on interviews with smallholders, the population referred to as ARO1 was indicated to certainly descend from germplasm cultivated in the municipality of Acquaviva during the 1980s. Plants were grown under the same environmental conditions at the experimental farm “P. Martucci” of the University of Bari “Aldo Moro” (41°1′22.08″ N, 16°54′25.95″ E).
Figure 5.
Localization of the different ARO populations genotyped in this study within the municipality borders of Acquaviva delle Fonti (Apulia Region, Southern Italy).
4.2. GBS Assay and SNP Filtering
Young leaves were sampled and stored at −80 °C until use. Leaves were washed three times with the STE buffer (0.25 M sucrose, 0.03 M Tris, 0.05 M EDTA) [36] to remove polysaccharides, then total genomic DNA was extracted according to the protocol described by [37]. DNA quality and concentration were checked by the Qubit fluorometer (Illumina ThermoFisher Scientific, Waltham, MA, USA), and about 2 μg of DNA for each sample were used for the GBS assay. This was conducted as described by [17], using the ApeKI restriction enzyme to prepare the DNA library and the Illumina HiSeq 2500 system (paired ends) for sequencing.
To perform SNP call and generate a variant call format (vcf) file, the UNEAK pipeline [21] in TASSEL 3 [38] was used, as no onion reference sequence was available. The quality control procedure filtered out SNPs with a call rate < 60% and a minor allele frequency (MAF) < 5%, and individuals with a call rate < 50%.
4.2.1. Population Structure and Genetic Relationships among Individuals
Parametric analysis of population structure was performed with the software STRUCTURE (v.2.3.4) [23], considering 1 to 10 hypothetical subpopulations (the K parameter) with 10 independent runs for each K, a burn-in period of 25,000, and 100,000 Markov chain Monte Carlo iterations. The best K value was inferred by the calculation of the ΔK statistics [24] using the software Structure Harvester [39]. Non-parametric study of the genetic structure was performed by principal component analysis (PCA), which was carried out in TASSEL 5 [38], based on the pairwise identity by state (IBS) distance. In addition, the AWclust package [40] was used to investigate relationships among individuals, based on the allele sharing distance matrix (ASD) and the Ward’s minimum variance clustering algorithm.
Genalex 6.5. [41] was also used to compute pairwise Wright’s FST estimates among populations and to test the null hypothesis of no significant difference based on 999 permutations. In addition, the same software could compute several diversity indexes (number of alleles (Na), number of effective alleles (Ne), observed heterozygosity (Ho), expected heterozygosity (He), Shannon’s information index (I)), and the inbreeding coefficient (F) associated with each population.
4.2.2. Identification of Private Alleles
Genalex 6.5. was used to search for private alleles, which only occurred in the set of four ARO populations whose ancestry was mostly referable to the cluster K1 identified by STRUCTURE analysis. In addition, the same software could derive the frequency associated with each private allele.
Acknowledgments
We would like to thank the farm “Azienda Agricola Iannone Anna” and the farmer association “Associazione produttori della vera cipolla rossa di Acquaviva” for providing plant materials used in the experiment.
Supplementary Materials
The following supporting information can be downloaded at: https://www.mdpi.com/article/10.3390/plants11182388/s1. Figure S1: Evanno’s ΔK plot associated with STRUCTURE genetic analysis. Figure S2: Frequency distribution of the 596 private alleles distinguishing the ARO K1 population from the M population. Red bins highlight the distribution of private alleles with a frequency above 0.5. Table S1: Private alleles distinguishing the ARO_K1 populations from the M population. Only alleles with a frequency above 0.5 are shown. Information on the SNP locus name, nucleotide, and frequency are reported.
Author Contributions
C.L., S.P. and L.R. planned and designed the experiment. F.R. and A.R.M. performed field and laboratory work. C.D., S.P., M.M.M. and C.L. performed data analysis. S.P., C.L. and M.M.M. wrote the manuscript. All authors have read and agreed to the published version of the manuscript.
Institutional Review Board Statement
Not applicable.
Informed Consent Statement
Not applicable.
Data Availability Statement
Data are available at the FigShare repository (doi:10.6084/m9.figshare. 20301198).
Conflicts of Interest
The authors declare no conflict of interest.
Funding Statement
This work was funded by the Regional Apulian project “Biodiversity of Apulian vegetable species”—10.2—operazione 10.2.1 “Progetti per la conservazione e valorizzazione delle risorse genetiche in agricoltura”.
Footnotes
Publisher’s Note: MDPI stays neutral with regard to jurisdictional claims in published maps and institutional affiliations.
References
- 1.FAOSTAT FAO Statistical Database. [(accessed on 9 January 2022)]. Available online: http://www.fao.org.
- 2.Griffiths G., Trueman L., Crowther T., Thomas B., Smith B. Onions-A global benefit to health. Phytother. Res. 2002;16:603–615. doi: 10.1002/ptr.1222. [DOI] [PubMed] [Google Scholar]
- 3.Corzo-Martínez M., Corzo N., Villamiel M. Biological properties of onions and garlic. Trends Food Sci. Technol. 2007;18:609–625. doi: 10.1016/j.tifs.2007.07.011. [DOI] [Google Scholar]
- 4.Block E. Garlic and Other Alliums—The Lore and the Science. RSC Publishing; Cambridge, UK: 2010. [Google Scholar]
- 5.Beretta V.H., Bannoud F., Insani M., Galmarini C.R., Cavagnaro P.F. Dataset on absorption spectra and bulb concentration of phenolic compounds that may interfere with onion pyruvate determinations. Data Brief. 2017;11:208–213. doi: 10.1016/j.dib.2017.01.015. [DOI] [PMC free article] [PubMed] [Google Scholar]
- 6.Sami R., Elhakem A., Alharbi M., Benajiba N., Almatrafi M., Helal M. Nutritional values of onion bulbs with some essential structural parameters for packaging process. Appl. Sci. 2021;11:2317. doi: 10.3390/app11052317. [DOI] [Google Scholar]
- 7.Brewster J.L. Onions and Other Vegetable Alliums. CABI Publishing; Wallingford, UK: 2008. [Google Scholar]
- 8.Khosa J.S., McCallum J., Dhatt A.S., Macknight R.C. Enhancing onion breeding using molecular tools. Plant Breed. 2016;135:9–20. doi: 10.1111/pbr.12330. [DOI] [Google Scholar]
- 9.Villano C., Esposito S., Carucci F., Frusciante L., Carputo D., Aversano R. High-throughput genotyping in onion reveals structure of genetic diversity and informative SNPs useful for molecular breeding. Mol. Breed. 2019;39:5. doi: 10.1007/s11032-018-0912-0. [DOI] [Google Scholar]
- 10.Taylor A., Teakle G.R., Walley P.G., Finch-Savage W.E., Jackson A.C., Jones J.E., Hand P., Thomas B., Havey M.J., Pink D.A.C., et al. Assembly and characterisation of a unique onion diversity set identifies resistance to fusarium basal rot and improved seedling vigour. Theor. Appl. Genet. 2019;132:3245–3264. doi: 10.1007/s00122-019-03422-0. [DOI] [PMC free article] [PubMed] [Google Scholar]
- 11.Mallor C., Arnedo-Andrés M.S., Garcés-Claver A. Assessing the genetic diversity of Spanish Allium cepa landraces for onion breeding using microsatellite markers. Sci. Hortic. 2014;170:24–31. doi: 10.1016/j.scienta.2014.02.040. [DOI] [Google Scholar]
- 12.Monteverde E., Galván G., Speranza P. Genetic diversification of local onion populations under different production systems in Uruguay. Plant Genet. Resour. 2015;13:238–246. doi: 10.1017/S1479262114000963. [DOI] [Google Scholar]
- 13.Rivera A., Mallor C., Garcés-Claver A., García-Ulloa A., Pomar F., Silvar C. Assessing the genetic diversity in onion (Allium cepa L.) landraces from northwest Spain and comparison with the European variability. N. Z. J. Crop Hortic. Sci. 2016;43:103–120. doi: 10.1080/01140671.2016.1150308. [DOI] [Google Scholar]
- 14.Ricciardi L., Mazzeo R., Marcotrigiano A.R., Rainaldi G., Iovieno P., Zonno V., Pavan S., Lotti C. Assessment of genetic diversity of the “acquaviva red onion” (Allium cepa L.) apulian landrace. Plants. 2020;9:260. doi: 10.3390/plants9020260. [DOI] [PMC free article] [PubMed] [Google Scholar]
- 15.Cramer C.S., Mandal S., Sharma S., Nourbakhsh S.S., Goldman I., Guzman I. Recent Advances in Onion Genetic Improvement. Agronomy. 2021;11:482. doi: 10.3390/agronomy11030482. [DOI] [Google Scholar]
- 16.Brahimi A., Landschoot S., Bekaert B., Hajji L., Hajjaj H., Audenaert K., Haesaert G., Mazouz H. Exploring the genetic and phenotypic diversity within and between onion (Allium cepa L.) ecotypes in Morocco. J. Genet. Eng. Biotechnol. 2022;20:96. doi: 10.1186/s43141-022-00381-w. [DOI] [PMC free article] [PubMed] [Google Scholar]
- 17.Elshire R.J., Glaubitz J.C., Sun Q., Poland J.A., Kawamoto K., Buckler E.S., Mitchell S.E. A robust, simple genotype ing-by-sequencing (GBS) approach for high diversity species. PLoS ONE. 2011;6:e19379. doi: 10.1371/journal.pone.0019379. [DOI] [PMC free article] [PubMed] [Google Scholar]
- 18.Pavan S., Delvento C., Ricciardi L., Lotti C., Ciani E., D’Agostino N. Recommendations for choosing the genotyping method and best practices for quality control in crop genome-wide association studies. Front. Genet. 2020;11:447. doi: 10.3389/fgene.2020.00447. [DOI] [PMC free article] [PubMed] [Google Scholar]
- 19.Taranto F., D’Agostino N., Rodriguez M., Pavan S., Minervini A.P., Pecchioni N., Papa R., De Vita P. Whole genome scan reveals molecular signatures of divergence and selection related to important traits in durum wheat germplasm. Front. Genet. 2020;217 doi: 10.3389/fgene.2020.00217. [DOI] [PMC free article] [PubMed] [Google Scholar]
- 20.Catchen J., Hohenlohe P.A., Bassham S., Amores A., Cresko W.A. Stacks: An analysis tool set for population genomics. Mol. Ecol. 2013;22:3124–3140. doi: 10.1111/mec.12354. [DOI] [PMC free article] [PubMed] [Google Scholar]
- 21.Lu F., Lipka A.E., Glaubitz J., Elshire R., Cherney J.H., Casler D.M., Buckler E.S., Costics D.E. Switchgrass Genomic Diversity, Ploidy, and Evolution: Novel Insights from a Network-Based SNP Discovery Protocol. PLoS Genet. 2013;9:e1003215. doi: 10.1371/journal.pgen.1003215. [DOI] [PMC free article] [PubMed] [Google Scholar]
- 22.Pavan S., Bardaro N., Fanelli V., Marcotrigiano A.R., Mangini G., Taranto F., Catalano D., Montemurro C., De Giovanni C., Lotti C., et al. Genotyping by sequencing of cultivated lentil (Lens culinaris Medik.) highlights population structure in the Mediterranean gene pool associated with geographic patterns and phenotypic variables. Front. Genet. 2019;10:872. doi: 10.3389/fgene.2019.00872. [DOI] [PMC free article] [PubMed] [Google Scholar]
- 23.Pritchard J.K., Stephens M., Rosenberg N.A., Donnelly P. Association mapping in structured populations. Am. J. Hum. Genet. 2000;67:170–181. doi: 10.1086/302959. [DOI] [PMC free article] [PubMed] [Google Scholar]
- 24.Evanno G., Regnaut S., Goudet J. Detecting the number of clusters of individuals using the software STRUCTURE: A simulation study. Mol. Ecol. 2005;14:2611–2620. doi: 10.1111/j.1365-294X.2005.02553.x. [DOI] [PubMed] [Google Scholar]
- 25.Casañas F., Simó J., Casals J., Prohens J. Toward an evolved concept of landrace. Front. Plant Sci. 2017;8:145. doi: 10.3389/fpls.2017.00145. [DOI] [PMC free article] [PubMed] [Google Scholar]
- 26.Zeven A.C. Landraces: A review of definitions and classifications. Euphytica. 1998;104:127–139. doi: 10.1023/A:1018683119237. [DOI] [Google Scholar]
- 27.Villa T.C.C., Maxted N., Scholten M., Ford-Lloyd B. Defining and identifying crop landraces. Plant Genet. Res. 2005;3:373–384. doi: 10.1079/PGR200591. [DOI] [Google Scholar]
- 28.Charlesworth D., Willis J.H. The genetics of inbreeding depression. Nat. Rev. Genet. 2009;10:783–796. doi: 10.1038/nrg2664. [DOI] [PubMed] [Google Scholar]
- 29.Sekine D., Yabe S. Simulation-based optimization of genomic selection scheme for accelerating genetic gain while preventing inbreeding depression in onion breeding. Breed. Sci. 2020;70:594–604. doi: 10.1270/jsbbs.20047. [DOI] [PMC free article] [PubMed] [Google Scholar]
- 30.Pavan S., Delvento C., Mazzeo R., Ricciardi F., Losciale P., Gaeta L., D’Agostino N., Taranto F., Sánchez-Pérez R., Ricciardi L., et al. Almond diversity and homozygosity define structure, kinship, inbreeding, and linkage disequilibrium in cultivated germplasm, and reveal genomic associations with nut and seed weight. Hortic. Res. 2021;8:1–12. doi: 10.1038/s41438-020-00447-1. [DOI] [PMC free article] [PubMed] [Google Scholar]
- 31.Galimberti A., De Mattia F., Losa A., Bruni I., Federici S., Casiraghi M., Martellos S., Labra M. DNA barcoding as a new tool for food traceability. Food Res. Int. 2013;50:55–63. doi: 10.1016/j.foodres.2012.09.036. [DOI] [Google Scholar]
- 32.Semagn K., Babu R., Hearne S., Olsen M. Single nucleotide polymorphism genotyping using Kompetitive Allele Specific PCR (KASP): Overview of the technology and its application in crop improvement. Mol. Breed. 2014;33:1–14. doi: 10.1007/s11032-013-9917-x. [DOI] [Google Scholar]
- 33.Ayalew H., Tsang P.W., Chu C., Wang J., Liu S., Chen C., Xue-Feng M. Comparison of TaqMan, KASP and rhAmp SNP genotyping platforms in hexaploid wheat. PLoS ONE. 2019;14:e0217222. doi: 10.1371/journal.pone.0217222. [DOI] [PMC free article] [PubMed] [Google Scholar]
- 34.Ma Y., Coyne C.J., Main D., Pavan S., Sun S., Zhu Z., Xuxiao Z., Leitão J., McGee R.J. Development and validation of breeder-friendly KASPar markers for er1, a powdery mildew resistance gene in pea (Pisum sativum L.) Mol. Breed. 2017;37:151. doi: 10.1007/s11032-017-0740-7. [DOI] [Google Scholar]
- 35.Finkers R., van Kaauwen M., Ament K., Burger-Meijer K., Egging R., Huits H., Kodde L., Kroon L., Shigyo M., Sato S., et al. Insights from the first genome assembly of Onion (Allium cepa) G3-Genes Genom. Genet. 2021;11:jkab243. doi: 10.1093/g3journal/jkab243. [DOI] [PMC free article] [PubMed] [Google Scholar]
- 36.Shepherd L.D., McLay T.G. Two micro-scale protocols for the isolation of DNA from polysaccharide-rich plant tissue. J. Plant Res. 2011;124:311–314. doi: 10.1007/s10265-010-0379-5. [DOI] [PubMed] [Google Scholar]
- 37.Doyle J.J., Doyle J.L. Isolation of plant DNA from fresh tissue. Focus. 1990;12:13–14. [Google Scholar]
- 38.Bradbury P.J., Zhang Z., Kroon D.E., Casstevens T.M., Ramdoss Y., Buckler E.S. TASSEL: Software for association mapping of complex traits in diverse samples. Bioinformatics. 2007;23:2633–2635. doi: 10.1093/bioinformatics/btm308. [DOI] [PubMed] [Google Scholar]
- 39.Earl D., VonHoldt B. STRUCTURE HARVESTER: A website and program for visualizing STRUCTURE output and implementing the Evanno method. Conserv. Genet. Res. 2011;4:359–361. doi: 10.1007/s12686-011-9548-7. [DOI] [Google Scholar]
- 40.Gao X., Starmer J.D. AWclust: Point-and-click software for non-parametric population structure analysis. BMC Bioinform. 2008;9:77. doi: 10.1186/1471-2105-9-77. [DOI] [PMC free article] [PubMed] [Google Scholar]
- 41.Peakall P.E., Smouse R. GenAlEx 6.5: Genetic analysis in excel population genetic software for teaching and research-an update. Bioinformatics. 2012;28:2537–2539. doi: 10.1093/bioinformatics/bts460. [DOI] [PMC free article] [PubMed] [Google Scholar]
Associated Data
This section collects any data citations, data availability statements, or supplementary materials included in this article.
Supplementary Materials
Data Availability Statement
Data are available at the FigShare repository (doi:10.6084/m9.figshare. 20301198).


