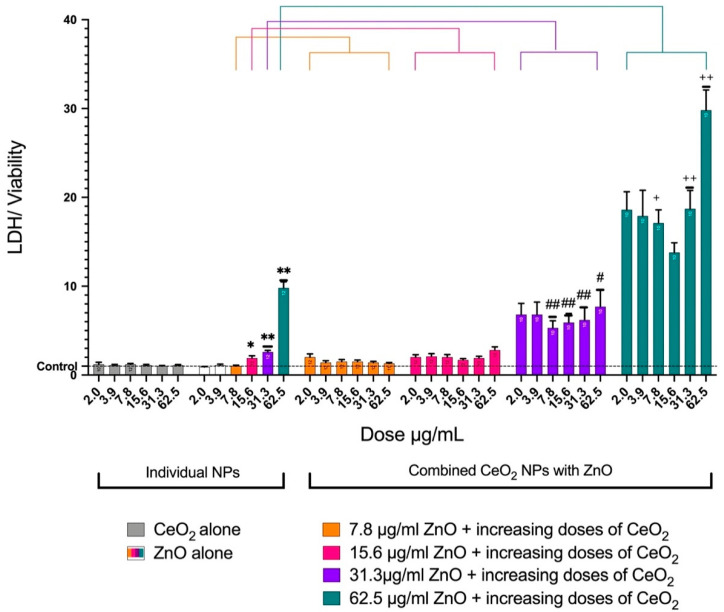
Figure 4.
Release of lactate dehydrogenase from cells after treatment with either individual NPs (two groups) or combined NPs (for groups) for a 24-hour treatment. The graph represents the mean ± SEM of at least 10 treatments. The LDH was normalized for cell viability, LDH (% of control)/viability (% of control). The CeO2 group (gray) had no effect on cell viability. Increasing the doses of ZnO only caused an increase in LDH release in a dose-dependent manner. The first two groups of the combined NPs (orange and pink) did not show any increases in LDH leakage. When 31.3 μg/mL of ZnO was combined with CeO2, a significant elevation in LDH release was observed (purple). When 62.5 μg/mL of ZnO was combined with increasing doses of CeO2, the LDH release was significantly higher than when 62.5 μg/mL of ZnO alone was used (teal). (*) Significantly different (p < 0.05) from the control. (**) Significantly different (p < 0.01) from the control. (#) Significantly different (p < 0.05) from 31.3 μg/mL of ZnO alone. (##) Significantly different (p < 0.01) from 31.3 μg/mL of ZnO alone. (+) Significantly different (p < 0.05) from 62.5 μg/mL of ZnO alone. (++) Significantly different (p < 0.01) from 62.5 μg/mL of ZnO alone.

