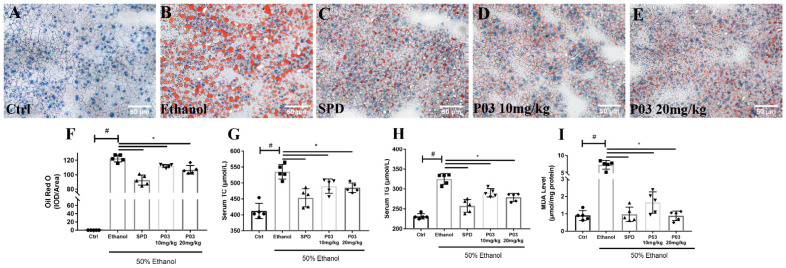
Figure 5.
Alterations in lipid metabolism in mice with binge alcohol exposure. (A–E) Representative images of histological liver sections after Oil Red O staining. Sections were visualized using Bioquant Osteo (20×) and quantified using Image Pro plus software. (F) The corresponding quantification of Oil Red O staining in different groups. (G,H) Serum triglycerides and total cholesterol levels in different groups. (I) The levels of hepatic malondialdehyde (MDA) were detected colorimetrically in different groups. Comparisons were made with one-way ANOVA. Values are represented as mean ± SD. (Compared to Ctrl, # p < 0.05. Compared to ethanol, * p < 0.05) (n = 5).

