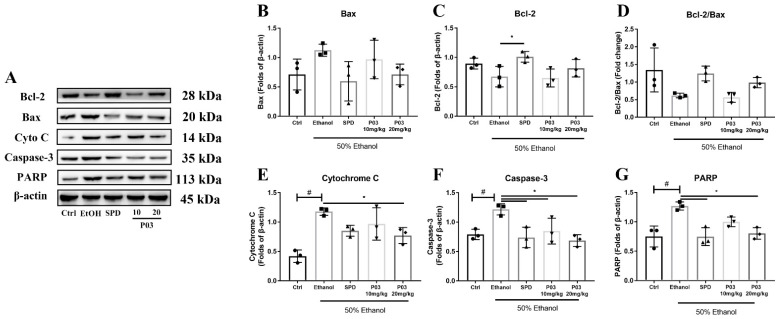
Figure 8.
Immunoblots of Bcl-2, Bax, Cytochrome C, Caspase-3 and PARP. (A) Immunoblots of indicated proteins. (B–F) Densitometric quantification of Bcl-2, Bax, Cytochrome C, Caspase-3 and PARP were performed and normalized to β-actin levels. (G) The ratios of Bcl-2 vs. Bax were calculated from densitometric analysis. The values represent mean ± SD and are plotted as fold-change. (Compared to Ctrl, # p < 0.05. Compared to ethanol, * p < 0.05) (n = 3).

