

Abstract
Aim: It is important to assess if clinical trial efficacy translates into real-world effectiveness for COVID-19 vaccines. Materials & methods: We conducted a modified test-negative design (TND) to evaluate the real-world effectiveness of three COVID-19 vaccines. We defined cases in two ways: self-reported COVID-19-positive tests, and self-reported positive tests with ≥1 moderate/severe COVID-19 symptom. Results: Any vaccination was associated with a 95% reduction in subsequently reporting a positive COVID-19 test, and a 71% reduction in reporting a positive test and ≥1 moderate/severe symptom. Conclusion: We observed high effectiveness across all three marketed vaccines, both for self-reported positive COVID-19 tests and moderate/severe COVID-19 symptoms. This innovative TND approach can be implemented in future COVID-19 vaccine and treatment real-world effectiveness studies. Clinicaltrials.gov identifier: NCT04368065.
Keywords: : COVID-19, patient-reported outcomes, person-generated health data, SARS-CoV-2, symptoms, test-negative design, vaccines
Tweetable abstract
Evaluating real-world COVID-19 vaccine effectiveness. #COVID19 #Vaccines #TND #PRO #patientreportedoutcomes
Large-scale clinical trials evaluating the currently approved COVID-19 vaccines demonstrated robust efficacy in controlled settings, but there are limited data on their effectiveness under real-world conditions and in particular, their effectiveness at preventing more severe symptoms associated with infection [1–3]. Establishing the real-world effectiveness of COVID-19 vaccines may help promote vaccine uptake by allaying concerns about the unprecedented speed at which the vaccines were developed and launched, especially as new variants continue to emerge [4].
An efficient method of evaluating vaccine effectiveness is the test-negative case–control study design (TND) [5–8], often used for studying influenza vaccines where clinical trials may not be ethical or feasible, and formal testing is not routinely conducted [9–12]. TND have also recently been used for COVID-19 vaccine effectiveness research since these types of studies have been shown to provide reliable estimates of vaccine effectiveness without being subject to confounding by healthcare seeking behavior [13–16]. These designs differ from traditional case–control study designs in that the study subjects are selected from those who present for COVID-19 testing whether such testing was the result of having COVID-19-like symptoms, possible exposure to COVID-19, or was a requirement for work or travel. Cases are those who test positive and controls are those who test negative. TND case–control studies are useful tools that can inform both regulatory and public health policy, especially since much of the initial post-marketing US data on the COVID-19 vaccine effectiveness comes from ecological reporting and observational studies in healthcare workers, with somewhat limited information on their effectiveness in community-dwelling, nonhealthcare-affiliated adults [17–22].
We used a modified version of the TND using direct-to-patient survey data (using community reporting via internet volunteers as opposed to traditional site-based recruitment) to estimate vaccine effectiveness of the Moderna (mRNA-1273, US FDA approval: 31 January 2022), Pfizer (BNT162b2, US FDA approval: 23 August 2021), and Janssen (JNJ-78436735, US FDA Emergency Use Authorization approval: 27 February 2021) [23] vaccines in the general population, including their effectiveness at preventing moderate to severe COVID-19 symptoms.
Materials & methods
This study used self-reported data from the COVID-19 Active Research Experience (CARE) registry's US community-based on-line registry, first launched in March, 2020 to study COVID-19 symptoms and severity outside of the hospital setting and to identify what factors, if any, mitigated the risk from COVID-19 (www.helpstopCOVID19.com) [24,25]. The protocol and survey were updated in January 2021 to include information on vaccination, regardless of whether participants had ever contracted COVID-19.
At enrollment, community-based participants report demographics, COVID-19 test results, medical history, presence and severity of COVID-19-like symptoms, as well as use of medications (prescription and non-prescription) and dietary supplements. COVID-19 test results included both PCR tests and antigen tests. Severity of COVID-19-like symptoms were self-defined by the participant using a four-point scale. In January 2021, questions were added regarding COVID-19 vaccination including dates of administrations and manufacturer for each vaccination [26]. Confirmation of vaccination and COVID-19 test results were not independently obtained.
COVID-19-related symptoms were assembled from the core FDA list [27] with some additions resulting from common free-text write-in responses from the surveys. These symptoms included fever, chills, cough, shortness of breath/difficulty breathing, nasal congestion, sore throat, nausea, diarrhea, fatigue, headache, aches and pains, runny nose, decreased sense of smell, decreased sense of taste, decreased appetite, vomiting, persistent pain or pressure in the chest, trouble waking up after sleeping, anxiety, feeling disoriented or having trouble thinking, depression and insomnia or trouble sleeping. Participants reported symptom severity using a 4-point scale to indicate very mild, mild, moderate or severe.
We used a modified TND to evaluate the effectiveness of the COVID-19 vaccines. In contrast to a traditional TND that is site-based and prospectively tests all participants at the point of care, this study employs online self-reporting of COVID-19 vaccines, COVID-19-testing, results, COVID-19 symptoms and severity. While this is a diversion from the traditional TND approach, these participants have more direct and immediate access to the relevant COVID-19-testing than to testing for other infectious diseases like influenza. To ensure that the study population had the potential for vaccination, we restricted these analyses to participants who reported a COVID-19-test result between 1 March through 16 September 2021, a time-period during which vaccines were widely available in US.
We approached our analysis in two ways. Our first analysis (COVID-19 case positivity) defines cases as those participants who were tested for any reason and reported a positive COVID-19 test result, and controls as those participants who were tested for any reason and reported a negative COVID-19 result. When participants reported both positive and negative test results in that time interval, we selected the positive result and classified them as a case as of that date. When they reported multiple positive tests, we randomly selected one of the results as the study test result; similarly, if a participant reported multiple negative results, we selected a random result. We used random selection to ensure that there was no bias implemented by always taking earlier or later tests, knowing that access to vaccination increased over time starting early in 2021.
A second analysis incorporates the severity of self-reported COVID-19-like symptoms. In this analysis, we defined cases as participants who reported a positive COVID-19 test result and also reported at least one moderate or severe COVID-19 symptom within +/- 7 days of that test result. We conducted a sensitivity analyses using those who reported a positive COVID-19 test result and also at least one COVID-19 symptom, regardless of severity. Controls included all participants who reported a negative COVID-19 test result as well as those who reported a positive test result but did not report any moderate/severe symptoms within +/- 7 days of that test result. We queried symptoms from participants at the time of positive or negative test report; when multiple surveys were available within +/- 7 days of the reported COVID-19-test, we chose the survey with the largest number of moderate/severe symptoms reported to assure we identified the highest severity of symptoms reported.
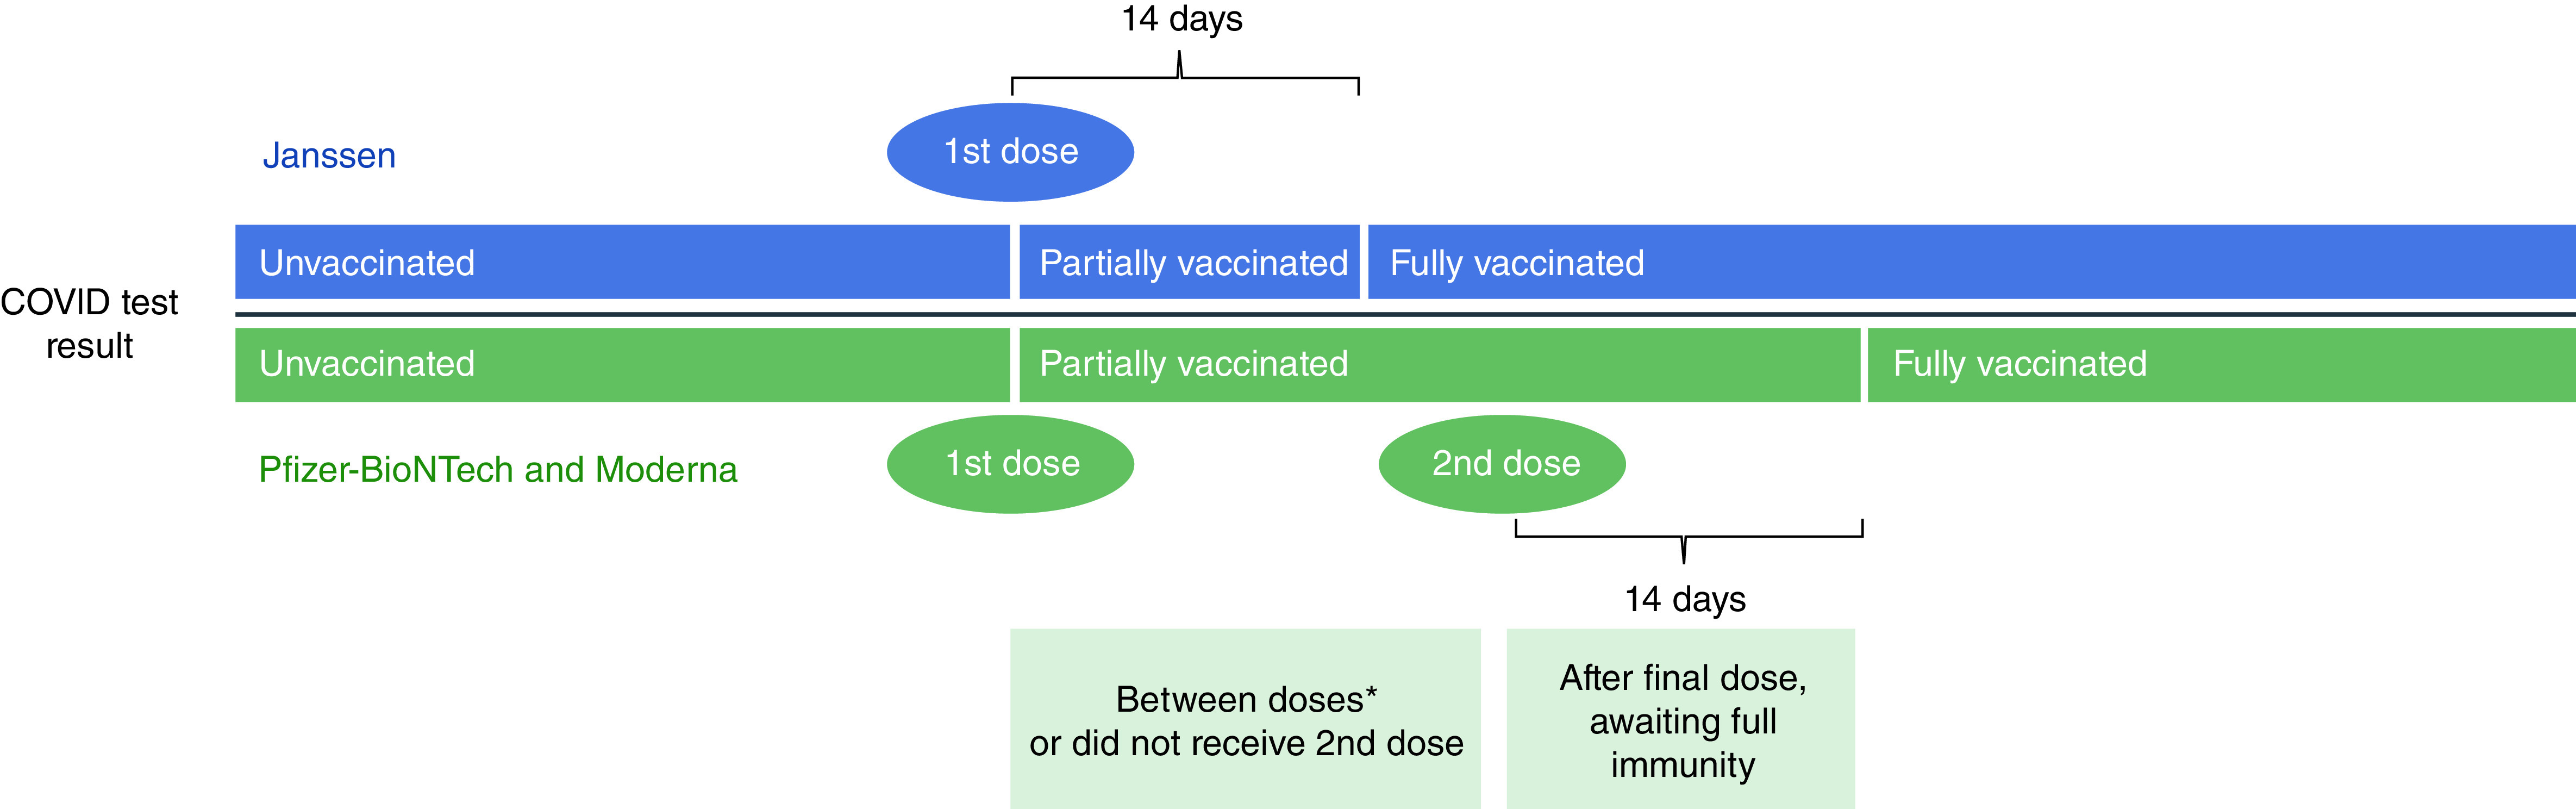
We used self-reported vaccination status, which was subsequently characterized as unvaccinated, partially vaccinated, or fully vaccinated at the time of the reported COVID-19 test result. Unvaccinated participants had not received any vaccine at the time of the COVID-19 test result (Figure 1). We classified participants as ‘fully vaccinated’ at 14 days post-second dose of Moderna or Pfizer vaccine or 14 days after their receipt of the Janssen vaccine. We classified participants as ‘partially’ vaccinated if they had only received their first dose of Pfizer or Moderna but not the second dose, or if they had received two doses of Pfizer or Moderna vaccine, but were not yet 14 days post-second dose, or had received Janssen but were not yet 14 days post-vaccination. We treated the five participants who reported receiving doses from different manufacturers as ‘fully vaccinated’ using the same time intervals described previously, but they were excluded from the manufacturer-specific analysis. If participants noted vaccination prior to 1 December 2020 (n = 10) or reported vaccination with a COVID-19 vaccine other than Janssen, Pfizer or Moderna, they were excluded from this study (n = 6). We also excluded those who reported the same date for their first and second vaccine doses for Moderna and Pfizer (n = 8). Boosters were largely unavailable at the time these data were collected and are not considered in this study.
Figure 1. Vaccination status determination at time of COVID-19 testing for single-dose and two-dose vaccines.
The core analyses aimed to compare the exposure of vaccinated (fully or partially) versus unvaccinated, but also included sensitivity analyses separately for those that were fully vaccinated versus unvaccinated and partially vaccinated versus unvaccinated. Further, we examined each vaccine manufacturer separately for effectiveness using the primary study vaccine exposure definition (fully or partially vaccinated vs unvaccinated).
We accounted for participants' initial geographical access to vaccination by using a proxy variable defined by the timing of availability in a given state (e.g., before or after 5 April 2021), and the state-specific administration rate among those 16 and older on 1 June 2021. We defined high and low administration rates per 100,000 population for each state and DC according to CDC data [28] using the median state's rate as the cut-off to determine high and low. We deemed 1 June 1 2021 as date where the majority of the US population would have an opportunity to be vaccinated. (Table 1).
Table 1. Access proxy defined as matrix of availability and vaccine administration rate.
| High vaccination rate (admin per 100,000 on 6/1†) | Low vaccination rate (admin per 100,000 on 6/1†) | |
|---|---|---|
| Early availability (March 10–April 4) |
AZ, CO, CT, IL, KS, MN, MT, ND, NH, OH, UT (>79,938) Count: 11 |
AL, AR, GA, IN, LA, MS, OK, SC, TX, WV, WY (<79,938) Count: 11 |
| Late availability (April 5–April 19) |
CA, DC, DE, HI, MA, MD, ME, NJ, NM, NY, PA, RI, VA, VT, WA (>96,910) Count: 15 |
AK, FL, IA, ID, KY, MI, MO, NC, NE, NV, OR, SD, TN, WI (<96,910) Count: 14 |
1 June 2021.
We calculated crude and adjusted odds ratios (95% confidence intervals) via multivariate logistic regression models to examine vaccine effectiveness. In multivariable models we adjusted for the following: race (White, other); gender (female, male, other [including male, transgender, not disclosed and other]); age (continuous); education (some college or less, 4-year college degree, >4 year college degree); ethnicity of Hispanic or Latino (yes, no); access to COVID-19 vaccine proxy (early availability, high vaccination rate; early availability, low vaccination rate; late availability, high vaccination rate; late availability, low vaccination rate); and medical conditions including anxiety, autoimmune disorder, blood disorder, cardiovascular disorder, depression, diabetes, hypertension, insomnia or trouble sleeping, kidney disorder and lung disorder (yes, no).
Results
Participant characteristics
Of the 2481 participants who reported testing and vaccination status, 695 (28.0%) individuals reported a positive COVID-19 test result and 1786 (72.0%) individuals reported a negative test result. Among these participants, 1211 (48.8%) were fully vaccinated, 354 (14.3%) were partially vaccinated and 916 (36.9%) were unvaccinated (Table 2). Most participants (80.2%) reported not having any moderate/severe symptoms; 6.2% having at least one moderate to severe symptom, and 13.6% having two or more such symptoms. Among participants that reported a positive COVID-19 test, 38.0% of cases reported at least one moderate/severe symptom as compared with 12.7% of those reporting a negative test. Of the 695 positive COVID-19 participants, 12 (1.7%) reported a hospitalization related to COVID-19. Study participants had a mean age of 46.4 years (standard deviation [SD] = 15.1) and were predominately female (82.8%), well educated (61.9% ≥4-year college) and White (87.1%). Both cases and controls were similar with regard to age (mean age: 46.7 [SD = 15.3] versus 46.3 [SD = 15.0]), gender (female 80.7% vs 83.7%) and race (White: 89.5% vs 86.2%), but the case population (52.5% ≥4-year college) reported slightly lower education than controls (65.6% ≥4-year college). A notable proportion of the study participants reported having anxiety (38.5%), depression (32.5%), insomnia or trouble sleeping (29.8%) and/or hypertension (22.6%) at their baseline survey, which were comparable across both cases and controls.
Table 2. Participant characteristics.
| Cases COVID-19 test positive n = 695 |
Controls COVID-19 test negative n = 1786 |
Cases COVID-19 test positive with >1 moderate to severe COVID symptoms n = 165 |
Controls COVID-19 test positive with <1 moderate to severe COVID symptoms and COVID-19 test negative n = 2316 |
Total n = 2481 |
|
|---|---|---|---|---|---|
| Vaccination status (n) | 695 | 1786 | 165 | 2316 | 2481 |
| Fully vaccinated | 76 (10.9) | 1135 (63.6) | 42 (25.5) | 1199 (51.8) | 1211 (48.8) |
| Partially vaccinated | 48 (6.9) | 306 (17.1) | 15 (9.1) | 348 (15.0) | 354 (14.3) |
| Unvaccinated | 571 (82.2) | 345 (19.3) | 108 (65.5) | 769 (33.2) | 916 (36.9) |
| Moderate/severe symptoms (n) | |||||
| None | 431 (62.0) | 1559 (87.3) | 0 (0) | 1991 (85.9) | 1990 (80.2) |
| One | 87 (12.5) | 67 (3.8) | 54 (32.7) | 99 (4.3) | 154 (6.2) |
| Two or more | 177 (25.5) | 160 (8.9) | 111 (67.3) | 226 (9.8) | 337 (13.6) |
| Age, years (n) | 695 | 1786 | 165 | 2316 | 2481 |
| Mean (SD) | 46.7 (15.3) | 46.3 (15.0) | 46.7 (15.2) | 46.3 (15.1) | 46.4 (15.1) |
| Median (IQR) | 46 (34–60) | 45 (34–59) | 46 (34–59) | 45 (34–59) | 45 (34–59) |
| Age group (years) | 695 | 1786 | 19 (11.5) | 322 (13.9) | 2481 |
| 18–29 | 93 (13.4) | 248 (13.9) | 35 (21.2) | 573 (24.7) | 341 (13.7) |
| 30–39 | 164 (23.6) | 444 (24.8) | 27 (16.4) | 433 (18.7) | 608 (24.5) |
| 40–49 | 123 (17.7) | 337 (18.9) | 45 (27.3) | 416 (17.9) | 460 (18.5) |
| 50–59 | 139 (20.0) | 322 (18.0) | 39 (23.6) | 572 (24.7) | 461 (18.6) |
| >= 60 | 176 (25.3) | 435 (24.4) | 19 (11.5) | 322 (13.9) | 611 (24.6) |
| Gender | 695 | 1786 | 165 | 2316 | 2481 |
| Female | 561 (80.7) | 1495 (83.7) | 135 (81.8) | 1921 (82.9) | 2056 (82.8) |
| Male | 118 (16.9) | 244 (13.7) | 25 (15.2) | 337 (14.6) | 362 (14.6) |
| Transgender | 7 (1.0) | 26 (1.5) | 2 (1.2) | 31 (1.3) | 33 (1.3) |
| Other | 9 (1.3) | 20 (1.5) | 3 (1.8) | 26 (1.1) | 29 (1.2) |
| Not disclosed | 0 (0) | 1 (0.1) | 0 (0) | 1 (0.04) | 1 (0.04) |
| Education | 695 | 1784 | 165 | 2314 | 2479 |
| Some college or less | 330 (47.5) | 614 (34.4) | 88 (53.3) | 856 (37.0) | 944 (38.1) |
| 4-year college degree | 157 (22.6) | 491 (27.5) | 36 (21.8) | 612 (26.4) | 648 (26.1) |
| >4-year college degree | 208 (29.9) | 679 (38.1) | 41 (24.9) | 846 (36.5) | 887 (35.8) |
| Race | 692 | 1783 | 1 (0.6) | 53 (2.3) | 2481 |
| Asian | 5 (0.7) | 49 (2.8) | 2 (1.2) | 81 (3.5) | 54 (2.2) |
| Black or African–American | 24 (3.5) | 59 (3.3) | 143 (86.7) | 2013 (86.9) | 83 (3.4) |
| White | 619 (89.5) | 1537 (86.2) | 18 (10.9) | 164 (7.1) | 2156 (87.1) |
| Other† | 44 (6.4) | 138 (7.7) | 1 (0.6) | 5 (0.2) | 182 (7.4) |
| Ethnicity | |||||
| Hispanic or Latino | 73 (10.6) | 154 (8.7) | 14 (8.5) | 213 (9.2) | 227 (9.2) |
| Medical condition | |||||
| Anxiety | 289 (41.5) | 666 (37.3) | 84 (50.9) | 871 (37.6) | 955 (38.5) |
| Autoimmune disease | 90 (13.0) | 214 (11.9) | 27 (16.3) | 277 (11.9) | 304 (12.3) |
| Blood disorder | 30 (4.3) | 36 (2.0) | 54 (2.3) | 12 (7.3) | 66 (2.7) |
| Cardiovascular disease | 39 (5.6) | 100 (5.6) | 14 (8.5) | 125 (5.4) | 139 (5.6) |
| Depression | 239 (34.4) | 567 (31.8) | 69 (41.8) | 737 (31.8) | 806 (32.5) |
| Diabetes | 65 (9.4) | 151 (8.5) | 15 (9.1) | 201 (8.7) | 216 (8.7) |
| Hypertension | 158 (22.7) | 402 (22.5) | 40 (24.2) | 520 (22.5) | 560 (22.6) |
| Insomnia or trouble sleeping | 225 (32.4) | 515 (28.8) | 72 (43.6) | 668 (28.8) | 740 (29.8) |
| Kidney disease | 21 (3.0) | 53 (3.0) | 6 (3.6) | 68 (2.9) | 74 (3.0) |
| Lung disease | 63 (9.1) | 204 (11.4) | 21 (12.7) | 246 (10.6) | 267 (10.7) |
| Organ transplant | 2 (0.3) | 3 (0.2) | 1 (0.6) | 4 (0.2) | 5 (0.2) |
| On treatment for cancer | 692 | 1777 | 2469 | ||
| Yes | 10 (1.5) | 22 (1.2) | 5 (3.0) | 27 (1.2) | 32 (1.3) |
The race category of other includes: 13 American–Indians or Alaskans, 3 Hawaiian or Pacific Islander, 77 who selected multiple races and 89 who selected ‘other’.
Test-negative design analysis
When looking at vaccine effectiveness against self-reported COVID-19-positive tests only, 124 cases (17.8% of 695) reported being fully or partially vaccinated at the time of their positive COVID-19 test, while 1441 controls (80.6% of 1786) reported being fully or partially vaccinated at the time of their negative COVID-19 test (Table 2). This resulted in an unadjusted odds ratio of 0.05 (95% CI: 0.04, 0.07) and adjusted odds ratio (aOR) of 0.05 (95% CI: 0.04, 0.06), indicating that being vaccinated was associated with a 95% reduction in the odds of having a self-reported positive COVID-19 test.
When looking at vaccine effectiveness against at least one moderate/severe COVID-19 symptom in COVID-19-positive cases (165 cases and 2316 controls) (Table 3), 57 cases reported being fully or partially vaccinated at the time of their positive COVID-19 test with at least one moderate/severe symptom, while 1,547 control patients reported being fully or partially vaccinated at the time of their negative COVID-19 test with at least one moderate/severe symptom. This resulted in an unadjusted odds ratio of 0.26 (95% CI: 0.19, 0.37) and aOR of 0.29 (95% CI: 0.20, 0.40), indicating a 71% reduction in the odds of having a self-reported positive COVID-19 test and at least one moderate/severe symptom. As a sensitivity analysis, we examined vaccine effectiveness against any COVID symptoms regardless of reported severity and we observed an aOR of 0.22 (95% CI: 0.16, 0.31) for fully vaccinated and 0.37 (0.24, 0.58) for those partially vaccinated.
Table 3. Multivariate model for vaccine effectiveness at preventing cases of COVID-19.
| Covariates | Odds of having a COVID-19-positive test |
Odds of having a COVID-19-positive test with >= 1 moderate/severe symptom) |
|---|---|---|
| Adjusted OR (95% CI) | Adjusted OR (95% CI) | |
| Vaccination status | ||
| Unvaccinated | (ref) | (ref) |
| Fully or partially vaccinated | 0.05 (0.04, 0.06) | 0.29 (0.20, 0.40) |
| Anxiety | 1.27 (0.96, 1.69) | 1.46 (0.97, 2.21) |
| Autoimmune disorder | 1.22 (0.86, 1.74) | 1.15 (0.72, 1.85) |
| Blood disorder | 3.01 (1.56, 5.83) | 2.60 (1.28, 5.28) |
| Cardiovascular disorder | 0.89 (0.53, 1.50) | 1.47 (0.76, 2.81) |
| Depression | 1.00 (0.74, 1.33) | 1.07 (0.71, 1.61) |
| Diabetes | 1.23 (0.81, 1.86) | 0.87 (0.48, 1.58) |
| Hypertension | 0.89 (0.66, 1.20) | 0.85 (0.55, 1.32) |
| Insomnia or trouble sleeping | 1.09 (0.84, 1.42) | 1.57 (1.09, 2.25) |
| Kidney Disorder | 1.19 (0.60, 2.36) | 0.95 (0.38, 2.42) |
| Lung Disorder | 0.55 (0.37, 0.81) | 0.90 (0.54, 1.52) |
| Education | ||
| Some college or less | (ref) | (ref) |
| 4-year college degree | 0.73 (0.55, 0.97) | 0.71 (0.46, 1.08) |
| >4-year college degree | 0.97 (0.74, 1.27) | 0.68 (0.45, 1.02) |
| Race | ||
| Other | (ref) | (ref) |
| White | 2.33 (1.64, 3.32) | 1.09 (0.65, 1.82) |
| Age (per 1 year increment) | 1.00 (0.99, 1.01) | 1.01 (0.99, 1.02) |
| Gender | ||
| Female | (ref) | (ref) |
| Male | 1.50 (1.10, 2.06) | 1.26 (0.79, 2.01) |
| Other | 1.35 (0.63, 2.91) | 1.29 (0.48, 3.47) |
| Ethnicity (Hispanic Latino vs not) | ||
| Not Hispanic | (ref) | (ref) |
| Hispanic | 0.99 (0.68, 1.46) | 0.84 (0.45, 1.54) |
| Vaccination access (proxy) | ||
| Early availability, high vaccination rate | (ref) | (ref) |
| Early availability, low vaccination rate | 0.87 (0.60, 1.26) | 1.24 (0.74, 2.09) |
| Late availability, high vaccination rate | 0.63 (0.46, 0.86) | 0.72 (0.44, 1.16) |
| Late availability, low vaccination rate | 1.15 (0.83, 1.60) | 1.26 (0.79, 2.02) |
If a referent category is not listed, then the comparison is yes vs no (referent group).
When examining the effects of covariates on reporting a positive test for COVID-19, male gender (aOR 1.50; 95% CI: 1.10, 2.06), White race (aOR = 2.33; 95% CI: 1.64, 3.32), reporting a blood disorder, (including a history of blood clots, sickle cell disease, thalassemia, thrombocytopenia or other blood disease) (aOR = 3.01; 95% CI: 1.56, 5.83) and reporting a lung disorder (aOR = 0.55; 95% CI: 0.37, 0.81) were significant predictors in the adjusted model. While not statistically significant, low vaccination rates in the state of the participant, regardless of timing of vaccine availability were greater than one (early availability/low access: aOR = 1.24; 95% CI: 0.74, 2.09; and late availability/low access: aOR = 1.26; 95% CI 0.79, 2.02).
When examining the effectiveness of full vaccination (versus being unvaccinated) and partial vaccination (at least one dose, but not having achieved full potential immunity) versus being unvaccinated, full vaccination was more protective (aOR = 0.03; 95% CI: 0.03, 0.05) when compared with partial vaccination (versus being unvaccinated) (aOR = 0.08; 95% CI: 0.06, 0.12) (Table 4). In the symptom-based analysis, fully vaccination (aOR = 0.28; 95% CI: 0.19, 0.41) resulted in slightly higher effectiveness than those with partial vaccination (aOR = 0.29; 95% CI: 0.16, 0.53)
Table 4. Test-negative analysis (odds of a positive COVID-19 test or a positive COVID-19 test and at least one moderate to severe symptom by vaccination status.
| Vaccination status | Cases COVID-19 test positive |
Controls COVID-19 test negative |
OR (95% CI) | aOR (95% CI) | |
|---|---|---|---|---|---|
| Test-negative analysis based on COVID-19 test results | Fully vaccinated | 76 | 1135 | 0.04 (0.03, 0.05) | 0.03 (0.03, 0.05) |
| Unvaccinated | 571 | 345 | |||
| Partially vaccinated | 48 | 306 | 0.10 (0.07, 0.13) | 0.08 (0.06, 0.12) | |
| Unvaccinated | 571 | 345 |
| Vaccination status | Cases COVID-19 test positive with >1 moderate to severe COVID symptoms |
Controls COVID-19 test positive without moderate to severe COVID symptoms and COVID-19 test negative |
OR (95% CI) | aOR (95% CI) | |
|---|---|---|---|---|---|
| Test-negative analysis based on COVID-19 test results and requiring at least one moderate to severe symptom | Fully vaccinated | 42 | 1199 | 0.25 (0.17, 0.36) | 0.28 (0.19, 0.41) |
| Unvaccinated | 108 | 769 | |||
| Partially vaccinated | 15 | 348 | 0.31 (0.18, 0.53) | 0.29 (0.16, 0.53) | |
| Unvaccinated | 108 | 769 |
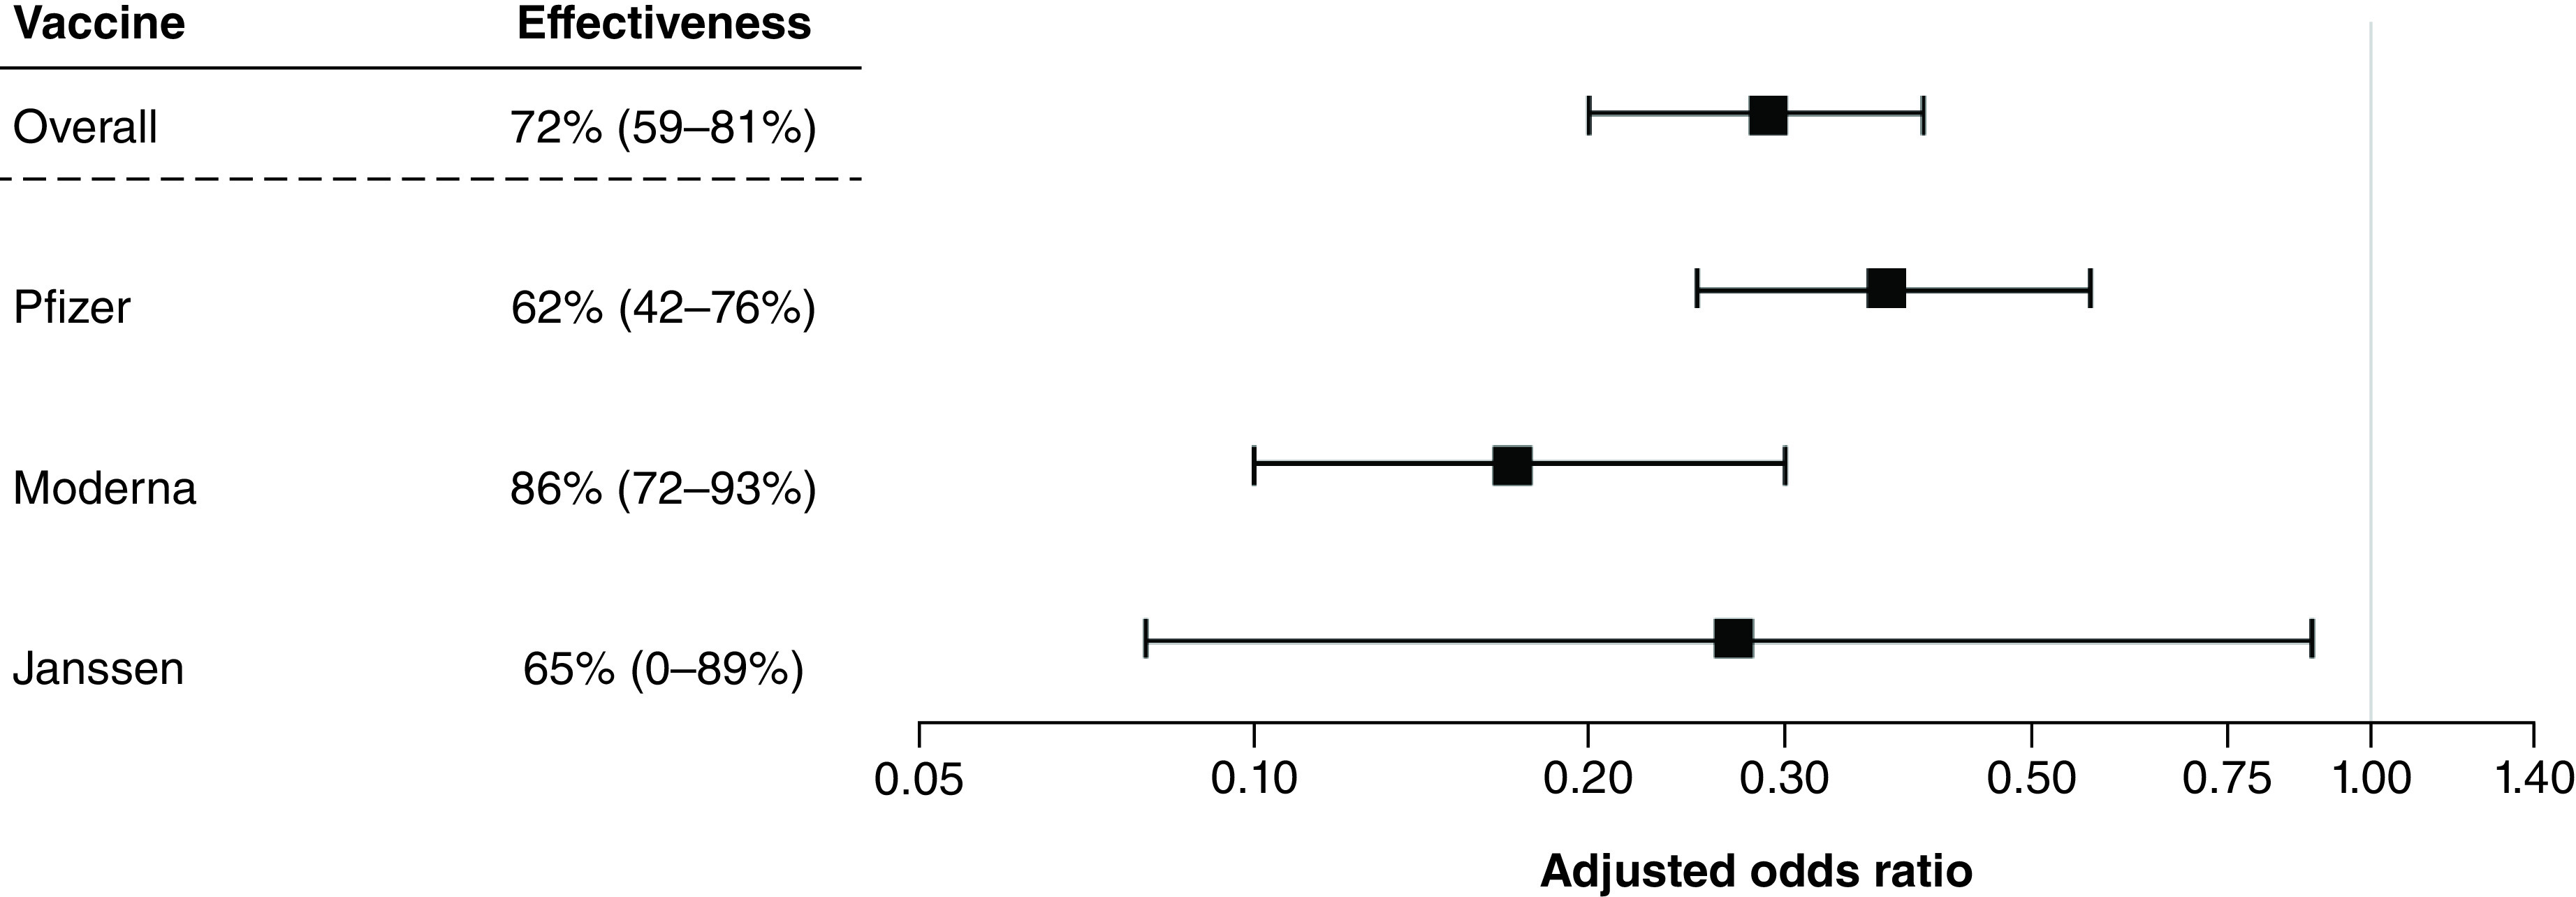
When examining COVID-19 test positivity alone, vaccine effectiveness results were similar across manufacturers (Table 5 & Figure 2); Moderna had the highest effectiveness of 97% (aOR = 0.03; 95% CI: 0.02, 0.04), followed closely by Janssen at 96% (aOR = 0.04; 95% CI: 0.02, 0.09), and Pfizer at 94% (aOR = 0.06; 95% CI: 0.04, 0.07). When examining by the symptom severity case definition, Moderna showed the highest effectiveness at preventing symptomatic cases with an 86% effectiveness (aOR = 0.14; 95% CI: 0.07, 0.28), followed by Janssen at 65% (aOR = 0.35; 95% CI: 0.11, 1.15) and Pfizer at 62% (aOR = 0.38; 95% CI: 0.24, 0.58).
Table 5. Vaccine effectiveness at preventing cases of COVID-19 by vaccine manufacturer and vaccination status for both test-negative analysis results.
| Manufacturer | Vaccination status | Cases COVID-19 test positive |
Controls COVID-19 test negative |
OR (95% CI) | aOR (95% CI) | |
|---|---|---|---|---|---|---|
| Test-negative analysis based on COVID-19 test results | Pfizer | Fully or partially vaccinated | 80 | 732 | 0.06 (0.05, 0.09) | 0.06 (0.04, 0.07) |
| Unvaccinated | 571 | 345 | ||||
| Moderna | Fully or partially vaccinated | 37 | 611 | 0.04 (0.03, 0.05) | 0.03 (0.02, 0.04) | |
| Unvaccinated | 571 | 345 | ||||
| Janssen | Fully or partially vaccinated | 7 | 93 | 0.05 (0.02, 0.09) | 0.04 (0.02, 0.09) | |
| Unvaccinated | 571 | 345 |
| Manufacturer | Vaccination status | Cases COVID-19 test positive with >1 moderate to severe COVID symptoms |
Controls COVID-19 test positive without moderate to severe COVID symptoms and COVID-19 test negative |
OR (95% CI) | aOR (95% CI) | |
|---|---|---|---|---|---|---|
| Test-negative analysis based on COVID-19 test results and requiring at least one moderate to severe symptom | Pfizer | Fully or partially vaccinated | 30 | 620 | 0.35 (0.23, 0.52) | 0.38 (0.24, 0.58) |
| Unvaccinated | 108 | 769 | ||||
| Moderna | Fully or partially vaccinated | 9 | 495 | 0.13 (0.07, 0.26) | 0.14 (0.07, 0.28) | |
| Unvaccinated | 108 | 769 | ||||
| Janssen | Fully or partially vaccinated | 3 | 83 | 0.26 (0.08, 0.83) | 0.35 (0.11, 1.15) | |
| Unvaccinated | 108 | 769 |
Figure 2. Vaccine effectiveness of preventing cases of COVID-19 among those with at least one vaccination versus unvaccinated, overall and by manufacturer (primary analysis based on COVID-19 test results).
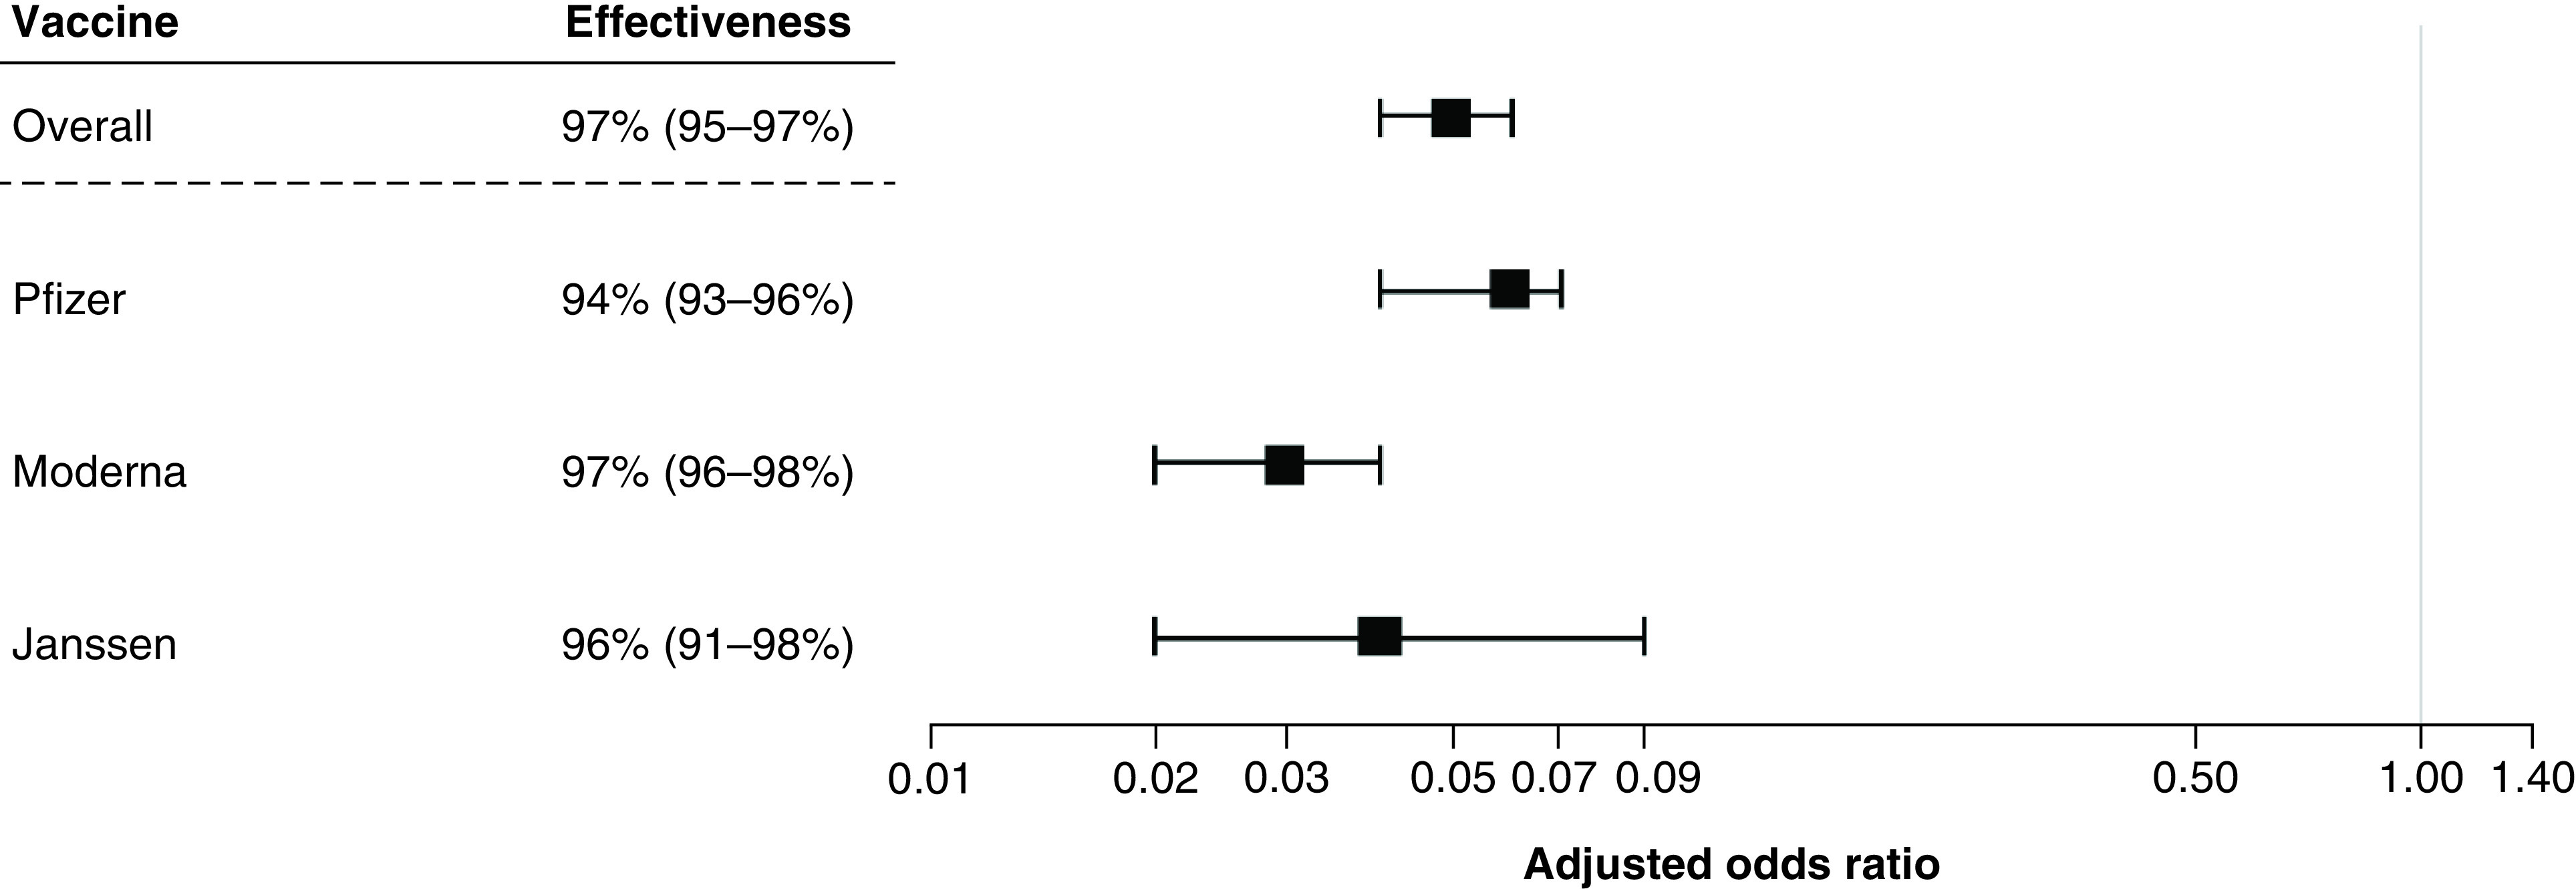
Figure 3. Vaccine effectiveness of preventing cases of COVID-19 among those with at least one vaccination versus unvaccinated, overall and by manufacturer (secondary analysis based on test results and requiring at least one moderate to severe symptom).
Discussion/Conclusion
While the COVID-19 vaccines were rigorously tested in clinical trials establishing their safety and efficacy, the expedited clinical development coupled with immediate widespread use has brought about scrutiny from the public as to whether the findings would be replicated in the real world. This study was too small to study deaths or serious outcomes, recognizing these are high priority outcomes for patients [29]. Here we show that COVID-19 vaccines manufactured by Pfizer, Janssen and Moderna demonstrated consistent and meaningful real-world effectiveness for protection against moderate to severe COVID-19 symptoms. The results from this community-based registry of US adults are consistent with what has been reported in randomized controlled trials [1–3] as well as other published TND studies from both ambulatory and inpatient settings [13–16]. We observed a 95% reduction in aOR of a self-reported COVID-19-positive test in vaccinated participants, with 94%, 96% and 97% reduction in aOR for Pfizer, Janssen and Moderna, respectively. With respect to vaccine effectiveness at mitigating symptom severity, we observed a 74% reduction in risk of moderate-to-severe symptoms overall among those with self-reported COVID-19 diagnosis. Our results suggest greater protection for those who were fully vaccinated as compared with those partially vaccinated, although the results still show clear protection for patients who only received one mRNA vaccine dose and/or had not completed the full immunity period (i.e., 14 days post-final vaccination). These findings contribute to the evidence supporting COVID-19 vaccine effectiveness at mitigating infection in the community overall and reducing COVID-19 severity among breakthrough infections.
Since their emergency use authorizations, several cohort studies among healthcare workers and among older adults have shown effectiveness of the mRNA vaccines (i.e., Pfizer and Moderna) consistent with the 94–95% efficacy observed phase III studies [17,19,22]. TND studies have also been conducted in similar high-risk groups from the US, UK and Canada, with consistent findings [13–16]. At the same time, there are still limited data on vaccine effectiveness among community-dwelling adults across age groups. Our results generally align with other cohort and case–control studies on vaccine effectiveness in the general population. Of note, our findings for mRNA vaccines specifically are consistent with what was observed in their phase II studies, while our findings for the Janssen vaccine are higher (96.0% effective in this study vs 66.3% in the clinical trial).
Our study also contributes to the broader understanding of vaccine effectiveness at mitigating moderate to severe COVID-19 disease symptoms. While we observed the strongest effectiveness in the context of preventing a self-reported positive test, these COVID-19 vaccines had substantial (∼70%) effectiveness in preventing one or more moderate to severe symptoms. It is important to note that the severity of COVID-19 symptoms here requires self-reporting, which may be difficult from a hospital bed or among very sick patients, and had no requirement for or link to healthcare utilization (this study only included 21 participants that reported any hospitalizations during the study period). Our findings show that COVID-19 vaccines protect against moderate-to severe symptoms that did not necessarily require hospitalization or even interactions with the healthcare system.
While vaccination status is the most important predictor, there were several other variables in the adjusted model that were significant and may provide insight into the bigger picture of COVID-19 risk and vaccine effectiveness. Participants who reported a blood disorder in their baseline medical history were associated with a three-fold risk of testing positive for COVID-19. This blood disorder variable is broad, with our 66 respondents having been prompted by examples that included blood clots, sickle cell disease, thalassemia, thrombocytopenia or other blood disease. Our finding in this heterogenous group requires some explanation. While it is known that COVID-19 infection may be pro-thrombotic, and this may potentially exacerbate pro-thrombotic blood disorders, our broad and heterogenous ‘blood disorder’ group may also have included conditions associated with immunosuppression, or the use of immunosuppressive medications, in turn resulting in decreased viral clearance and more severe disease. This result may highlight another potential at-risk population for increased risk of the COVID-19 infection, and merits further investigation to better define the heamatological conditions associated with greater risk. Anaemia has been previously suggested to be an independent risk factor for COVID-19-related mortality, and it would be very likely that our group also included anaemic patients, but their exact contribution to the rather large effect observed is uncertain in our dataset [30,31]. Also, self-reported Caucasian race was associated with a more than a two-fold increased risk of testing COVID-19 positive, but no elevated risk of testing positive and being symptomatic; however, we suspect that self-reported Caucasian race may actually be serving here as a proxy for access to COVID-19 testing rather than having a direct causal relationship, though these data have limited potential to shed much light on the effects of race due to the preponderance of participants who described themselves as Caucasian.
Participants who reported lung disorders were significantly less likely to report a positive for COVID-19 test (aOR = 0.55; 95% CI: 0.37, 0.81). Although it is possible that there may be a common drug/treatment in this group of participants that may be COVID-19 protective, these findings may also have been a result of those at highest risk of severe COVID-19 outcomes either being hospitalized from COVID infection and not able to participate in the study, or that they may have used other methods for preventing COVID-19 infection (e.g., very limited social interaction) that are not explicitly captured as stand-alone variables in our model. These social variables also play an important role in explaining COVID-19 transmission outside of vaccination, and they should be considered in other studies.
We also observed that while early availability of the vaccine in the participants' home states did not have a notable impact, the level of vaccinations in those states did seem to suggest some association with reporting a positive test. Low vaccination rates in the state of the participant, regardless of timing of vaccine availability, show a modest increased risk of self-reported COVID-19-positive testing (early availability/low access: aOR = 1.24; 95% CI: 0.74, 2.09; and late availability/low access: aOR = 1.26; 95% CI 0.79, 2.02). This suggests that independent of the study participant's personal vaccination status, the vaccination rate in the state they reside may also be potentially important factor in COVID-19 infection risk. Participants who were medically recognized to be highly vulnerable may have sought vaccination with the first available vaccine on the market in the US (Pfizer) and this could explain the slightly lower effectiveness observed with that vaccine.
While the data are reassuring on the effectiveness of the current COVID-19 vaccines, this study was not designed to look at specific variants such as Delta or Omicron and cannot be extrapolated to variants, time periods or regions, nor does it address the efficacy of protecting against severe COVID-19. Coupled with the known possibility of waning immunity from vaccination, additional booster doses are now recommended, particularly for higher risk groups. While cohort studies can be limited when timely data are needed to inform public health measures, the efficiency of a TND or modified TND approach with an unbiased selection of cases and controls are likely one of the best options to study the vaccines in the post-market setting.
Although CARE data rely on self-reported information subject to some information biases, these real-world data have detailed information on participant experiences with respect to COVID-19 and the vaccines. Misclassification of vaccination status can bias TND studies but is unlikely here since participants are likely to know whether they have been vaccinated; further they were encouraged to consult their vaccination cards when reporting manufacturer, lot, and dates. Moreover, person-generated data like this allows for a comprehensive capture of all relevant patient-level clinical and nonclinical data which are often not available in larger real-world data sources.
Nonetheless, it is not always clear whether participants were tested for COVID-19 because they were symptomatic or exposed to someone who tested positive, or if it was mandated for some other reason. It is possible that vaccinated individuals are more likely to take a COVID-19 test out of caution whereas unvaccinated individuals are not concerned about COVID-19, driving their unvaccinated status, and ultimately biasing TND studies if testing practices were differentially affected by vaccination status. While the study was conducted in a period not affected by the more transmissible Delta and Omicron variants, we chose a period that reflects the circulating virus during the phase III clinical trials to assess consistency of results. This approach, design, and data collection could also be implemented for new and emerging COVID-19 vaccine and treatment effectiveness questions.
It is important to keep in mind that this registry generally reflects reporting from well-educated, middle-aged contributors across the US, with women contributing substantially more than men. The extent to which these findings can be extrapolated to other groups or locations is unknown. That said, the selection factors that influence the decision to join this cohort are unlikely to have biased any comparisons within the cohort. Moreover, it is unlikely that there would have been differential false-negative testing by vaccine manufacturer.
Future perspective
Although voluntary participation from community-dwelling individuals may have resulted in selective participation of those most likely to have sought testing, it is unlikely to have been differential according to vaccine manufacturer. More important, these real-world data add a dimension not often represented in the medical literature, namely reports of the participant experiences that are not commonly found in other health data systems such as electronic health records, medical claims and/or prescription data. For example, while symptom severity may not be clinically reproducible, participants self-reports reflect their perception of their experience and thus, are an important outcome for study. We foresee the evermore expansion of patient-centric approaches and applications to data collection across the pharmaceutical and health industry.
While cohort studies can be limited when timely data are needed to inform public health measures, the efficiency of a TND or modified TND approach with a representative selection of cases and controls are likely one of the best options to study the vaccines in the post-market setting. This approach, design, and data collection could also be implemented for new and emerging COVID-19 vaccine and treatment effectiveness questions.
Summary points.
It is important to assess the extent to which the real-world effectiveness of marketed vaccines is consistent with that observed in the clinical trials, and to characterize how well vaccines prevent COVID-19 symptoms.
We conducted a modified test-negative design (TND) to evaluate the RW effectiveness of three COVID-19 vaccines by leveraging data from an on-going, US community-based registry. Vaccine effectiveness was examined in two ways: considering cases who (1) self-reported a positive COVID-19 test (695 cases, 1786 controls) and who (2) self-reported a positive test with at least one moderate/severe COVID-19 symptom (165 cases, 2316 controls). Any vaccination (full or partial) was associated with a 95% reduction in the odds of having a self-reported positive COVID-19 test (adjusted odds ratio (aOR) = 0.05; 95% confidence interval [CI] 0.04, 0.06). Full vaccination was associated with an aOR of 0.03 (95% CI 0.03, 0.05) while partial vaccination had an aOR of 0.08 (95% CI 0.06, 0.12). Any vaccination was associated with a 71% reduction in the odds of a self-reported positive COVID-19 test and having at least one moderate/severe symptom (aOR = 0.29; 95% CI 0.20, 0.40). Sensitivity analyses of COVID-19-like symptoms showed similar results.
We observed high effectiveness across all three vaccine manufacturers both for prevention of self-reported positive COVID-19 test results and prevention of moderate/severe COVID-19 symptoms.
Acknowledgments
The authors would like to acknowledge S Pallipuram for leading the technical team.
Ethical conduct of research
The authors have obtained appropriate institutional review board from Advarra Inc IRB# Pro00043030. Participants are unpaid, recruited primarily via social media and provide informed consent online. Data collection and study conduct followed all ethical principles outlined in the Declaration of Helsinki for the conduct of medical research. This study is registered at Clinicaltrials.gov NCT04368065 and EU PAS register EUPAS36240.
Open access
This work is licensed under the Attribution-NonCommercial-NoDerivatives 4.0 Unported License. To view a copy of this license, visit http://creativecommons.org/licenses/by-nc-nd/4.0/
Footnotes
Financial & competing interests disclosure
This work was supported in part by a contract with the US Food and Drug Administration. The bulk of the funding was provided by IQVIA. The authors have no other relevant affiliations or financial involvement with any organization or entity with a financial interest in or financial conflict with the subject matter or materials discussed in the manuscript apart from those disclosed.
No writing assistance was utilized in the production of this manuscript.
References
Papers of special note have been highlighted as: • of interest; •• of considerable interest
- 1.Baden LR, El Sahly HM, Essink B et al. Efficacy and safety of the mRNA-1273 SARS-CoV-2 vaccine. N. Engl. J. Med. 384(5), 403–416 (2021). [DOI] [PMC free article] [PubMed] [Google Scholar]
- 2.Polack FP, Thomas SJ, Kitchin N et al. Safety and efficacy of the BNT162b2 mRNA COVID-19 vaccine. N. Engl. J. Med. 383(27), 2603–2615 (2020). [DOI] [PMC free article] [PubMed] [Google Scholar]
- 3.Sadoff J, Gray G, Vandebosch A et al. Safety and efficacy of single-dose Ad26.COV2.S vaccine against COVID-19. N. Engl. J. Med. 384(23), 2187–2201 (2021). [DOI] [PMC free article] [PubMed] [Google Scholar]
- 4.Patel MM, Jackson ML, Ferdinands J. Postlicensure evaluation of COVID-19 vaccines. JAMA 324(19), 1939–1940 (2020). [DOI] [PubMed] [Google Scholar]; • Peer-reviewed publication of post-licensure evaluation of COVID-19 vaccines using test-negative design. Findings show that “the test-negative design is popular because it offers 2 advantages: simplified logistics, because controls are already identified when identifying cases, and reduced confounding due to similar health care use patterns between cases and controls, similar to a nested case–control study”.
- 5.Chua H, Feng S, Lewnard JA et al. The use of test-negative controls to monitor vaccine effectiveness: a systematic review of methodology. Epidemiology 31(1), 43–64 (2020). [DOI] [PMC free article] [PubMed] [Google Scholar]; • Peer-reviewed publication of methodology of using test-negative design. Findings show that “The test-negative design has been increasingly used as an efficient study design to estimate vaccine effectiveness for a range of vaccines and pathogens”.
- 6.Dean NE, Hogan JW, Schnitzer ME. COVID-19 vaccine effectiveness and the test-negative design. N. Engl. J. Med. 385(15), 1431–1433 (2021). [DOI] [PMC free article] [PubMed] [Google Scholar]; • Peer-reviewed publication of methodology of using test-negative design for COVID-19 vaccines. Findings show that “Owing to their applicability to large electronic health records and their logistic simplicity relative to large prospective cohorts, test-negative designs can be expected to play an important role in monitoring the effectiveness of COVID-19 vaccines in the United States and elsewhere”.
- 7.World Health Organization. Evaluation of COVID-19 vaccine effectiveness: interim guidance (2021). https://apps.who.int/iris/handle/10665/340301
- 8.World Health Organization. Regional Office for Europe. Estimating COVID-19 vaccine effectiveness against severe acute respiratory infections (SARI) hospitalisations associated with laboratory-confirmed SARS-CoV-2: an evaluation using the test-negative design: guidance document (2021). https://apps.who.int/iris/handle/10665/341111
- 9.Feng S, Cowling BJ, Kelly H, Sullivan SG. Estimating influenza vaccine effectiveness with the test-negative design using alternative control groups: a systematic review and meta-analysis. Am. J. Epidemiol. 187(2), 389–397 (2018). [DOI] [PMC free article] [PubMed] [Google Scholar]
- 10.Fukushima W, Hirota Y. Basic principles of test-negative design in evaluating influenza vaccine effectiveness. Vaccine 35(36), 4796–4800 (2017). [DOI] [PubMed] [Google Scholar]
- 11.Shi M, An Q, Ainslie KEC, Haber M, Orenstein WA. A comparison of the test-negative and the traditional case–control study designs for estimation of influenza vaccine effectiveness under nonrandom vaccination. BMC Infect. Dis. 17(1), 757 (2017). [DOI] [PMC free article] [PubMed] [Google Scholar]
- 12.Vasileiou E, Sheikh A, Butler CC et al. Seasonal influenza vaccine effectiveness in people with asthma: a national test-negative design case–control study. Clin. Infect. Dis. 71(7), e94–e104 (2020). [DOI] [PubMed] [Google Scholar]
- 13.Lopez Bernal J, Andrews N, Gower C et al. Effectiveness of the Pfizer-BioNTech and Oxford-AstraZeneca vaccines on COVID-19 related symptoms, hospital admissions, and mortality in older adults in England: test negative case–control study. BMJ 373, n1088 (2021). [DOI] [PMC free article] [PubMed] [Google Scholar]
- 14.Chung H, He S, Nasreen S et al. Effectiveness of BNT162b2 and mRNA-1273 COVID-19 vaccines against symptomatic SARS-CoV-2 infection and severe COVID-19 outcomes in Ontario, Canada: test negative design study. BMJ 374, n1943 (2021). [DOI] [PMC free article] [PubMed] [Google Scholar]; • Peer-reviewed publication of effectiveness of two COVID-19 vaccines studied in this publication. Findings show that “Two doses of mRNA COVID-19 vaccines were observed to be highly effective against symptomatic infection and severe outcomes. Vaccine effectiveness of one dose was observed to be lower, particularly for older adults shortly after the first dose”.
- 15.Thompson MG, Stenehjem E, Grannis S et al. Effectiveness of COVID-19 vaccines in ambulatory and inpatient care settings. N. Engl. J. Med. 385(15), 1355–1371 (2021). [DOI] [PMC free article] [PubMed] [Google Scholar]
- 16.Pilishvili T, Fleming-Dutra KE, Farrar JL et al. Interim estimates of vaccine effectiveness of Pfizer-BioNTech and Moderna COVID-19 vaccines among health care personnel – 33 US sites, January–March 2021. MMWR Morb. Mortal. Wkly Rep. 70(20), 753–758 (2021). [DOI] [PMC free article] [PubMed] [Google Scholar]
- 17.Fowlkes A, Gaglani M, Groover K et al. Effectiveness of COVID-19 vaccines in preventing SARS-CoV-2 infection among frontline workers before and during B.1.617.2 (Delta) variant predominance – eight US locations, December 2020–August 2021. MMWR Morb. Mortal. Wkly Rep. 70(34), 1167–1169 (2021). [DOI] [PMC free article] [PubMed] [Google Scholar]
- 18.Kow CS, Hasan SS. Real-world effectiveness of BNT162b2 mRNA vaccine: a meta-analysis of large observational studies. Inflammopharmacology 29(4), 1075–1090 (2021). [DOI] [PMC free article] [PubMed] [Google Scholar]
- 19.Swift MD, Breeher LE, Tande AJ et al. Effectiveness of messenger RNA coronavirus disease 2019 (COVID-19) vaccines against severe acute respiratory syndrome coronavirus 2 (SARS-CoV-2) infection in a cohort of healthcare personnel. Clin. Infect. Dis. 73(6), e1376–e1379 (2021). [DOI] [PMC free article] [PubMed] [Google Scholar]
- 20.Britton A, Jacobs Slifka KM, Edens C et al. Effectiveness of the Pfizer-BioNTech COVID-19 vaccine among residents of two skilled nursing facilities experiencing COVID-19 outbreaks – Connecticut, December 2020–February 2021. MMWR Morb. Mortal. Wkly Rep. 70(11), 396–401 (2021). [DOI] [PMC free article] [PubMed] [Google Scholar]
- 21.Tenforde MW, Olson SM, Self WH et al. Effectiveness of Pfizer-BioNTech and Moderna vaccines against COVID-19 among hospitalized adults aged >/= 65 years – United States, January–March 2021. MMWR Morb. Mortal. Wkly Rep. 70(18), 674–679 (2021). [DOI] [PMC free article] [PubMed] [Google Scholar]
- 22.Thompson MG, Burgess JL, Naleway AL et al. Interim estimates of vaccine effectiveness of BNT162b2 and mRNA-1273 COVID-19 vaccines in preventing SARS-CoV-2 infection among health care personnel, first responders, and other essential and frontline workers – eight US locations, December 2020–March 2021. MMWR Morb. Mortal. Wkly Rep. 70(13), 495–500 (2021). [DOI] [PMC free article] [PubMed] [Google Scholar]
- 23.United States Food and Drug Administration. COVID-19 vaccines (2022). https://www.fda.gov/emergency-preparedness-and-response/coronavirus-disease-2019-covid-19/covid-19-vaccines
- 24.Dreyer NA, Reynolds M, DeFilippo Mack C et al. Self-reported symptoms from exposure to COVID-19 provide support to clinical diagnosis, triage and prognosis: an exploratory analysis. Travel Med. Infect. Dis. 38, 101909 (2020). [DOI] [PMC free article] [PubMed] [Google Scholar]; •• Peer-review publication of the COVID-19 Active Research Experience utilizing the same patient registry in this study. Findings show that “this methodology is useful in capturing relevant real world data, particularly symptom severity, without requiring physical presentation for clinical assessment, and offers valuable perspective on the true burden of illness as well as signaling those at particularly high risk of severe symptoms and, in parallel, those unlikely to be at such increased risk”.
- 25.Dreyer N, Petruski-Ivleva N, Albert L et al. Identification of a vulnerable group for post-acute sequelae of SARS-CoV-2 (PASC): people with autoimmune diseases recover more slowly from COVID-19. Int. J. Gen. Med. 14, 3941–3949 (2021). [DOI] [PMC free article] [PubMed] [Google Scholar]
- 26.Dreyer NA, Reynolds MW, Albert L et al. How frequent are acute reactions to COVID-19 vaccination and who is at risk? Vaccine 40(12), 1904–1912 (2022). [DOI] [PMC free article] [PubMed] [Google Scholar]; •• Peer-reviewed publication of the COVID-19 Active Research Experience utilizing the same patient registry in this study. Findings show that “the total side effect burden was, not unexpectedly, greater with two-dose regimens but all three vaccines appear relatively safe. Very few subjects reported side effects serious enough to warrant medical care or reported post-vaccination hospitalization”.
- 27.United States Food and Drug Administration. Assessing COVID-19-related symptoms in outpatient adult and adolescent subjects in clinical trials of drugs and biological products for COVID-19 prevention or treatment. (2020). https://www.fda.gov/regulatory-information/search-fda-guidance-documents/assessing-covid-19-related-symptoms-outpatient-adult-and-adolescent-subjects-clinical-trials-drugs
- 28.Center for Disease Control and Prevention. COVID-19 vaccinations in the United States (2021). https://data.cdc.gov/Vaccinations/COVID-19-Vaccinations-in-the-United-States-Jurisdi/unsk-b7fc
- 29.Patel MK, Bergeri I, Bresee JS et al. Evaluation of post-introduction COVID-19 vaccine effectiveness: summary of interim guidance of the World Health Organization. Vaccine 39(30), 4013–4024 (2021). [DOI] [PMC free article] [PubMed] [Google Scholar]
- 30.Roy NBA, Telfer P, Eleftheriou P et al. Protecting vulnerable patients with inherited anaemias from unnecessary death during the COVID-19 pandemic. Br. J. Haematol. 189(4), 635–639 (2020). [DOI] [PMC free article] [PubMed] [Google Scholar]
- 31.Tremblay D, Rapp JL, Alpert N et al. Mild anemia as a single independent predictor of mortality in patients with COVID-19. EJHaem. 2(3), 319–326 (2021). [DOI] [PMC free article] [PubMed] [Google Scholar]