Abstract
White adipose tissue (WAT), once regarded as morphologically and functionally bland, is now recognized to be dynamic, plastic, heterogenous, and involved in a wide array of biological processes including energy homeostasis, glucose and lipid handling, blood pressure control, and host defense1. High fat feeding and other metabolic stressors cause dramatic changes in adipose morphology, physiology, and cellular composition1, and alterations in adiposity are associated with insulin resistance, dyslipidemia, and type 2 diabetes (T2D)2. Here, we provide detailed cellular atlases of human and murine subcutaneous and visceral white fat at single cell resolution across a range of body weight. We identify subpopulations of adipocytes, adipose stem and progenitor cells (ASPCs), vascular, and immune cells and demonstrate commonalities and differences across species and dietary conditions. We link specific cell types to increased risk of metabolic disease, and we provide an initial blueprint for a comprehensive set of interactions between individual cell types in the adipose niche in leanness and obesity. These data comprise an extensive resource for the exploration of genes, traits, and cell types in the function of WAT across species, depots, and nutritional conditions.
An atlas of human white adipose tissue
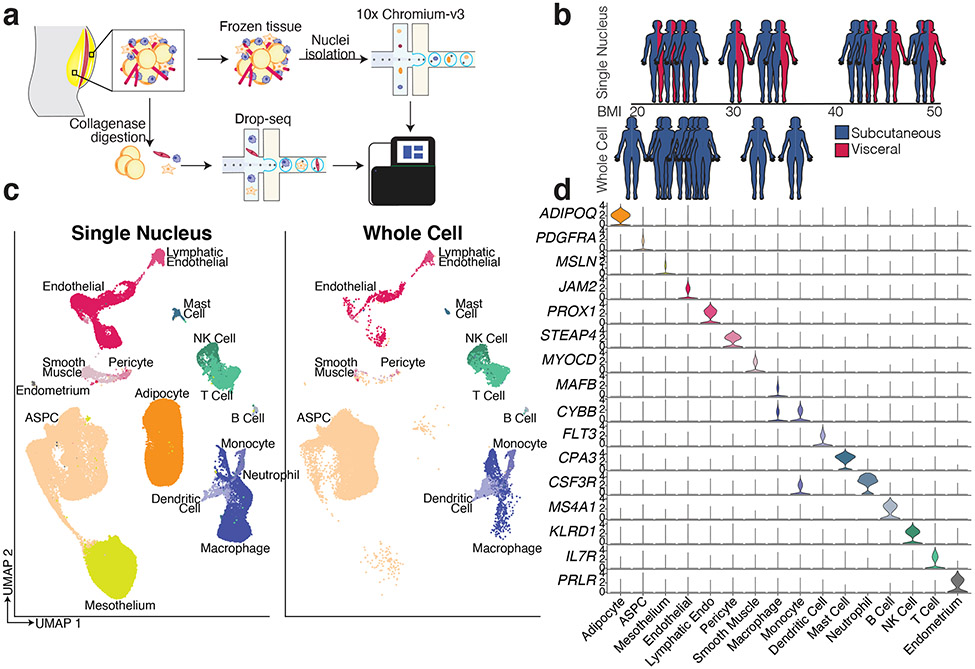
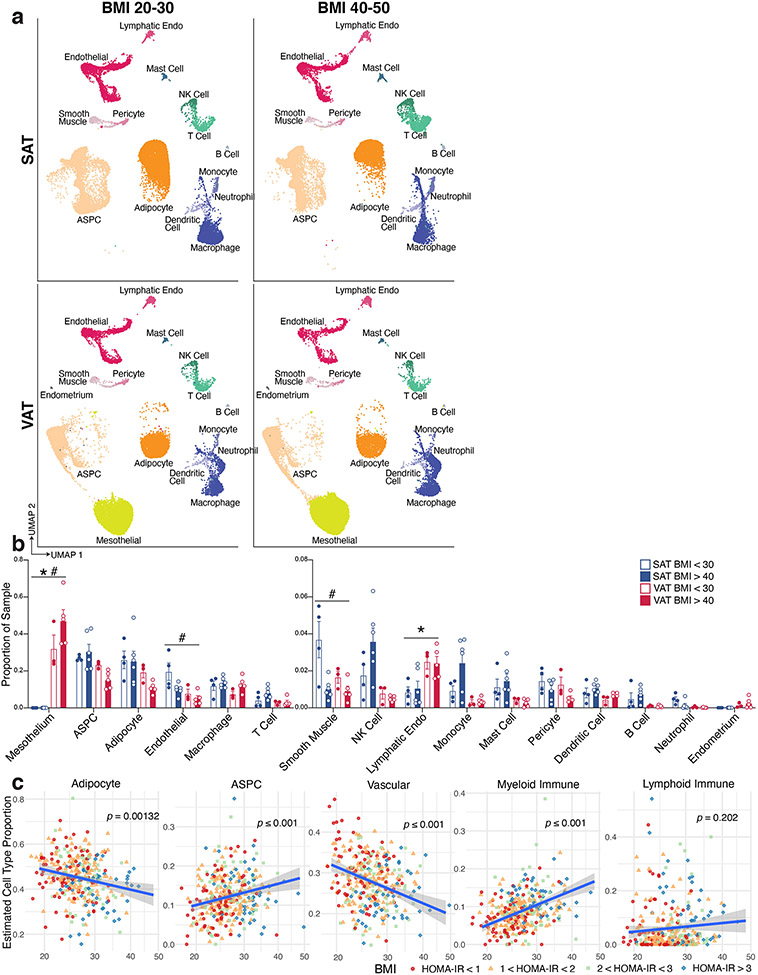
Mature adipocytes are too large and fragile to withstand traditional single cell approaches; as a result, several groups have focused on the non-adipocyte stromal-vascular fraction (SVF) of mouse3-6 and human7 adipose tissue. An alternative strategy involves single nucleus (sNuc) sequencing, which can capture adipocytes, and has been used to describe murine epididymal8,9 and human brown adipose tissue10. To compare these approaches in the context of human WAT, we pursued experiments on two cohorts of subjects. In the first, we collected subcutaneous WAT from 9 women, isolated single cells from the SVF using collagenase digestion, and then performed whole cell Drop-seq [hereafter referred to as single cell (sc)RNA-seq]. Because different depots have been differentially linked to metabolic disease11, for the second cohort we collected paired subcutaneous (SAT) and visceral (VAT) adipose tissue from 10 individuals, and SAT alone from three additional individuals (10 women, 3 men), and performed sNuc-seq (Figures 1a, b; Extended Data Table 1). Doublet and low-quality filtering left 166,149 total cells (28,465 single cells and 137,684 single nuclei). The data from both approaches were integrated, enabling the identification of the canonical cell types found in WAT, including adipocytes, ASPCs, vascular cells, and immune cells (Figures 1c, d; Supplementary Table 1). As expected, adipocytes were found only in the sNuc-seq dataset. The sNuc-seq data was also enriched for vascular cells and macrophages, likely because collagenase digestion did not fully dissociate these cell types. Mesothelial cells were not seen in the scRNA-seq dataset, which did not include visceral tissue. Some of the visceral samples included cells that appeared to be endometrial in origin (PRLR+), likely due to endometriosis. Overall proportions of adipocytes and ASPCs did not differ between depots, but depot clearly affects the distribution of cells within these populations (Supplementary Figure 1, Extended Data Figure 1a, b, Extended Data Table 2). In our limited cohort, we could not detect major effects of BMI on cell type proportions. To assess this finding at larger scale, we utilized our dataset as a reference to estimate cell type proportions in bulk-RNA sequencing data12 obtained from the SAT of 331 men in the METSIM cohort13. This deconvolution analysis found that the relative abundance of adipocytes in that cohort was negatively correlated with BMI, while ASPCs and myeloid cells were positively correlated (Extended Data Figure 1c).
Fig. 1. A single cell atlas of human white adipose tissue.
a, Schematic of workflows for scRNA-seq and sNuc-seq of human WAT. b, Graphical representation of the cohorts for both studies. Only the sNuc-seq cohort contains VAT. c, UMAP projection of all 166,129 sequenced human cells split by cohort. d, Marker genes for each cell population in the human WAT dataset.
An atlas of mouse white adipose tissue
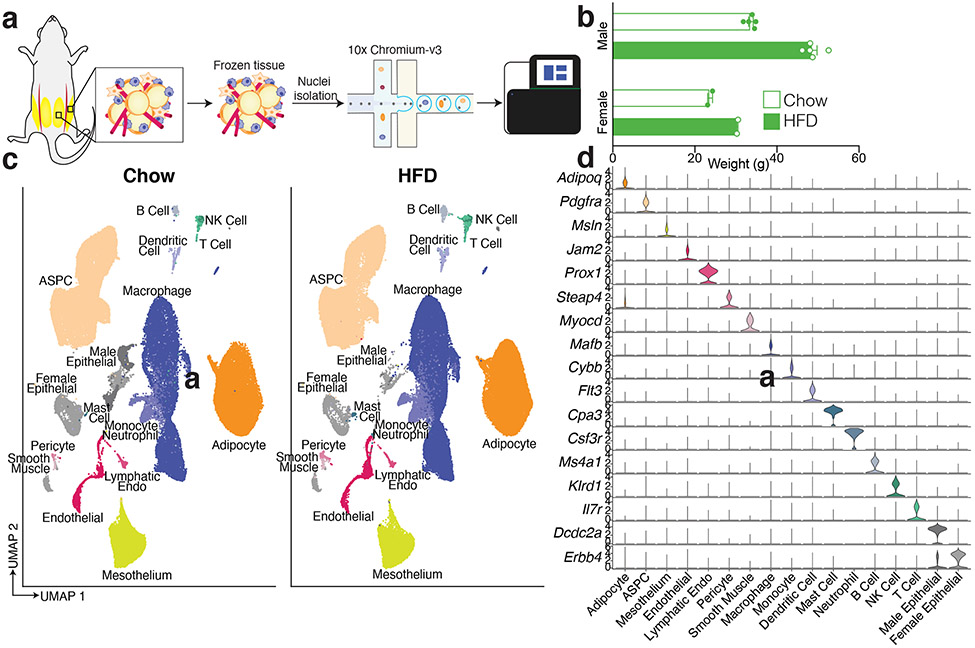
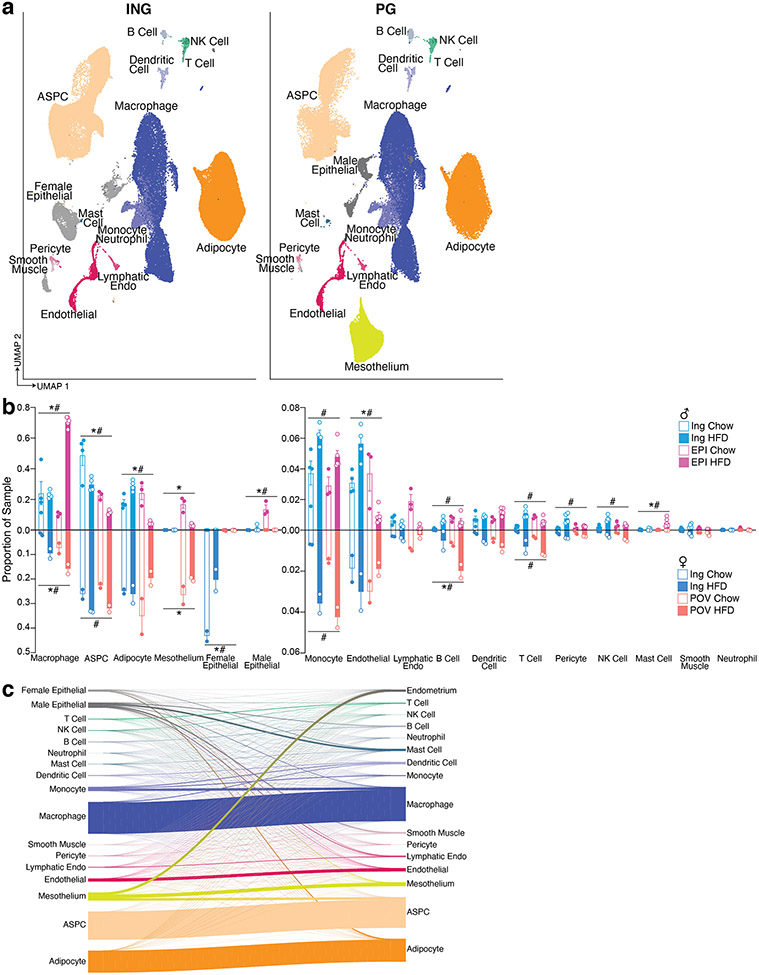
Murine models are commonly used to study adipose tissue biology14. We thus sought to compare mouse and human WAT at the single cell level by performing sNuc-seq on inguinal (ING, corresponding to human SAT) and perigonadal [PG, epididymal (EPI) in males, periovarian (POV) in females, corresponding to human VAT] adipose tissue of mice fed either a chow or high fat diet for 13 weeks (Figure 2a, b). After doublet removal and quality filtering, we considered a total of 197,721 cells (106,469 from PG and 91,252 from ING), identifying all cell types observed in human WAT (Figure 2c, d; Supplementary Table 2) with the addition of distinct male and female epithelial populations (Dcdc2a+ and Erbb4+, respectively). The female population is largely found in ING samples and resembles mammary epithelial cells, while the male population is almost exclusively found in PG samples, and as noted by others9 may represent contaminants from the epididymis and other reproductive structures that are tightly apposed to fat15. In contrast to the human data, cell type abundance in mouse WAT are highly dependent on body weight with relatively little variation between depots (Figure 2c and Extended Data Figure 2a, b, Extended Data Table 2). The proportions of cell types in mouse adipose tissue after HFD were notably different between male and female mice, which might reflect a true sex difference, or may reflect higher weight gain in males (Extended Data Figure 2b). To compare across species, we used a reference mapping algorithm to assign each mouse cell to a human cluster and noted a high degree of overall similarity between annotated mouse clusters and mapped human clusters (Extended Data Figure 2c).
Fig. 2. A single cell atlas of mouse white adipose tissue.
a, Schematic of workflow for sNuc-seq of mouse ING and PG adipose tissue. a, Body weight of chow and high fat fed animals used for sNuc-seq (n = 5 chow and 5 HFD male mice, 2 chow and 2 HFD female mice). Error bars represent standard error of the mean (SEM). c, UMAP projection of all 197,721 sequenced mouse cells split by diet. d, Marker genes for each cell population in the mouse WAT dataset.
Cells of human and mouse SVF
Vascular Cells
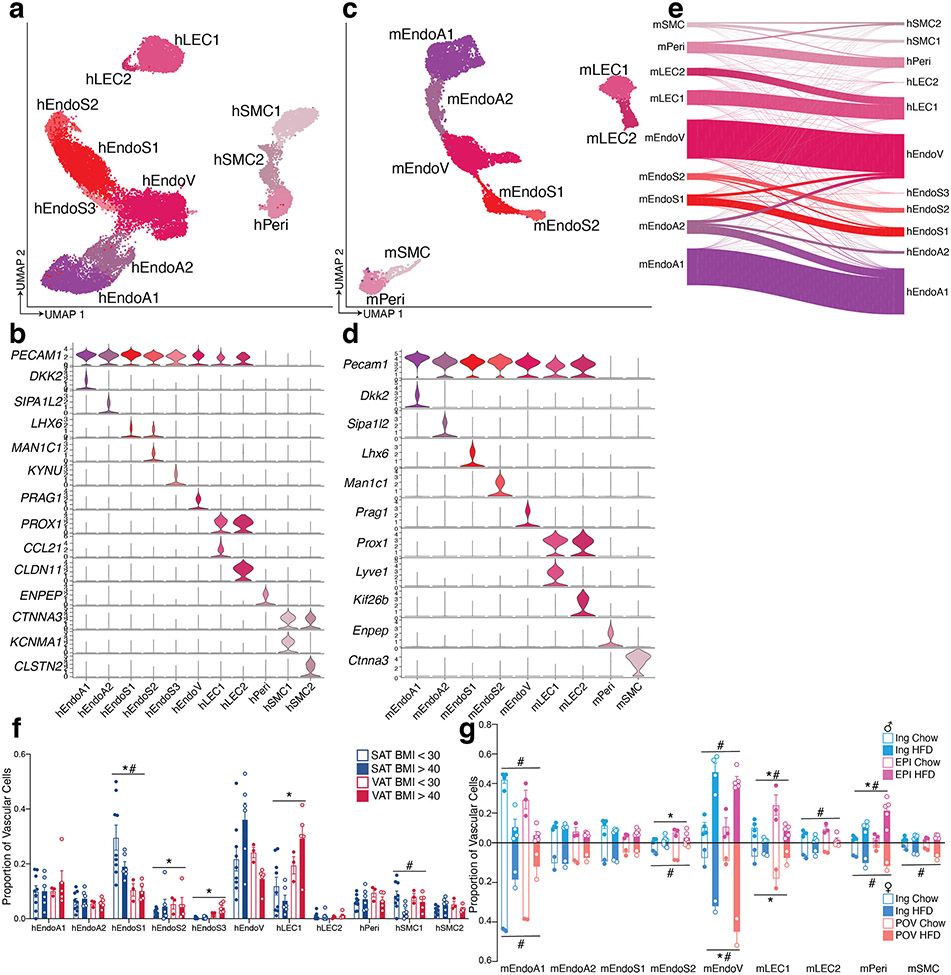
Subclustering of human vascular cells revealed expected cell types including blood endothelial clusters that represent arteriolar, stalk, and venular cells, as well as lymphatic endothelial cells (LECs), pericytes, and smooth muscle cells (SMCs) (Extended Data Figure 3a, b). Mouse vascular cells formed similar clusters (Extended Data Figure 3c, d). As expected, reference mapping demonstrated high similarity between human and mouse vascular subclusters (Extended Data Figure 3e) and proportions of subclusters were similar across species (Extended Data Figure 3f, g).
Immune Cells
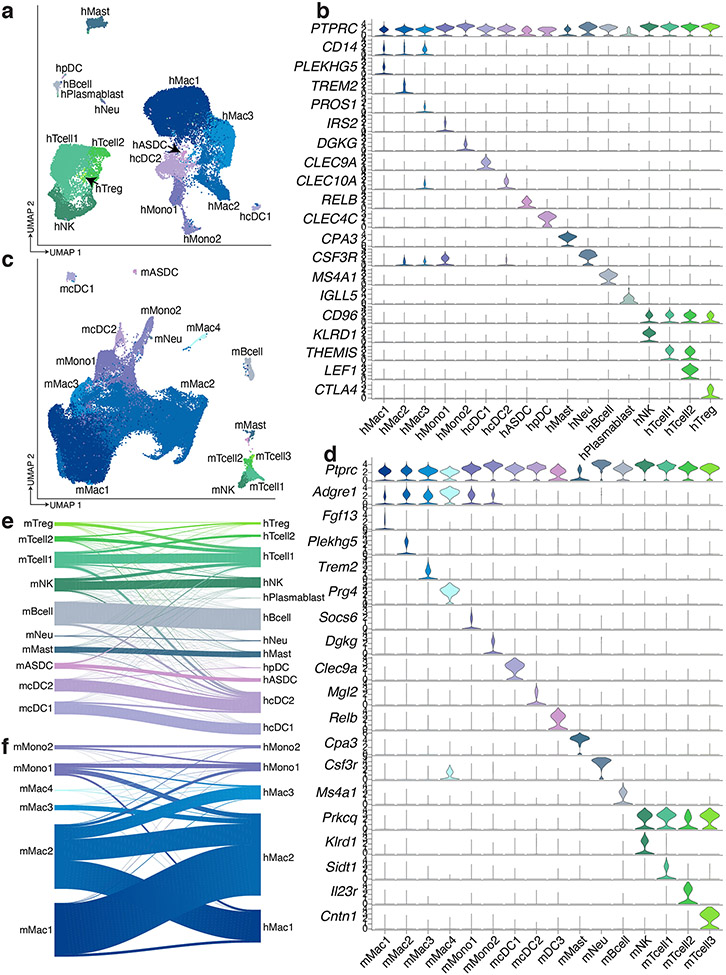
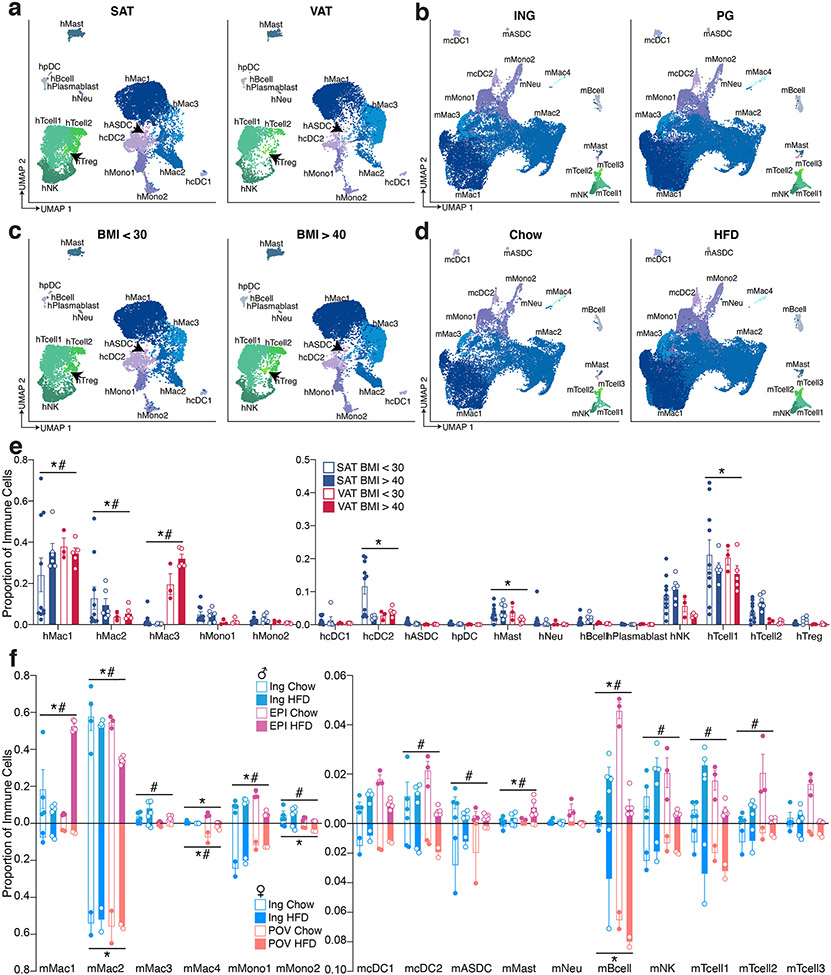
Analysis of human immune cells from scRNA-seq and sNuc-seq samples again revealed expected cell types, including multiple subpopulations of monocytes, macrophages (CD14+), dendritic cells (DCs), B and T lymphocytes, and NK cells (CD96+), mast cells (CPA3+), and neutrophils (CSF3R+) (Extended Data Figure 4a, b). Monocyte subpopulations 1 and 2 resemble classical and non-classical monocytes and DC subpopulations 1 and 2 resemble previously reported CLEC9A+ and CD1C+ populations from blood, respectively16. Lymphocytes also resemble previously reported B cell, T Cell, and NK cell populations from human WAT, including CTLA4+ hTregs17. Examination of the mouse WAT immune compartment revealed most of the same cell types, although there were notable differences in the relative abundance of myeloid and lymphoid cells between species (Extended Data Figure 4c, d). Human WAT contains somewhat fewer T/NK cells than macrophages/monocytes (~30% vs. ~60% of recovered immune cells); this imbalance was greatly exaggerated in murine WAT (macrophages ~90% of recovered immune cells vs. 3% T/NK cells). Because a wealth of data supports a key role for macrophages/monocytes in adipose biology18,19, we separated these cell types from other immune cells in silico for subsequent analysis. Mouse clusters of non-monocytes/macrophages mapped relatively well to their human counterparts, with some mixing of T and NK populations (Extended Data Figure 4e). Macrophages and monocytes also mapped well to their general class, but this association often broke down when considering macrophage subpopulations (Extended Data Figure 4f).
The proportion of immune cell populations was similar in human SAT and VAT, with a few exceptions (Extended Data Figure 5a, e). In mice, small depot-dependent differences were eclipsed by relatively huge shifts in response to diet in male mice (Extended Data Figure 5b, d, f). Most notably, HFD resulted in a massive increase in macrophage numbers, primarily in PG, consistent with a large body of prior data18,20 (Extended Data Figure 2b, 5f). Reductions in the proportion of most other immune cell types (e.g., NK cells, T and B lymphocytes, DCs, and neutrophils) are likely due to the large increase in macrophages, rather than to intrinsic loss of those specific cell types following HFD (Extended Data Figure 5b, d, f). Mast cells increase proportionally after HFD, as previously reported21. (Extended Data Figure 5f).
Accumulation of adipose tissue macrophages in obesity has also been shown in human WAT, using a combination of histomorphometry and flow sorting19,22. Our data are in general support of this conclusion, though the magnitude of the effect is significantly less prominent than that seen in mouse WAT (Extended Data 1b, 5c, e, f). The largest change involves hMac3, which is induced in visceral fat with higher BMI (Extended Data 5c, e).
Mesothelial cells
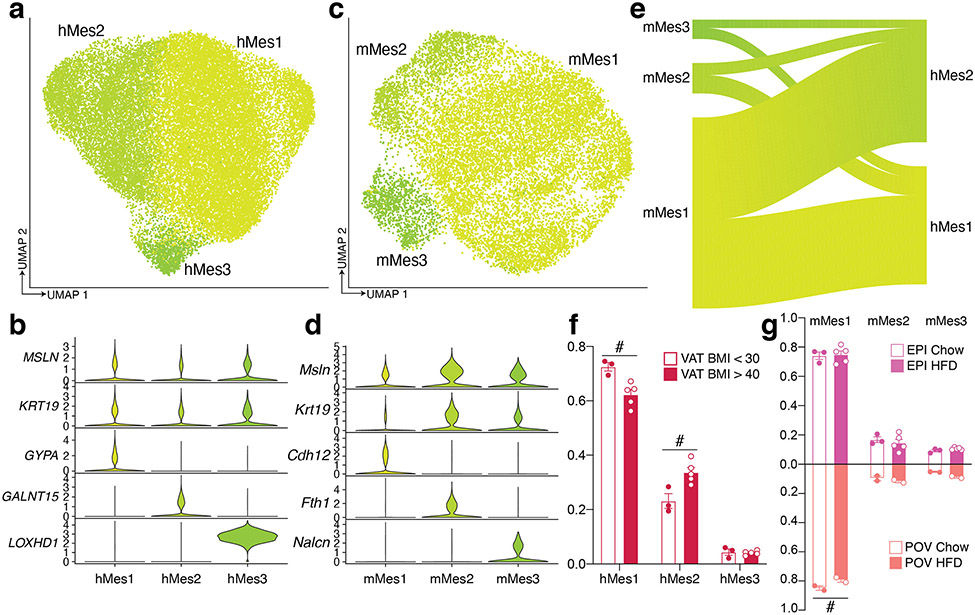
Subclustering of mesothelial cells revealed three populations in both human VAT and mouse PG (Extended Data Figure 6a-d). When mouse mesothelial clusters were mapped to human clusters, cells were split between human clusters hMes1 and hMes2, with no cells mapping to hMes3 (Extended Data Figure 6e). The proportions of most mesothelial subpopulations did not vary with obesity or high fat diet, with the exception of hMes1 and hMes2, which were reduced and increased in higher BMIs, respectively. (Extended Data Figure 6f, g).
ASPCs (see Supplementary Note 1)
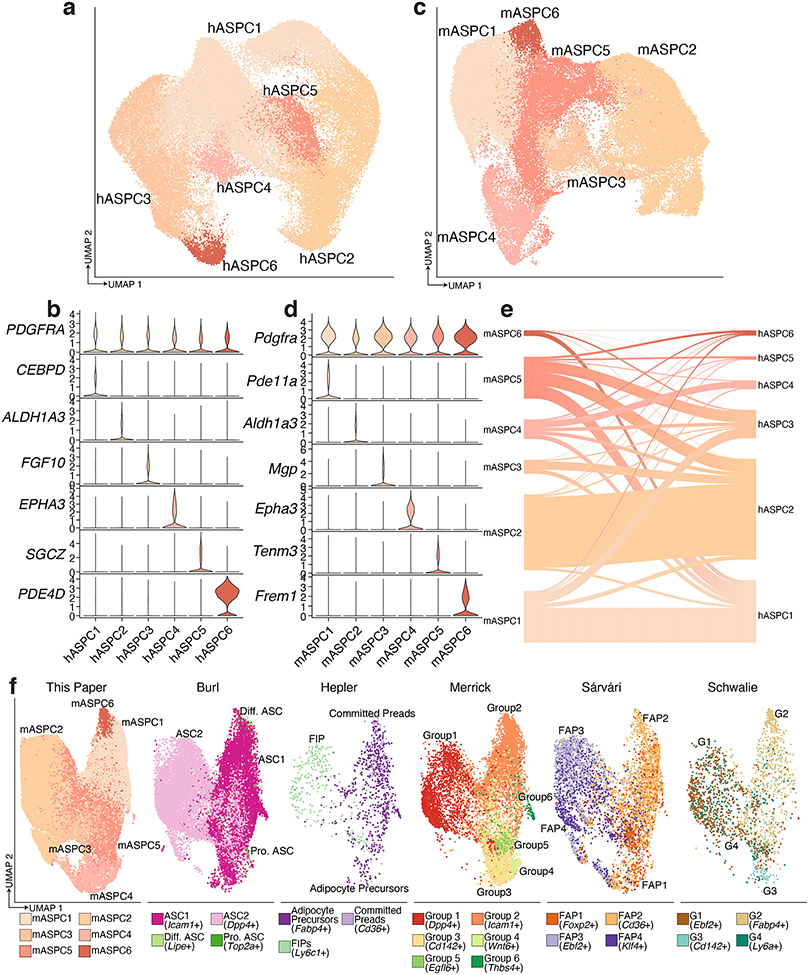
We identified six distinct subpopulations of human ASPCs in subclustered scRNA-seq and sNuc-seq samples, all of which express the common marker gene PDGFRA (Extended Data Figure 7a, b). Similarly, we noted six subpopulations in the mouse ASPC data, all of which were also Pdgfra+ and some of which correspond well with a particular human subpopulation (Extended Data Figure 7c-e). For example, mASPC2 and hASPC2 are both characterized by high expression of Aldh1a3/ALDH1A3, and strongly resemble previously identified early multipotent progenitor cells that reside in the reticular interstitium of the fat pad5. Similarly, mASPC4 and hASPC4 express Epha3/EPHA3 and likely represent the anti-adipogenic Areg population reported by Schwalie et. al.3. Seeking to better place our mouse ASPC data into the overall context of the published literature, we integrated our data with that reported by others3-6,9 and found that ASPC populations identified by individual studies were generally preserved after integration, suggesting robustness of these clusters. Specifically, the previously described Icam1+ committed progenitor, Dpp4+ early progenitor, and Cd142+ Areg populations23 cluster together across studies (Extended Data Figure 7f).
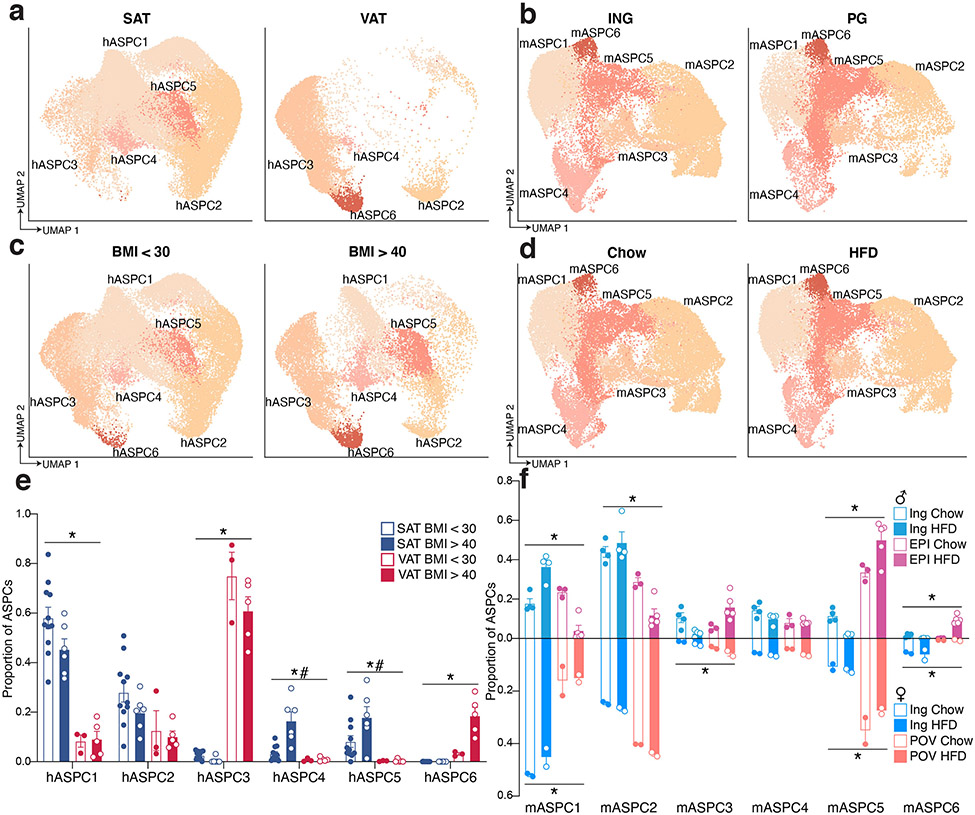
Many human and mouse ASPC subclusters showed dependency on diet, depot, or both. hASPC1, hASPC4, and hASPC5 were more prevalent in SAT than VAT, with increases in SAT hASPC4 and hASPC5 proportion in subjects with higher BMI (Extended Data Figure 8a, c, e). Conversely, hASPC3 and hASPC6 were more prevalent in VAT. In male mice, early progenitor cells (mASPC2) were notably more abundant in ING than PG and mASPC5 and mASPC6 were more prevalent in EPI vs ING, although this varied with obesity (Extended Data Figure 8b, d, f). Many of these observations are consistent with previous findings. For example, HFD has been shown to increase adipogenesis specifically in PG in mice24,25. Our data indicates that pre-adipocyte subclusters like mASPC6 increase dramatically in response to HFD in PG only. The loss of early progenitors (mASPC2) in PG with HFD is consistent with conversion of these cells along the differentiative pathway, i.e., toward mASPC6 (Extended Data Figure 8b, d, f).
Unique populations of human adipocytes
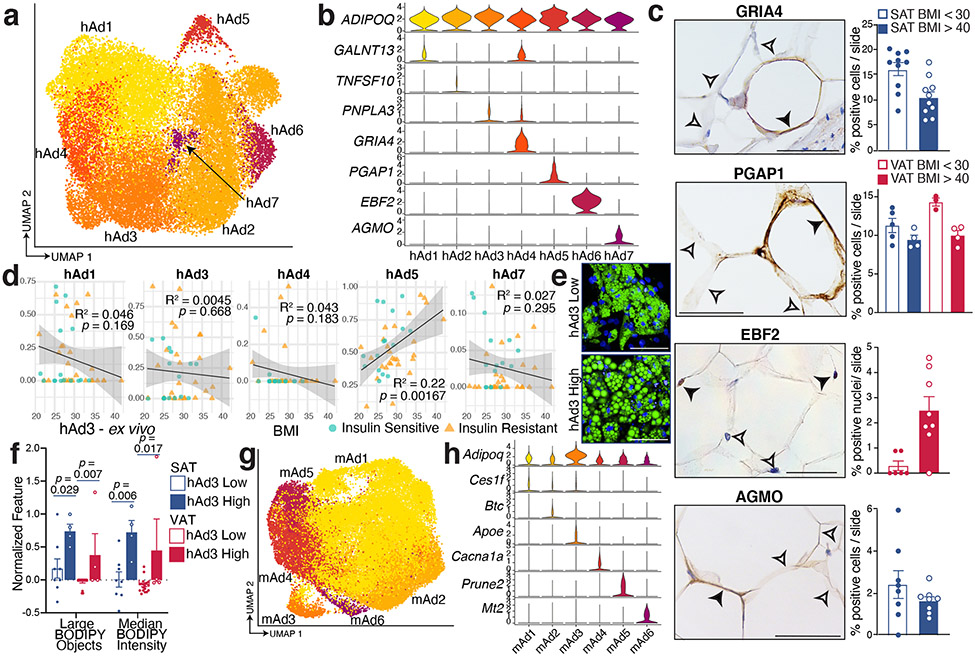
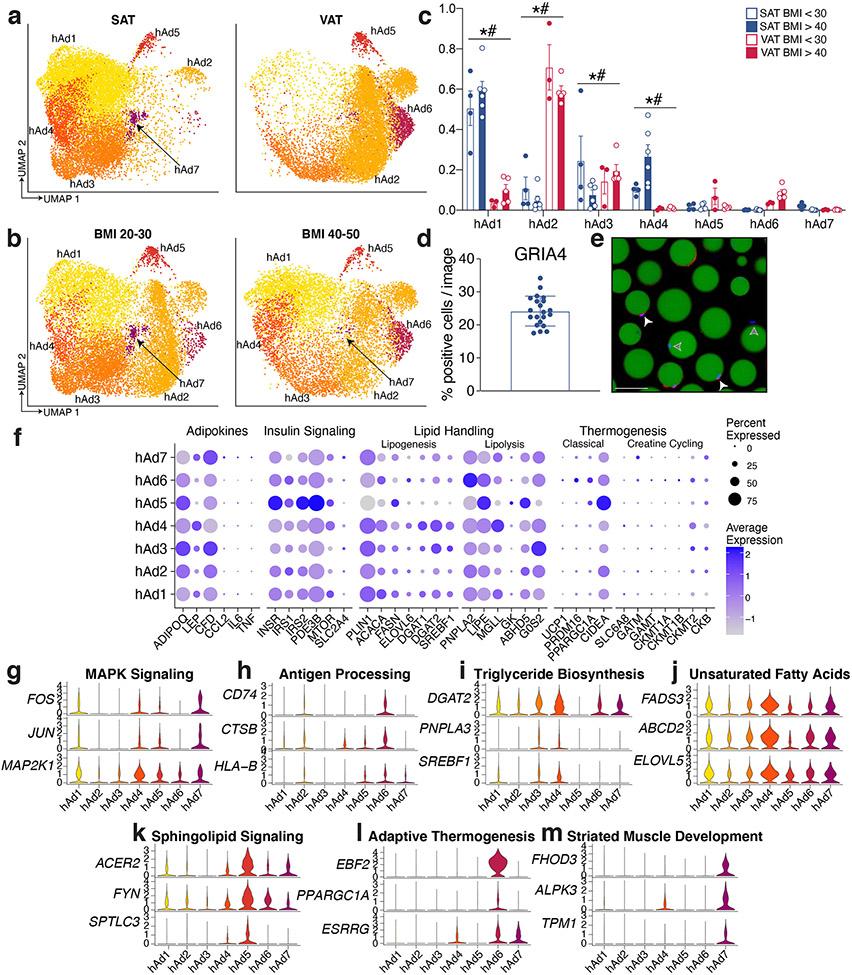
White adipocytes are generally considered to be monotypic and essentially uniform in function, although some recent studies have begun to challenge this assumption8-10,26 The high resolution of our data enabled us to find that human white adipocytes cluster into seven subpopulations with distinct markers (Figure 3a-b). We noted strong depot-specific associations of adipocyte subtypes, with hAd1, hAd3, hAd4, and hAd7 localized primarily to SAT, while hAd2 and hAd6 were almost exclusively found in VAT. hAd5 represents a smaller population that is roughly equally distributed between SAT and VAT (Extended Data Figure 9a-c). We also noted a BMI-dependent shift in adipocyte subtype within both depots (Extended Data Figure 9b, c). Importantly, all adipocyte subpopulations are present in the majority of subjects, indicating that these subtype designations are generalizable and do not reflect sample-specific variation (Extended Data Figure 9c). Immunohistochemistry (IHC) and/or immunofluorescence of markers for hAd4, hAd5, hAd6, and hAd7 in human SAT or VAT identified specific subpopulations of adipocytes at proportions similar to those seen in the single cell data (Figure 3c and Extended Data Figure 9 d, e). To examine whether SAT subtype proportion was influenced by BMI in a larger dataset, we estimated individual subtype proportions by deconvolution analysis of bulk RNA-seq data from purified isolated subcutaneous human adipocytes from 43 women (Figure 3d). This analysis showed that clusters hAd4 and hAd7 trend to negative correlation with BMI, aligning with our IHC findings, while hAd5 proportion is positively correlated with BMI. Visceral adipocytes are absent from this dataset and so we were unable to assess the prevalence of hAd2 or hAd6 in this cohort, although IHC of hAd6 marker EBF2 also suggests its prevalence may be positively correlated with BMI (Figure 3c).
Fig. 3. Subclustering of human and mouse adipocytes reveals multiple distinct populations that vary across depot and diet.
a, UMAP projection of clusters formed by 25,871 human white adipocytes. b, Expression of adipocyte marker ADIPOQ and specific marker genes for each adipocyte subpopulation. c, IHC for marker genes of adipocyte subpopulations hAd4, hAd5, hAd6, and hAd7 in human adipose tissue and percentage of positive adipocytes per slide in lean and obese individuals (GRIA4: 5 lean, 5 obese, 2 slides each; PGAP1: 5 lean SAT, 4 obese SAT, 3 lean VAT, 4 obese VAT, 1 slide each; EBF2: 3 lean, 4 obese, 2 slides each; AGMO: 4 lean, 4 obese, 2 slides each). Scale bars are 25 μm for GRIA4, EBF2, and AGMO, 20 μm for PGAP1. d, Estimated proportions of adipocyte subpopulations in bulk RNA sequencing data of enzymatically isolated subcutaneous adipocytes from 43 individuals plotted against BMI. p values were calculated using an F-test (with null hypothesis slope = 0), error bands represent a confidence level of 0.95. e, Representative images of ex vivo differentiated human subcutaneous adipocytes predicted to have low or high hAd3 content based on deconvolution of bulk RNA sequencing data. Green represents BODIPY staining, blue represents Hoechst staining. Scale bars are 100 μm. f, Normalized count of BODIPY-related features in ex vivo differentiated adipocytes stratified into hAd3 low and high populations. Points represent normalized feature for cultures derived from individual subjects, n = 8 hAd3 low SAT, 4 hAd3 high SAT, 19 hAd3 low VAT, 4 hAd3 high VAT. g, UMAP projection 39,934 mouse white adipocytes. h, Expression of Adipoq and marker genes for each mouse adipocyte subpopulation. For bar graphs, error bars represent SEM, p values were calculated using two tailed t-tests with no correction for multiple comparisons.
A critical question is whether individual adipocyte subpopulations have specific functions. To assess this, we first looked at genes that participate in the major metabolic activities of adipocytes. All subpopulations expressed these genes, although their relative amounts differed. Thus, the adipokines adiponectin and adipsin (CFD) are most highly expressed in hAd3, and insulin signaling components like INSR, IRS1 and IRS2 are most highly expressed in hAd5 (Extended Data Figure 9f). We next looked more holistically at the data by performing pathway analysis for markers of each subpopulation (Supplementary Table 3, Extended Data Figure 9g-m). Subpopulations hAd1, which accounts for ~40% of SAT adipocyte nuclei, and hAd2, which accounts for ~60% of VAT adipocyte nuclei, have relatively few specific markers, and the pathways that emerged were similarly bland (Extended Data Figure 9g, h). These populations likely represent “basal” subcutaneous or visceral adipocytes, so we therefore focused on subpopulations hAd3-hAd7 for more detailed analysis. hAd3 was associated with “triglyceride biosynthesis” and included higher expression of DGAT2, SREBF1, and PNPLA3 (Extended Data Figure 9i). The hAd4 cluster expresses the highest amounts of several fatty acid desaturases, including ELOVL5 and FADS3 (Extended Data Figure 9j), which is particularly interesting in light of the insulin-sensitizing role of unsaturated lipokines such as palmitoleate27. hAd5 adipocytes, besides having the highest expression of several insulin signaling genes, were also characterized by expression of “sphingolipid signaling genes” (Extended Data Figure 9k). Both hAd3 and hAd4 exhibit high expression of lipogenic genes, while lipolytic gene expression is higher in hAd5 (Extended Data Figure 9f).
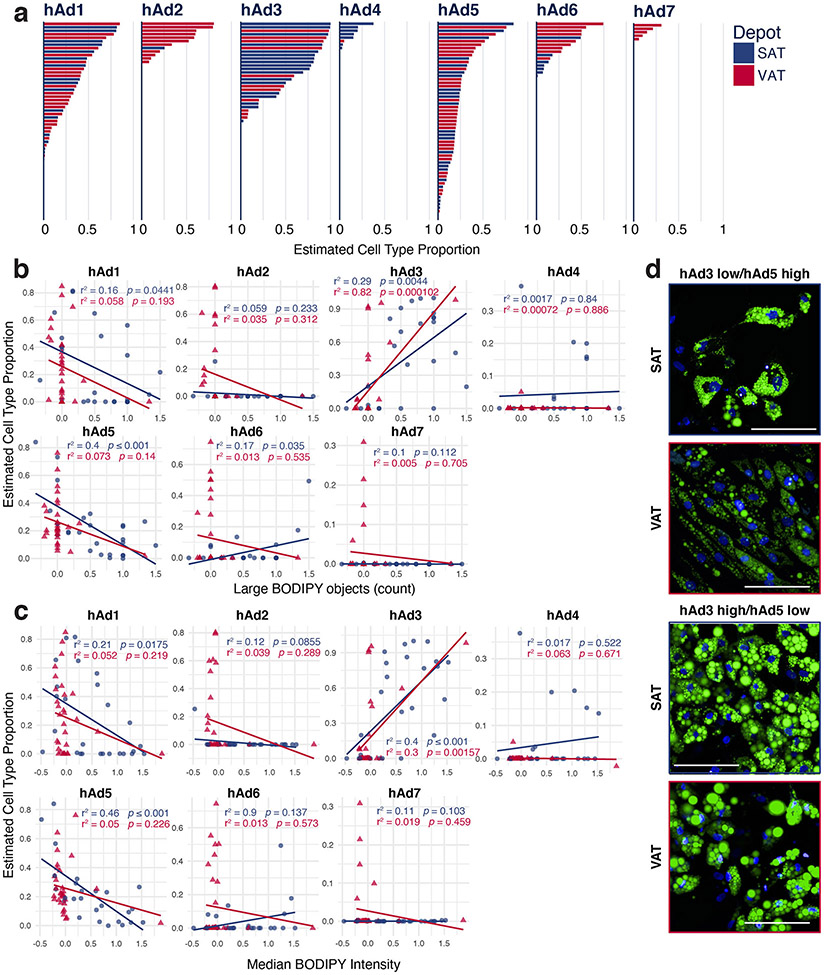
We next asked whether cultured human adipocytes retain evidence of subpopulation diversity. To that end, we utilized 57 RNA-seq datasets from human subcutaneous and visceral adipocyte progenitors differentiated ex vivo over a 14 day timecourse28. Deconvolution analysis revealed that many subpopulations identified in vivo were retained in the dish. Furthermore, much of the previously noted depot selectivity was recapitulated, such that the visceral subpopulations hAd2 and hAd6 were significantly more likely to appear in cultured visceral cells and the subcutaneous subpopulation hAd4 was overrepresented in cultured subcutaneous cells (Extended Data Figure 10a). Furthermore, because these cultured samples were also subjected to high-content image-based profiling using LipocyteProfiler28, we were able to correlate individual subpopulations with image-based features representing morphological and cellular phenotypes including lipid and mitochondrial content. Thus, ex vivo differentiated adipocyte cultures predicted to have high amounts of hAd3, associated with high lipogenic gene expression and lower lipolytic gene expression, have more overall lipid and larger lipid droplets (Figure 3e, f). Conversely, ex vivo differentiated adipocyte cultures with high predicted hAd5 content have less overall lipid and smaller lipid droplets, consistent with a higher ratio of lipolytic to lipogenic gene expression (Extended Data Figure 10b-d).
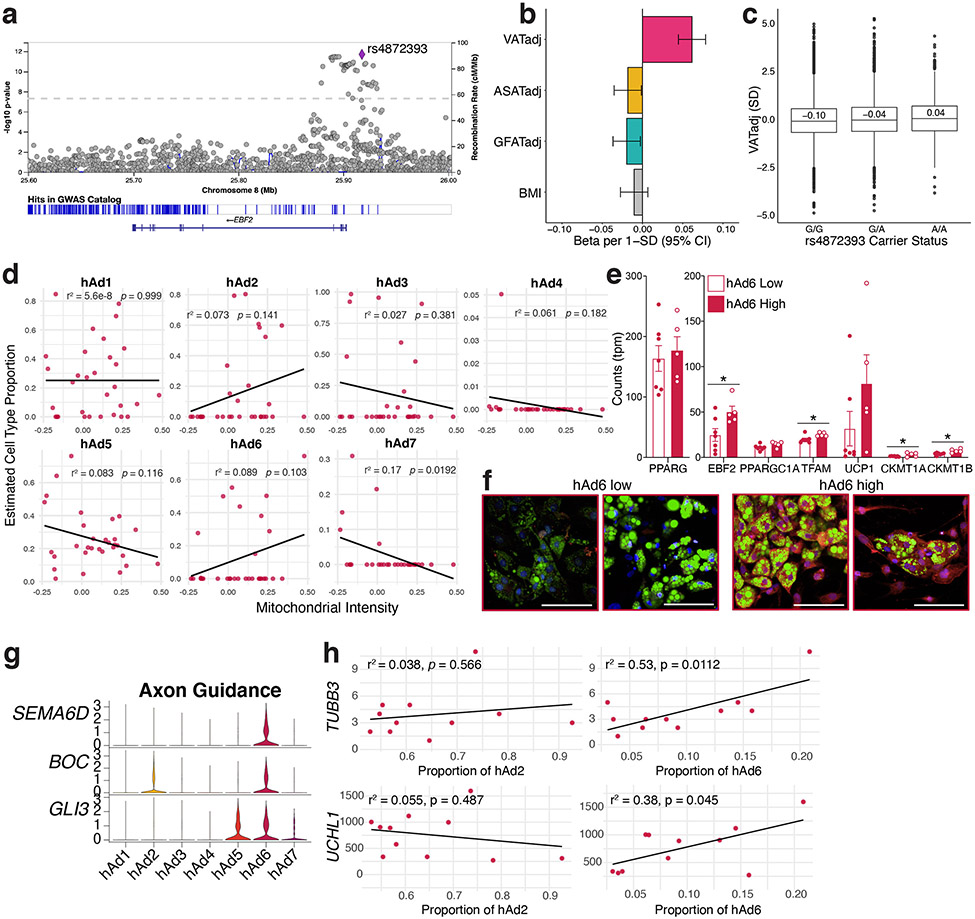
One particularly interesting adipocyte subpopulation is hAd6, which selectively expresses genes typically associated with thermogenesis, such as EBF2, ESRRG, and PPARGC1A (Extended Data Figure 9l), a surprising finding given that this population is almost exclusively visceral (Figure 3c, Extended Data Figure 9a, c). To better understand the relationship between this subpopulation and visceral adiposity, we looked further into the hAd6 marker EBF2, which has previously been identified as a pro-thermogenic transcription factor29. SNPs at the EBF2 locus are associated with waist-hip ratio (WHR)30, which could involve actions in either SAT or VAT. Interestingly, however, a recent study of GWAS loci associated with adiposity in specific depots31 found a common variant 15 kb upstream of EBF2 associated specifically with VAT (Extended Data Figure 11a). Further analysis revealed that the minor allele of this SNP (MAF = 0.23) was associated with VAT adjusted for BMI and height (VATadj: beta = 0.062 SD per allele, p = 1.0 x 10⁻¹²), but not abdominal subcutaneous (ASAT) or gluteofemoral (GFAT) depots (ASATadj: beta = −0.018 SD per allele, p = 0.03), GFATadj: beta = −0.020 SD per allele, p = 0.02, Extended Data Figure 11b). We additionally stratified individuals into either 0, 1, or 2 carriers of the minor allele and observed an additive trend (G/G median VATadj −0.10 SD, G/A median VATadj = −0.04 SD, A/A median VATadj 0.04 SD; Extended Data Figure 11c). Next, we returned to the visceral human adipocytes differentiated ex vivo, and found that samples predicted to have a higher proportion of hAd6 adipocytes were characterized by higher mitochondrial intensity and increased expression of mitochondrial and thermogenic genes (Extended Data Figure 11d-f). Finally, our analysis of hAd6 markers suggested other pathways associated with thermogenesis, including one for “axon guidance” (Extended Data Figure 11g). We could not measure innervation directly using our data, because the nuclei of innervating sympathetic neurons are located in the spinal ganglia and not the fat depot itself. Nonetheless, we estimated the degree of innervation using the presence of neuron-specific gene expression in the ambient RNA of our visceral sNuc-seq samples. Indeed, the amount of pan-neuronal markers like TUBB3 and UCHL132 strongly correlate with hAd6 proportion (Extended Data Figure 11h), further supporting a role for hAd6 as a novel visceral adipocyte subtype with thermogenic potential.
Mouse adipocyte subpopulations
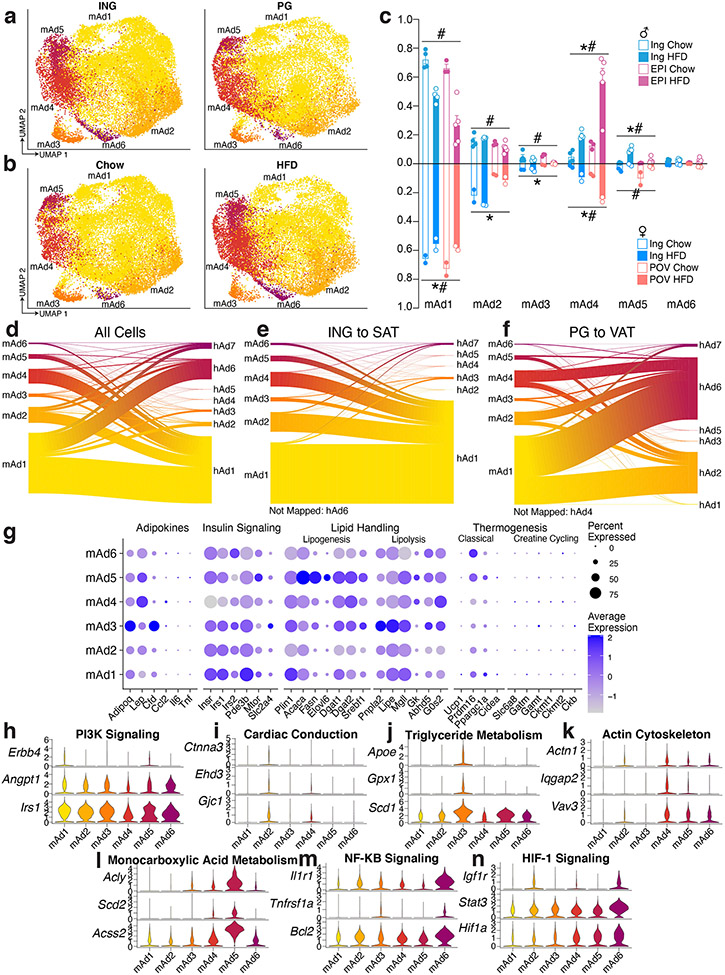
Subclustering mouse adipocytes revealed six subpopulations (Figure 3g, h). Unlike human adipocytes, mouse adipocyte subtypes exhibit little depot enrichment (Extended Data Figure 12a-c). There was strong diet-dependency, however, as relative proportions of mAd1 and mAd3 were reduced after HFD, while the opposite was noted for mAd4 and mAd5 (Extended Data Figure 12b, c). In contrast to the relatively good cross-species concordance between immune cells, vascular cells, and ASPCs, mouse adipocytes do not map cleanly onto human adipocyte subpopulations (Extended Data Figure 12d-f).
As in humans, genes associated with major adipocyte functions showed some subpopulation selectivity in mice. For example, lipogenesis genes were highest in HFD-induced population mAd5 (Extended Data Figure 12c, g). More detailed pathway analysis on mouse adipocyte subpopulations (Supplementary Table 3) showed that the chow-associated clusters mAd1-3 were notably enriched in metabolic pathways, particularly those involved in lipid handling (Extended Data Figure 12h-j). The HFD-associated clusters mAd4-6, on the other hand, were linked to pathways like “HIF-1 signaling”, “actin cytoskeleton”, and “NF-kB signaling” (Extended Data Figure 12k-n), consistent with the known roles of hypoxia, cytoskeletal remodeling, and inflammation in HFD-induced adipose dysfunction and insulin resistance23-25.
Our data allows us to address an important question: are diet-induced changes in gene expression at the population level shared among subpopulations or do they reflect a change in the relative proportion of these subpopulations? To assess this, we examined the twenty most positively and negatively regulated genes from a TRAP-based RNA-seq experiment in white adipocytes from mice fed chow or high fat diet34 (Supplementary Figure 2a). We noted that some genes (e.g., Cyp2e1 and Fam13a) exhibit elevated expression in chow adipocytes in virtually all subpopulations, while for others (e.g., Cfd), expression is largely driven by the mAd3 population which decreases in abundance with HFD (Extended Data Figure 12b,c, Supplementary Figure 2b). Similarly, Sept9, Cdkn1a, and Fgf13 show increased gene expression after HFD across almost all subpopulations while other HFD-induced genes (e.g., Slc5a7 and Dclk1) increase their expression after HFD in the chow-associated clusters mAd1-4 but not in the HFD-associated clusters mAd5-7 (Supplementary Figure 2b). Thus, diet-dependent expression changes reflect both alterations across all clusters and the emergence or disappearance of distinct populations.
Finally, we were somewhat surprised that we did not see a murine population that could be clearly delineated as thermogenic. Such cells have been noted by others in WAT, even at room temperature36. However, when we considered the chow adipocytes independently, mAd1 split into three clusters (Supplementary Figure 3a, b). Two of these clusters, mAd1B and mAd1C, were recognizable as thermogenic beige adipocytes, with relatively high expression of Prdm16 and Ppargc1a in mAd1B and even higher expression of these genes, as well as expression of Ucp1 and Cidea in mAd1C (Supplementary Figure 3c). As expected, the thermogenic mAd1B and mAd1C subpopulations were enriched in ING vs. PG samples (Supplementary Figure 3d, e).
Cell-cell interactions in adipose tissue
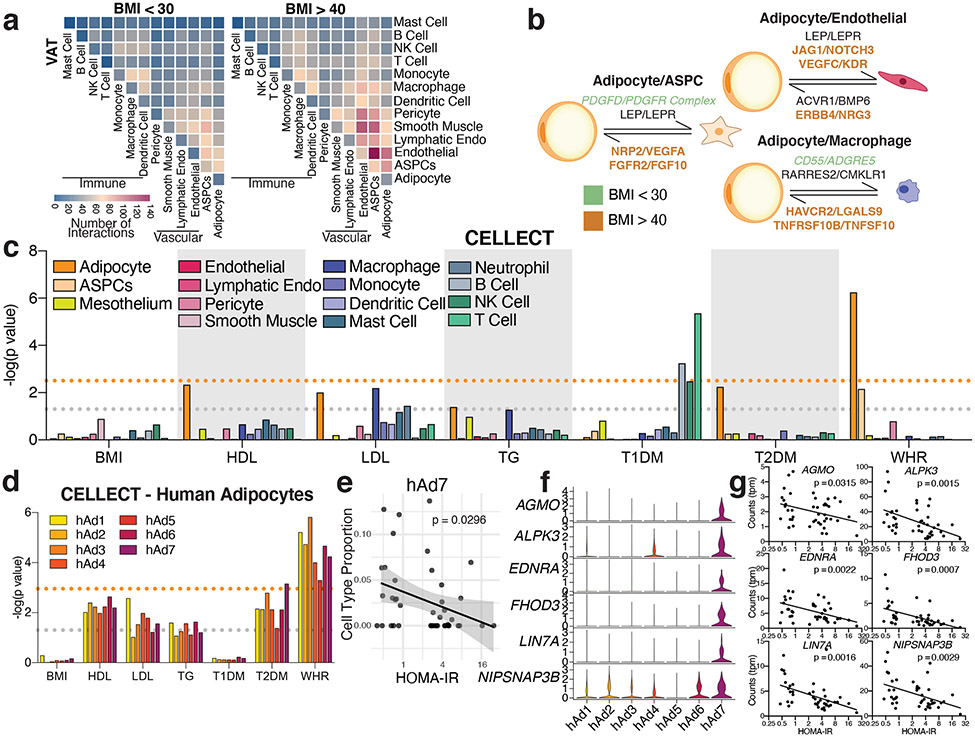
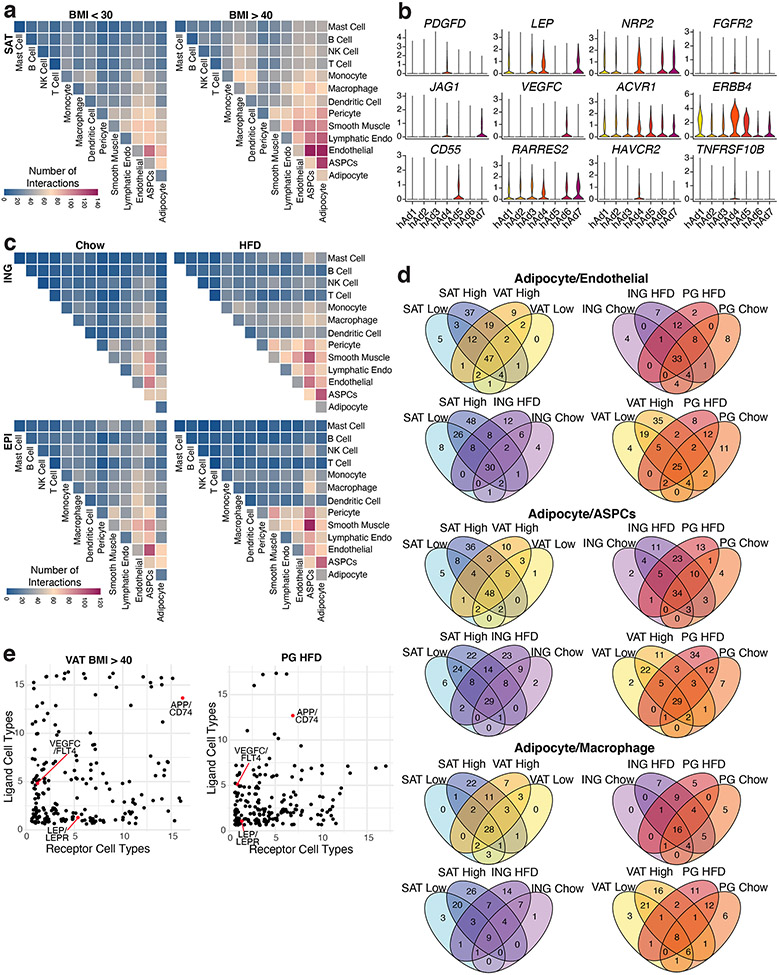
The functions of WAT are known to be coordinated by neural and hormonal cues from outside the fat pad37. There is growing appreciation, however, that intercellular communication within the depot is also critical for the WAT response to overnutrition and other stressors38. In particular, attention has focused on cross-talk between adipocytes and immune cells (especially macrophages) in the context of obesity39. To assess potential interactions between all identified cell types in different depots and at different body mass, we utilized CellPhoneDB40, which uses the expression of ligand-receptor pairs as a proxy for intercellular communication (Supplementary Table 4, 5). As expected, we detected increased potential communication between human adipocytes and macrophages in high BMI vs. low BMI subjects; of 84 potential interactions identified between human adipocytes and macrophages, 40 (48%) were specific for high BMI subjects, while only 3 (4%) were specific for low BMI subjects (Figure 4a, Extended Data Figure 13a, d). Notably, obesity was also associated with robustly increased expression of genes encoding ligand-receptor pairs between adipocytes and many non-immune cell types, including blood and lymphatic endothelial cells, vascular SMCs, pericytes, and ASPCs (Figure 4a, b, Extended Data Figure 13a, d). For example, of 145 potential interactions identified between human adipocytes and endothelial cells, 65 (45%) were specific for high BMI subjects, while only 6 (4%) were specific for low BMI subjects (Extended Data Figure 13d). Potential interactions between these cell types are frequently bidirectional, and receptors are often expressed on multiple cell types, suggesting networks of communication (Figure 4b, Extended Data Figure 13e). We also noted differential expression of ligands and receptors within human adipocyte subpopulations, lending further support to the idea that they carry out distinct functions (Extended Data Figure 13b). The specific interactions upregulated during obesity suggest that adipocytes play a significant role in obesity-related adipose tissue remodeling. For example, adipocyte expression of angiogenic factors like JAG1 and VEGFC is increased in the obese state, as is true of the expression of their receptors (e.g., NOTCH3 and KDR) on endothelial cells, consistant with obesity-associated induction of angiogenesis by adipocytes41 (Figure 4b, Supplementary Table 6).
Fig. 4. Extensive cell-cell interactions in WAT and associations with human disease traits.
a, Heatmap showing number of significant interactions identified between cell types in VAT of low (<30) and high (>40) BMI individuals as determined by CellphoneDB. b, Selected interactions between adipocytes and ASPCs, endothelial cells, and macrophages identified using CellphoneDB; orange and green indicate interactions that are significant only in BMI > 40 or only in BMI >30, respectively. c, CELLECT p values of the association between cell types in the human adipose sNuc-seq dataset with GWAS studies. The grey line represents p = 0.05 and the orange line represents significant p value after Bonferroni adjustment (p = 0.003), based on number of cell types queried. Both T2D and WHR were BMI-adjusted. d, CELLECT p values for adipocyte subpopulations. The grey line represents p = 0.05 and the orange line represents significant p value after Bonferroni adjustment (p = 0.001), based on all cell subtypes queried. e, Estimated cell type proportion of hAd7 in bulk RNA-seq data of enzymatically isolated subcutaneous adipocytes from 43 individuals plotted against HOMA-IR. For line of best fit, R2 = 0.11, the error band represents a confidence level of 0.95. f-g, Expression of hAd7 marker genes negatively correlated with HOMA-IR in human adipocyte subpopulations (f) and bulk RNA sequencing data of human adipocytes (g). For scatterplots, p values were calculated using an F-test with the null hypothesis that the slope = 0.
Analysis of the mouse data yielded similar results, as HFD increased the intensity of ligand-receptor pair expression, with the most prominent interactions again occurring between non-immune cell types, especially between ASPCs and adipocytes, pericytes, and SMCs (Extended Data Figure 13c). Interestingly, adipose niche interactions were only modestly conserved between mouse and human. (Extended Data Figure 13d). Interactions between WAT cell types include several that have been studied, such as the effect of the adipokine leptin on endothelial cells via LEPR42, and the actions of TGFB1 on adipose fibrosis via TGFBR134. The majority of these interactions, however, are unstudied in the context of WAT biology.
WAT cell types and human disease
Adiposity is associated with a wide range of metabolic diseases and traits, and GWAS studies have suggested a specific link between WAT and coronary artery disease (CAD), BMI-adjusted T2D, dyslipidemia, and BMI-adjusted waist-hip ratio (WHR, a measure of body fat distribution)43-45. To determine which specific cell types in WAT are likely to mediate these associations, we employed CELLECT, a method for integrating scRNA-seq and sNuc-seq data with GWAS46. As expected, Type 1 Diabetes (T1D) was significantly associated with B and T lymphocytes and NK cells, consistent with the known autoimmune basis of that disease (Figure 4c). No WAT cell type associated with BMI, as expected given the strong neuronal basis of body weight regulation47. The strongest phenotypic association for white adipocytes was with BMI-adjusted WHR, and associations approaching significance were also noted between adipocytes and HDL and BMI-adjusted T2D (Figure 4c, Supplementary Table 7).
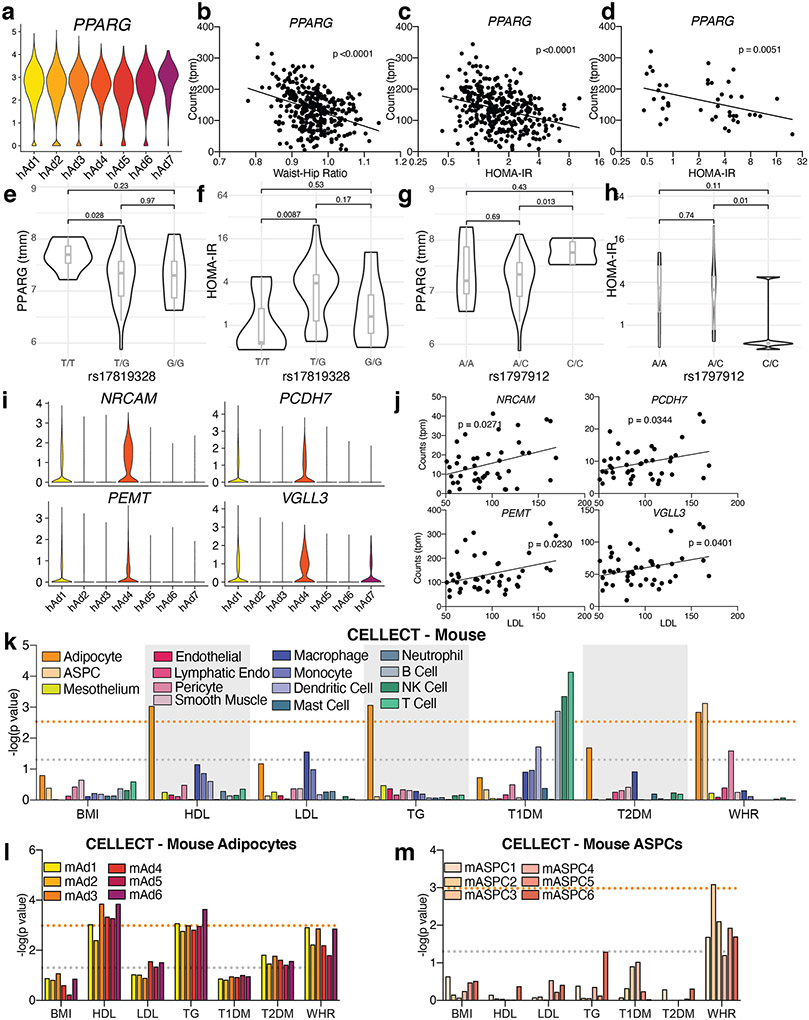
All adipocyte subpopulations were significantly associated with WHR (Figure 4d), so we looked for genes responsible for the association with WHR that lack specificity for any particular adipocyte subpopulation. One such gene is PPARG, which is highly expressed in all adipocytes (Extended Data Figure 14a). Data from the METSIM cohort indicates a strong inverse relationship between WHR and PPARG in whole WAT (Extended Data Figure 14b). Unfortunately, WHR was not recorded in the cohort used to generate our floated human adipocytes. WHR is, however, highly correlated with HOMA-IR11, and we found that PPARG expression showed a strong inverse relationship with HOMA-IR in both the METSIM cohort and in our floated adipocytes (Extended Data Figure 14c, d). Furthermore, SNPs in the PPARG gene that are associated with BMI-adjusted WHR30 are also significantly associated with PPARG mRNA and HOMA-IR in our floated adipocyte cohort (Extended Data Figure 14e-h).
Adipocytes were also the cell type most likely to mediate the association of WAT with T2D, with the strongest association specifically with hAd7 (Figure 4d). To further investigate the association between hAd7 and T2D, we plotted the abundance of hAd7 as a function of HOMA-IR in our deconvolved floated adipocyte data. This revealed that hAd7 shows significant inverse correlation with insulin resistance (Figure 4e). We then searched for specific hAd7 marker genes that exhibit this same relationship with HOMA-IR, and identified several (Figure 4f, g). Of note, AGMO (also called TMEM195) has emerged as a candidate locus in T2D GWAS48,49. Taken together, our data suggest that hAd7 may have an outsized influence on the risk of T2D, despite representing only ~1% of human adipocytes.
Additionally, although adipocytes did not meet genome-wide significance for an association with LDL, we were struck by the near significant relationship between LDL and hAd1, and to a lesser extent, hAd4 (Figure 4c, d). Several hAd1 and hAd4 selective genes showed a strong positive relationship with LDL in our floated adipocyte cohort (Extended Data Figure 14i, j)
We also performed CELLECT using the mouse data and noted associations between BMI-adjusted WHR and murine adipocytes and pre-adipocytes (Extended Data Figure 14k-m). This suggests that WHR may be determined in large part by alterations in adipocyte differentiation, a hypothesis consistent with the PPARG data above, and with independent studies of different WHR genes50. HDL and TG are also associated with mouse white adipocyte gene expression (Extended Data Figure 14k-m).
Discussion
Here, we present a comprehensive atlas of human and mouse WAT across depot and body mass. Our analysis reveals a rich array of cell types, including blood and lymphatic vascular cells, immune cells, and ASPCs, in addition to adipocytes. These cell types are grossly similar across species, but differ more profoundly when cellular subpopulations are explored. It is tempting to attribute these subpopulation differences to divergence across 65 million years of evolution, but other factors also need to be considered. For example, the human samples were collected after a fast, while the mice were harvested after ad libitum feeding, which might be expected to cause some differences in cell state related to insulin signaling or related pathways.
Overall, our data highlight a central role for adipocytes in the local regulation of the adipose depot as well as in systemic physiology. The single cell resolution of our dataset enables the identification of heterogeneity that cannot be appreciated by bulk RNA sequencing, such as a potentially visceral thermogenic subpopulation (hAd6), and a rare subpopulation associated with T2DM (hAd7). We additionally provide a framework for mouse-human comparison in studies of adipose tissue that will be an important resource for groups hoping to translate murine findings to human treatments. These data provide a lens of unprecedented acuity that better informs our understanding of WAT biology and enables a deeper exploration of the role of adipose tissue in health and disease.
METHODS
Collection of human adipose tissue samples.
Drop-Seq and Floated adipocyte bulk RNA-seq
Subcutaneous adipose tissue was collected under Beth Israel Deaconess Medical Center Committee on Clinical Investigations IRB 2011P000079. Potential subjects were recruited in a consecutive fashion, as scheduling permitted, from the plastic surgery operating room rosters at Beth Israel Deaconess Medical Center. Male and female subjects over the age of 18 undergoing elective plastic surgery procedures and free of other acute medical conditions were included and provided written informed consent preoperatively. Excess adipose tissue from the surgical site was collected at the discretion of the surgeon during the normal course of the procedure. Subjects with a diagnosis of diabetes, or taking insulin-sensitizing medications such as thiazolidinediones or metformin, chromatin-modifying enzymes such as valproic acid, anti-retroviral medications, or drugs known to induce insulin resistance such as mTOR inhibitors or systemic steroid medications, were excluded.
sNuc-Seq
Subcutaneous and visceral adipose tissue was collected under BIDMC Committee on Clinical Investigations IRB 2011P000079 and University of Pittsburgh Medical Center STUDY 19010309. At BIDMC, potential subjects were recruited in a consecutive fashion, as scheduling permitted, from the gynecological, vascular, and general surgery rosters. Male and female subjects over the age of 18 undergoing plastic surgery (panniculectomy, thighplasty or deep inferior epigastric perforators), gynecological surgery (total abdominal hysterectomy and bilateral salpingo-oophorectomy) or general surgery (cholecystectomy (CCY) or colin polyp surgery) and free of other acute medical conditions were included and provided written informed consent preoperatively. Excess adipose tissue from the surgical site was collected at the discretion of the surgeon during the normal course of the procedure. The exclusion criteria were any subjects taking thiazolidinediones, chromatin-modifying enzymes such as valproic acid, anti-retroviral medications, and drugs known to induce insulin resistance such as mTOR inhibitors or systemic steroid medications. At UPMC, inclusion criteria were patients receiving bariatric surgery (Vertical Sleeve Gastrectomy or Roux en Y Gastric Bypass) or lean controls (hernia or CCY surgeries) ages 21-60, exclusion criteria were diagnosis of diabetes (Type 1 or Type 2), pregnancy, alcohol or drug addiction, bleeding or clotting abnormality, or inflammatory abdominal disease. All patients provided written informed consent preoperatively. Excess adipose tissue from the surgical site was collected at the discretion of the surgeon during the normal course of the procedure. 200-500 mg samples were flash frozen immediately after collection for downstream processing.
Mouse adipose tissue samples
All animal experiments were performed under a protocol approved by the BIDMC Institutional Animal Care and Use Committee. Male C57Bl/6J 16-week-old high fat diet fed (JAX 380050) and chow fed (JAX 380056) mice were obtained from The Jackson Laboratory and maintained on 60% high fat diet (Research Diets, D12492) or chow diet (8664 Harlan Teklad, 6.4% wt/wt fat), respectively, for three weeks before sacrifice at 19 weeks. Female 6-week-old chow fed C57Bl/6J mice (JAX 380056) were maintained on 60% high fat diet for 13 weeks before sacrifice at 19 weeks. Mice were maintained under a 12 hr light/12hr dark cycle at constant temperature (23°C) and humidity in the range of 30%-70% with free access to food and water. There were no calculations performed to determine sample size. Animals were not randomized and researchers were not blinded to the diet of the animal due to the nature of the study. During dissection, to avoid contamination by cells from the inguinal lymph node, we excised the node with a fairly wide margin, possibly de-enriching beige adipocytes from our samples51.
Mature human adipocyte sample preparation
Purification of mature human adipocytes.
Whole tissue subcutaneous adipose specimens were freshly collected from the operating room. Skin was removed, and adipose tissue was cut into 1- to 2-inch pieces and rinsed thoroughly with 37°C PBS to remove blood. Cleaned adipose tissue pieces were quickly minced in an electric grinder with 3/16-inch hole plate, and 400 ml of sample was placed in a 2-l wide-mouthed Erlenmeyer culture flask with 100 ml of freshly prepared blendzyme (Roche Liberase TM, research grade, cat. no. 05401127001, in PBS, at a ratio of 6.25 mg per 50 ml) and shaken in a 37 °C shaking incubator at 120 r.p.m. for 15–20 min to digest until the sample appeared uniform. Digestion was stopped with 100 ml of freshly made KRB (5.5 mM glucose, 137 mM NaCl, 15 mM HEPES, 5 mM KCl, 1.25 mM CaCl2, 0.44 mM KH2PO4, 0.34 mM Na2HPO4 and 0.8 mM MgSO4), supplemented with 2% BSA. Digested tissue was filtered through a 300 μM sieve and washed with KRB/albumin and flow through until only connective tissue remained. Samples were centrifuged at 233g for 5 min at room temperature, clear lipid was later removed, and floated adipocyte supernatant was collected, divided into aliquots and flash-frozen in liquid nitrogen.
Sample selection and Bulk-RNA-seq library construction
Fasting serum was collected and insulin, glucose, free fatty acids, and a lipid panel were measured by Labcorp. BMI measures were derived from electronic medical records and confirmed by self-reporting, and measures of insulin resistance, the homeostasis model assessment-estimated insulin resistance index (HOMA-IR) and revised quantitative insulin sensitivity check index (QUICKI) were calculated52,53. Female subjects in the first and fourth quartiles for either HOMA-IR or QUICKI and matched for age and BMI were processed for RNA-seq.
Total RNA from ~400 μl of thawed floated adipocytes was isolated in TRIzol reagent (Invitrogen) according to the manufacturer’s instructions. For RNA-seq library construction, mRNA was purified from 100 ng of total RNA by using a Ribo-Zero rRNA removal kit (Epicentre) to deplete ribosomal RNA and convert into double-stranded complementary DNA by using an NEBNext mRNA Second Strand Synthesis Module (E6111L). cDNA was subsequently tagmented and amplified for 12 cycles by using a Nextera XT DNA Library Preparation Kit (Illumina FC-131). Sequencing libraries were analyzed with Qubit and Agilent Bioanalyzer, pooled at a final loading concentration of 1.8 pM and sequenced on a NextSeq500.
Single Cell and Single Nucleus sample preparation and processing
SVF isolation and Drop-seq.
Adipose tissue samples were collected and processed as above. After removal of floated adipocytes, remaining supernatant was aspirated and the remaining pelleted stromal vascular fraction (SVF)was combined from multiple tubes. The combined SVF was washed 2 times with 50ml cold PBS with 233g for 5 min centrifugation between washes. Erythrocytes were depleted with two rounds of 25 ml. ACK lysing buffer (Gibco™ A1049201) exposure (5 minutes at RT followed by 233g x 5 min centrifugation). Remaining SVF pellet was further washed x 2 with 50ml cold PBS prior to counting on hematocytometer and loading onto Drop-seq microfluidic devices. Drop-seq was performed as described54, with the following modifications: first, flow rates of 2.1 mL/h were used for each aqueous suspension and 12 mL/h for the oil. Second, libraries were sequenced on the Illumina NextSeq500, using between 1.6-1.7 pM in a volume of 1.2 mL HT1 and 3 mL of 0.3 μM Read1CustSeqB (GCCTGTCCGCGGAAGCAGTGGTATCAACGCAGAGTAC) using 20 x 8 x 60 read structure.
sNuc-Seq
Nuclei were isolated from frozen mouse and human adipose tissue samples for 10x snRNA-seq using a slightly modified approach to what was previously described55-57. Samples were kept frozen on dry ice until immediately before nuclei isolation, and all sample handling steps were performed on ice. Each flash-frozen adipose tissue sample was placed into a gentleMACS C tube (Miltenyi Biotec) with 2 mL freshly prepared TST buffer (0.03% Tween 20 [Bio-Rad], 0.01% Molecular Grade BSA [New England Biolabs], 146 mM NaCl [ThermoFisher Scientific], 1 mM CaCl2 [VWR International], 21 mM MgCl2 [Sigma Aldrich], and 10 mM Tris-Hcl pH 7.5 [ThermoFisher Scientific] in Ultrapure water [ThermoFisher Scientific]) with or without 0.2 U/μL of Protector RNase Inhibitor (Sigma Aldrich). gentleMACS C tubes were then placed on the gentleMACS Dissociator (Miltenyi Biotec) and tissue was dissociated by running the program “mr_adipose_01” twice, and then incubated on ice for 10 minutes. Lysate was passed through a 40 μm nylon filter (CellTreat) and collected into a 50 mL conical tube (Corning). Filter was rinsed with 3 mL of freshly prepared ST buffer buffer (146 mM NaCl, 1 mM CaCl2, 21 mM MgCl2; 10 mM Tris-Hcl pH 7.5) with or without 0.2 U/μL RNase Inhibitor, and collected into the same tube. Flow-through was centrifuged at 500 x g for 5 minutes at 4°C with brake set to low. Following centrifugation, supernatant was removed, and the nuclear pellet was resuspended in 50 - 200 μl PBS pH 7.4 (ThermoFisher Scientific) with 0.02% BSA, with or without 0.2U/μL RNase Inhibitor. In order to reduce ambient mRNA, the nuclear pellets of some samples were washed 1-3 times with 5 mL of PBS-0.02% BSA before final resuspension. An aliquot of nuclei from each sample was stained with NucBlue (Thermofisher Scientific), counted in a hemocytometer using fluorescence to identify intact nuclei, and then immediately loaded on the 10x Chromium controller (10x Genomics) according to the manufacturer’s protocol.
For each sample, 10,000-16,500 nuclei were loaded in one channel of a Chromium Chip (10x Genomics). The Single Cell 3’ v3.1 chemistry was used to process all samples. cDNA and gene expression libraries were generated according to the manufacturer's instructions (10x Genomics). cDNA and gene expression library fragment sizes were assessed with a DNA High Sensitivity Bioanalyzer Chip (Agilent). cDNA and gene expression libraries were quantified using the Qubit dsDNA High Sensitivity assay kit (ThermoFisher Scientific). Gene expression libraries were multiplexed and sequenced on the Nextseq 500 (Illumina) with a 75-cycle kit and the following read structure: Read 1: 28 cycles, Read 2: 55 cycles, Index Read 1: 8 cycles.
Sequencing, read alignments, and quality control
Single-cell/nucleus RNA-seq data analysis.
Raw sequencing reads were demultiplexed to FASTQ format files using bcl2fastq (Illumina; version 2.20.0). Digital expression matrices were generated from the FASTQ files using the Drop-Seq tools (https://github.com/broadinstitute/Drop-seq, version 2.4.0) pipeline, with appropriate adjustments made to the default program parameters to account for the different read-structures in the scRNA Drop-Seq data and sNuc 10X data. Reads from mouse and human were aligned with STAR58 (version 2.7.3) against the GRCm38 and GRCh38 genome assemblies, respectively. Gene counts were obtained, per-droplet, by summarizing the unique read alignments across exons and introns in appropriate GENCODE annotations (release 16 of the mouse annotation and release 27 of the human annotation). In order to adjust for downstream effects of ambient RNA expression within mouse nuclei (hereafter “cells”), we used CellBender59 (version 0.2.0) to remove counts due to ambient RNA molecules from the count matrices and to estimate the true cells. We also used CellBender to distinguish droplets containing cells from droplets containing only ambient RNA, by selecting droplets with >50% posterior probability of containing a cell. We compared the true cell estimation obtained using CellBender against the same using the DropletUtils software package60, which estimates ambient RNA expression but does not remove any ambient counts, keeping only the cells that were marked as not ambient by both algorithms. To address ambient RNA in the human sNuc data, we calculated spliced and unspliced RNA content in each cell, because nuclei have a high unspliced RNA content, a high percentage of spliced RNA indicates a high ambient RNA content. We therefore removed sNuc-seq cells containing over 75% spliced RNA. All samples were assessed for doublet content using scrublet61 version 0.2.1, and cells called as doublets were removed before further analysis. All cells were further filtered to have greater than 400 UMIs with <10% of UMIs from mitochondrial genes. Genes were filtered such that only genes detected in two or more cells were retained. For the human data, the median number of UMIs detected per cell was 2559 and the median number of genes detected per cell was 1524. For the mouse data, the median number of UMIs detected per cell was 2291 and the median number of genes detected per cell was 1369.
Bulk RNA-seq Analysis.
Raw sequencing reads were demultiplexed by using bcl2fastq (Illumina). Salmon62 (version 1.1.0) was used to simultaneously map and quantify transcript abundances of hg19 genes annotated by release 19 of the GENCODE project’s human reference. Salmon was run using “full” selective alignment (SAF) with mapping validation as described previously63. Gene counts were summarized from transcript abundances using the “tximport” package for R64.
Integration, clustering, subclustering, and annotation
Integration, clustering and subclustering analysis were performed using Seurat 3.9.965. The gene counts were normalized using SCTransform66, and regressed on mitochondrial read percentage, ribosomal read percentage, and cell cycle score as determined by Seurat. In order to avoid smoothing over depot differences, for integration human and mouse data were grouped by ‘individual’, i.e., if both subcutaneous and visceral adipose tissue for an individual human or mouse were available, they were pooled together during this step. Individuals were integrated with reciprocal PCA, using individuals that had both subcutaneous and visceral samples as references. As a result, the human and mouse references were comprised exclusively from the sNuc seq cohort. To integrate, references were integrated together, then the remaining samples—sNuc seq individuals with only subcutaneous data as well as all Drop-seq samples—were mapped to the reference. For clustering, 5000 variable genes were used, and ribosomal and mitochondrial genes were removed from the variable gene set before running PCA and calculating clusters using a Louvain algorithm, 40 PCs, and a resolution of 0.5. Clusters were identified as adipocytes, preadipocytes, mesothelial cells, vascular cells, or immune cells using marker genes, subset into individual objects, and re-integrated using the above method. Samples with fewer than 50 cells in the subset were removed before re-integration. This led to samples having artificially fewer cells in some instances—for example some Drop-seq samples had cells that clustered with adipocytes, but these cells were removed in subclustering because the small numbers of cells introduced too much variability into the integration. Subclustering was performed using a range of variable genes (1000-2000), PCs (10-40) and resolutions (0.2-0.6). Markers were calculated using a non-parametric Wilcoxon rank sum test with p values adjusted using Bonferroni correction (Supplementary Tables 1, 2), and clusters were evaluated based on the distinctness of called markers to determine the final subclustering conditions. In the subclustered objects, we removed clusters that appeared to represent doublets based on the score assigned by scrublet61, or that appeared to be driven by high ambient RNA content as determined by percentage of mitochondrial genes and spliced/unspliced RNA ratio. The remaining clusters were annotated based on marker gene expression. In some cases, smaller subclusters (T and NK cells, B cells, monocytes/neutrophils) were further subset and PCA and clustering analysis but not integration was re-run in order to assign clusters. After subcluster annotation, identities were mapped back onto the original object and cells that were removed from the subclustered objects were similarly removed from the all-cell object.
Deconvolution of bulk RNA-seq data
Bulk RNA sequencing data for subcutaneous adipose tissue from the METSIM cohort were obtained as described previously13. Only individuals with available metabolic phenotyping data were used for the deconvolution analysis. Bulk RNA sequencing data for floated human adipocytes were obtained described above. Deconvolution analysis was performed using MuSiC12 (version 0.1.1) with human sNuc subcutaneous all cell or adipocyte data as reference. Marker genes used for deconvolution can be found in Supplementary Table 1.
Comparison between mouse and human datasets
Mapping of mouse cells onto human clusters was performed using Seurat multimodal reference mapping67. To run, for the all-cell and each subset, the mouse data was prepared by extracting the counts matrix from the mouse sNuc object and mapping the mouse gene names to their human orthologs using a database of ortholog mappings from Mouse Genome Informatics (http://www.informatics.jax.org/homology.shtml). In the case of multi-mapping, the first ortholog pair was used. The mouse object was then split by sample and mapped onto the sNuc-seq data from the matching human all-cell or subset object using the RNA assay and PCA reduction.
Integration of ASPCs from this and other studies
Data was obtained from Burl et. al.4 (SRP145475), Hepler et. al.6 (GSE111588), Merrick et. al.5 (GSE128889), Sárvári et. al.9 (GSE160729), and Schwalie et. al.3 (E-MTAB-6677); processed data, metadata, and/or cell type designations were obtained from the authors when necessary. Datasets were subset to contain only ASPCs, grouped by individual animal/experiment when possible or by lab when not, and integrated with the data from this paper (grouped by animal) using RPCA integration without references with 1500 variable genes. The UMAP reduction was calculated using the top 20 PCs and ASPCs were grouped by cell type annotations from their original papers for analysis.
Immunohistochemistry
Subcutaneous (abdominal) and omental adipose tissue biopsies belonging to lean and obese women (GRIA4: subcutaneous, 5 lean and 5 obese individuals; PGAP1: subcutaneous, 5 lean, 4 obese, visceral 3 lean, 4 obese; EBF2: omental, 3 lean and 4 obese individuals; AGMO: subcutaneous, 4 lean and 4 obese individuals, for all experiments two slides per individual for GRIA4, EBF2, AGMO, one slide per individual for PGAP1) were fixed (overnight in 4% paraformaldehyde at 4°C, dehydrated, paraffin embedded and sectioned (4μm thick). The following primary antibodies and respective dilution were used: GRIA4, 1:200, Cat #23350-1-AP, Proteintech; PGAP1, 1:400, Cat. #55392-1-AP, Proteintech EBF2, 1:1000, Cat. #AF7006, R&D systems; AGMO (TMEM195) 1:100, Cat #orb395684, Biorbyt. In brief, after rinsing in PBS, tissue slices were blocked with 3% normal goat serum and incubated with the primary antibody in PBS, overnight at 4°C. After a thorough rinse in PBS, sections were incubated in 1:200 v/v biotinylated secondary antibody solution for 30 minutes (Invitrogen), rinsed in PBS and incubated in avidin-biotin-peroxidase complex (ABC Standard, Vector Laboratories), washed several times in PBS and lastly incubated in 3,3′-diaminobenzidine tetrahydrochloride (0.05% in 0.05 M Tris with 0.03% H2O2; 5 min). After immunohistochemical staining, sections were counterstained with hematoxylin, dehydrated in ethanol, cleared in xylene and covered with coverslip using Eukitt (Merck). All observations were performed using Nikon Eclipse E800 light microscope.
Immunofluorescence microscopy of mature human adipocytes
Adipocyte immunofluorescence protocol was adapted from Sárvári et al9. Abdominal subcutaneous adipose tissue was collected from two adult female human subjects (BMI 24.9 and 40.3) as above and placed on ice. Tissue was minced and digested with 1 mg/mL type II collagenase (Sigma-Aldrich, C6885) in Hanks’ balanced salt solution supplemented with 0.5% fatty acid-free BSA (Sigma-Aldrich, A6003) at 37° in a water bath with constant shaking at 250 rpm. The cell suspension was filtered through a 250 μM nylon mesh strainer (Thermo, 87791) and washed three times with Krebs-Ringer bicarbonate buffer containing 1% fatty acid-free BSA. All washes throughout this protocol were performed without centrifugation to minimize adipocyte damage and loss; cell suspension was maintained upright for at least 5 minutes to allow mature adipocytes to float, and infranatant was removed with a needle and syringe. The floating adipocytes were fixed with 2% PFA and 1% sucrose in PBS for 30 minutes with constant rotation followed by three washes with 2% fatty acid-free BSA in PBS. Adipocytes were subsequently permeabilized with 0.5% Triton-X (Thermo, 28314) in PBS for five minutes, and incubated with 2.5 μg/mL trypsin (Corning, 25053CI) in PBS for 10 minutes at 37° in a water bath with constant shaking. Adipocytes were then blocked with 2% fatty acid-free BSA in PBS for 30 minutes, and incubated overnight at room temperature with rabbit polyclonal anti-GRIA4 (Proteintech, 23350-1-AP) diluted 1:100 in 500 μL 2% fatty acid-free BSA in PBS with constant rotation. The adipocytes were then washed twice for 10 minutes each with 0.1% fatty acid-free BSA and 0.05% Tween-20 (Sigma-Aldrich, P9416) in PBS, followed by incubation with goat anti-rabbit Alexa Fluor 546 (Thermo, A-11035) secondary antibody diluted 1:500 in 2% fatty acid-free BSA for 2 hours with rotation. For the final 30 minutes of incubation, Hoechst 33342 (Thermo, 62249) and BODIPY 493/503 (Invitrogen, D3922) were added at 1:500 dilutions. Adipocytes were washed twice and resuspended in 300 μL Fluoromount G (Southern Biotech, 0100-01) and mounted on glass slides with 1.4-1.6 mm concavity wells (Electron Microscopy Sciences, 71878-03). A sample of adipocytes was also incubated as above but without primary antibody to verify the specificity of the secondary antibody. Fluorescence images were acquired using Zeiss LSM 880 Upright Laser Scanning Confocal Microscope with filter cubes for DAPI, GFP, and Rhodamine in parallel using the 20X objective and processed using Zen Black 2.3 software. Images were analyzed and counted with ImageJ v. 1.53k.
Ex vivo differentiation and transcriptional and high-content image-based characterization of differentiating primary human adipocyte progenitors
We obtained adipocyte progenitors from subcutaneous and visceral adipose tissue from patients undergoing a range of abdominal laparoscopic surgeries (sleeve gastrectomy, fundoplication or appendectomy). The visceral adipose tissue is derived from the proximity of the angle of His and subcutaneous adipose tissue obtained from beneath the skin at the site of surgical incision. Additionally, human liposuction material was obtained. Each participant gave written informed consent before inclusion and the study protocol was approved by the ethics committee of the Technical University of Munich (Study № 5716/13). Isolation of AMSCs was performed as previously described28, and cells were differentiated in culture over 14 days. Ex vivo differentiated adipocytes were stained and imaged, and features were extracted using LipocyteProfiler as described in Laber et al. RNA-sequencing libraries were prepared and sequenced and QC’ed as previously described28. Bulk-RNA sequencing counts from subcutaneous and visceral samples differentiated for 14 days were deconvoluted using both subcutaneous and visceral adipocytes as reference as described above. Raw images collected during LipocyteProfiler analysis were randomly selected from samples predicted to have high or low content of hAd3, hAd5, or hAd6 adipocytes, and pseudocolored and combined using Adobe Photoshop.
Gene Pathway Analysis
Analysis of enriched pathways in adipocyte markers was performed using clusterProfiler68 (version 3.16.1). Adipocyte cluster markers were filtered to a Benjamini-Hochberg adjusted p-value < .05, then evaluated for enrichment in GO biological pathways or KEGG pathways containing under 300 genes. All pathways and p values can be found in Supplementary Table 3.
Identification and analysis of EBF2 SNP association with visceral adiposity
VAT, ASAT, and GFAT volumes in 40,032 individuals from the UK Biobank69,70 who underwent MRI imaging were quantified as described elsewhere71. Variant rs4872393 was identified as a lead SNP associated with VATadjBMI and waist-to-hip ratio from summary statistics of two prior studies31,72. Among the cohort who underwent MRI imaging, all variants at this locus (± 250 kb around rs4872393) with MAF >= 0.005 and imputation quality (INFO) score >= 0.3 were analyzed. For all 554 nominally significant (P < 0.05) variants associated with VATadjBMI in this region, a secondary conditional analysis testing for association with VATadjBMI was performed controlling for rs4872393 carrier status (P < 0.05/554 = 9 x 10⁻⁵). Participants were excluded from analysis if they met any of the following criteria: (1) mismatch between self-reported sex and sex chromosome count, (2) sex chromosome aneuploidy, (3) genotyping call rate < 0.95, or (4) were outliers for heterozygosity. Up to 37,641 participants were available for analysis. Fat depot volumes adjusted for BMI and height (“adj” traits) were calculated by taking the residuals of the fat depot in sex-specific linear regressions against age at the time of MRI, age squared, BMI, and height31. Each trait was scaled to mean 0 and variance 1 in sex-specific groups before being combined for analysis. Linear regressions between a given trait-variant pair were adjusted for age at the time of imaging, age squared, sex, the first 10 principal components of genetic ancestry, genotyping array, and MRI imaging center. Analyses were performed using R 3.6.0 (R Project for Statistical Computing). EBF2 regional visualization plot was made with the LocusZoom online tool73.
Calculation of pseudobulk datasets to estimate adipose innervation
Approximate bulk RNA-seq datasets (pseudobulk) were obtained for visceral sNuc-seq samples by summing the total expression per-gene across all droplets containing a valid 10X cell barcode. This includes all cells that would normally have been removed in the single-nuclei studies by any of the filtering criteria (above): doublet score, splicing content, droplets with fewer than 400 UMIs, etc, in order to preserve the ambient RNA present in otherwise empty droplets. Repeated UMIs were still collapsed into single counts (per-droplet) before summing. Amounts of pan-neuronal markers were calculated using this pesudobulk dataset and plotted against the proportion of visceral populations hAd2 and hAd6 relative to total adipocytes in each sample.
Prediction of cell-cell interactions
Analysis of cell-cell interactions was performed using CellphoneDB40 (version 2.0.0). For human data, sNuc-seq counts data was split into files containing cells from subcutaneous and visceral fat from individuals with BMI lower than 30 or higher than 40. CellphoneDB with statistical analysis was run on each file separately to evaluate interactions in each condition. For mouse data, counts data was split into files containing cells from the inguinal and perigonadal fat of chow and high fat diet fed mice. Mouse gene names were converted to human gene names, as above, before running CellphoneDB with statistical analysis on each file.
Identification of candidate etiologic cell types using CELLEX and CELLECT
CELLECT (https://github.com/perslab/CELLECT) and CELLEX (https://github.com/perslab/CELLEX) were used to identify candidate etiological cell types for a total of 23 traits. The input data for CELLECT is GWAS summary statistics for a given trait and cell type expression specificity (ES) estimates derived from single-cell RNA-seq data. The output is a list of prioritized candidate etiologic cell types for a given trait. ES estimates were calculated using CELLEX (version 1.1), which computes robust estimates of ES by relying on multiple expression specificity measures (for further details see Timshel et. al.74). CELLEX was run separately on the raw mouse and human (sNuc) gene expression matricies to compute gene expression specificities for each cluster based on the clustering assignment reported above. The resulting cell type specificity matrix was used along with multiple GWAS studies30,75-79 (Extended Data Table 3) as input for CELLECT74 (version 1.1), which was run with default parameters. Significant cell types were identified using a by-trait and by-species Bonferroni p-value threshold of p<0.05.
SNP analysis for bulk mRNA-seq cohort
The raw GTC SNP expression data from Infinium OmniExpress-24 Kit was converted to VCF format using Picard version 2.21.6. The pre-processing of the SNP data before phasing and imputation was performed using plink2 (https://www.cog-genomics.org/plink/2.0/). The SNP genotype was then phased and imputed using the Eagle v2.3.580 and Minimac381 packages, respectively. SNPs were mapped to the NCBI database using the rsnps package (https://CRAN.R-project.org/package=rsnps) and filtered to keep only SNPs that had a minor allele frequency > 0.05. For plotting gene expression against genotype, bulk RNA sequencing data was TMM normalized using edgeR82. Statistical validation for significance was done using the Wilcoxon rank-sum Test which is a non-parametric test assuming independent samples.
Statistics
p-values for scatterplots were calculated using GraphPad Prism version 8.0 and represent the results of an extra sum-of-squares F-test with the null hypothesis that the slope equals zero. All error bars on bar graphs represent standard error. Statistics on proportional composition graphs were calculated using scCODA83 (version 0.1.2) using the Hamiltonian Monte Carlo sampling method. The model formula used was “Depot + BMI” (human) or “Depot + Diet) (mouse) for all objects in for which both of these covariates were present, or the individual covariate when only a single condition was present.
Extended Data
Extended Data Fig. 1. Additional analysis of the effects of depot and BMI on human WAT populations.
a, UMAP projections of cells from the lowest and highest BMI ranges in the dataset, split by depot. To facilitate comparison, samples were randomly subset to contain the same number of cells in each plot (n = 20,339). b, Graph showing the proportion of sNuc-seq cells in each cluster per sample, split by depot and BMI, n = 4 SAT < 30, 6 SAT > 40, 3 VAT < 30, 5 VAT > 40. C, Estimated cell type proportions in bulk RNA sequencing data of subcutaneous adipose tissue from 331 individuals from the METSIM cohort calculated using sNuc-seq data as reference. Vascular cells include endothelial, lymphatic endothelial, pericytes, and smooth muscle cells. Myeloid immune includes macrophages, monocytes, dendritic cells, mast cells and neutrophils, and lymphoid immune includes B cells, NK cells, and T cells. For lines of best fit: Adipocytes R2 = 0.031, ASPCs R2 = 0.034, Vascular R2 = 0.076, Myeloid Immune R2 = 0.13, Lymphoid Immune R2 = 0.0049. For scatterplots, error bands represent a confidence level of 0.95 and p values were calculated using an F-test with the null hypothesis that the slope = 0. For bar graphs, error bars represent SEM, * indicates credible depot effect and # indicates credible BMI effect, calculated using dendritic cells as reference.
Extended Data Fig. 2. Additional analysis of the effects of depot and diet on mouse WAT populations and association with human WAT populations.
a, UMAP projection of all mouse WAT cells split by depot. b, Proportion of cells in each cluster per sample, split by sex as well as by depot and diet, for male mice n = 4 ING Chow, 4 ING HFD, 3 EPI Chow, and 5 EPI HFD. For female mice, n = 2 per condition. c, Riverplot showing the relationship between mouse and human clusters. Mouse cells were mapped onto human sNuc-seq cells using multimodal reference mapping. The riverplot represents the relationship between manually assigned mouse cluster and mapped human cluster for every mouse cell. For bar graphs, error bars represent SEM, * indicates credible depot effect and # indicates credible diet effect, calculated using dendritic cells as reference.
Extended Data Fig. 3. Highly similar vascular cells in human and mouse WAT.
a, UMAP projection of 22,734 human vascular cells. b, Marker genes for 11 distinct clusters of human WAT vascular cells. c, UMAP projection of 7,632 mouse vascular cells. d, Marker genes for 9 distinct clusters of mouse WAT vascular cells. e, Riverplot showing the correlation between annotated mouse and human vascular clusters based on multimodal reference mapping for each mouse cell. f-g, Bar graphs showing the proportion of cells in each cluster per sample split by depot and BMI for human (f) and depot, diet, and sex for mouse (g). For humans, n = 9 SAT < 30, 6 SAT > 40, 3 VAT < 30, and 5 VAT > 40. For male mice n = 4 ING Chow, 4 ING HFD, 3 EPI Chow, and 5 EPI HFD. For female mice, n = 2 per condition. For bar graphs, error bars represent SEM, * indicates credible depot effect and # indicates credible BMI/diet effect, calculated using hEndoA2 (human) and mEndoA2 (mouse) as reference.
Extended Data Fig. 4. Comparison of immune cells in human and mouse WAT.
a, UMAP projection of 34,268 immune cells from human WAT. b, Marker genes for human immune cell clusters. c, UMAP projection of 70,547 immune cells from mouse WAT. d, Marker genes for mouse immune cell clusters. e-f, Riverplots showing the correlation between annotated mouse cluster and mapped human cluster for mouse (e) dendritic cells, mast cells, neutrophils, B cells, NK cells, and T cells and (f) monocytes and macrophages.
Extended Data Fig. 5. Human and mouse immune cells are differentially regulated by depot and BMI/diet.
a-b, UMAP projections of human (a) and mouse (b) WAT immune cells split by depot. c-d, UMAP projections of human (c) and mouse (d) WAT immune cells split by BMI (c) and diet (d). e-f, Bar graphs showing the proportion of cells in each cluster per sample split by depot and BMI for human (e) and depot, diet, and sex for mouse (f). For humans, n = 10 SAT < 30, 6 SAT > 40, 3 VAT < 30, and 5 VAT > 40. For male mice n = 4 ING Chow, 4 ING HFD, 3 EPI Chow, and 5 EPI HFD. For female mice, n = 2 per condition. For bar graphs, error bars represent SEM, * indicates credible depot effect and # indicates credible BMI/diet effect, calculated using hMono2 (human) and mcDC1 (mouse) as reference.
Extended Data Fig. 6. Subpopulations of human and mouse mesothelial cells.
a, UMAP projection of 30,482 human mesothelial cells. b, Marker genes for distinct human mesothelial populations. c, UMAP projection of 14,947 mouse mesothelial cells. d Marker genes for distinct mouse mesothelial populations. e, Riverplots showing relationship of mouse and human mesothelial clusters. f-g, Proportion of cells in each cluster per sample, split by BMI for human (f) and diet and sex for mouse (g). For humans, n = 3 VAT < 30, and 5 VAT > 40. For male mice n = 3 EPI Chow, and 5 EPI HFD. For female mice, n = 2 per condition. Error bars represent SEM, # indicates credible BMI/diet effect, calculated using hMes3 (human) and mMes1 (mouse) as reference.
Extended Data Fig. 7. Human and mouse ASPCs share commonalities with previously reported subtypes.
a, UMAP projection of 52,482 human ASPCs. b, Marker genes for distinct ASPC subpopulations. c, UMAP projection of 51,227 mouse ASPCs. d, Marker genes for distinct ASPC subpopulations. e, Riverplot depicting the relationship between mouse and human ASPC clusters. f, Integration of ASPCs from this paper with ASPCs from other groups.
Extended Data Fig. 8. Human ASPCs exhibit strong depot dependency while mouse ASPCs are dependent on both depot and diet.
a-b, UMAP projections of human (a) and mouse (b) ASPCs split by depot. c-d, UMAP projections of human (c) and mouse (d) ASPCs split by BMI/diet. e-f, Proportion of ASPC cells in each cluster per sample split by depot and BMI for human (e) and depot, diet, and sex for mouse (f). For humans, n = 11 SAT < 30, 6 SAT > 40, 3 VAT < 30, and 5 VAT > 40. For male mice n = 4 ING Chow, 4 ING HFD, 3 EPI Chow, and 5 EPI HFD. For female mice, n = 2 per condition. For bar graphs, error bars represent SEM, * indicates credible depot effect and # indicates credible BMI/diet effect, calculated using hASPC2 (human) and mASPC4 (mouse) as reference.
Extended Data Fig. 9. Human adipocyte subtypes are highly dependent on depot and may be responsible for distinct functions.
a-b, UMAP projections of human white adipocytes split by depot (a) and BMI (b). c, Proportion of cells in each human cluster by sample split by depot and BMI, n = 4 SAT < 30, 6 SAT > 40, 3 VAT < 30, and 5 VAT > 40. D, Quantification of immunofluorescence analysis of GRIA4+ cells in mature human adipocytes from two individuals. Each dot represents an image, n = 12 images from individual 1 and 9 images from individual 2 with a total of 704 counted cells. Only cells with visible nuclei were included in the quantification. e, Representative image of GRIA4+ cells, white arrows represent positive cells, grey represent negative, scale bar = 100 μm. In total, there were 21 images from samples taken from two individuals. f, Expression of genes associated with adipokine secretion, insulin signaling, lipid handling, and thermogenesis across human adipocyte subclusters. g-m, Expression of genes associated with GO or KEGG pathways indicative of individual human adipocyte subclusters. For bar graph, error bars represent SEM, * indicates credible depot effect and # indicates credible BMI effect, calculated using hAd5 as reference.
Extended Data Fig. 10. Human adipocytes differentiated ex vivo recapitulate many of the adipocyte subclusters found in vivo.
a, Plot of estimated cell type proportion in ex vivo adipocyte cultures differentiated from subcutaneous or visceral preadipocytes for 14 days, ordered by estimated proportion. b-c, Scatterplots showing the relationship between estimated cell type proportion and the LipocyteProfiler-calculated features Large BODIPY objects (b) and Median BODIPY Intensity (c). p values were calculated using an F-test with the null hypothesis that the slope = 0. d, Representative images of hAd3 low/hAd5 or hAd3 high hAd5 low ex vivo differentiated cultures. Green represents BODIPY staining, blue represents Hoechst staining. Scale bars are 100 μm, in total, 3 randomly selected images/sample were analyzed from 3 SAT samples and 3 VAT samples with the lowest and highest predicted proportions of hAd3 and hAd5.
Extended Data Fig. 11. Visceral-specific adipocyte subpopulation hAd6 is associated with thermogenic traits.
a, Regional visualization of associations of common genetic variants near EBF2 with VATadj. b, Effect size of association of rs4872393 with VATadj, ASATadj, GFATadj, and BMI per minor allele A; n = 37,641. Error bars reflect a 95% confidence interval around the effect size estimate from regression. c, VATadj raw data plotted according to rs4872393 carrier status; n = 36,185. For box plots, horizontal line = median, lower and upper bounds of the box = 1st and 3rd quartile respectively, lower and upper whisker = 1st quartile – 1.5 x interquartile range (IQR) and 3rd quartile + 1.5 x IQR respectively, outliers are plotted as points. d, Scatterplot showing the relationship between estimated cell type proportion and the LipocyteProfiler calculated feature Mitochondrial Intensity in visceral samples. e, Expression of mitochondrial and thermogenic genes in visceral ex vivo differentiated adipocytes stratified by estimated hAd6 proportion and matched for amount of differentiation using PPARG expression, n = 7 mAd6 low and 5 mAd6 high. Error bars represent SEM, p values were calculated using two tailed t-tests with no adjustments for multiple comparison, *, p < .05, **, p < .01. Exact p values: EBF2 = 0.027, TFAM = 0.019, CKMT1A = 0.049, CKMT1B = 0.005. f, Representative images of hAd6 low and high visceral in vitro differentiated cultures. Green represents BODIPY staining, red represents MitoTracker staining, and blue represents Hoechst staining. Scale bars are 100 μm, in total 3 random images/sample were analyzed from 5 hAd6 low and 5 hAd6 high samples. g, Violin plot of sNuc-seq data showing axon guidance genes in adipocyte subclusters. h, Scatterplots showing the relationship between calculated proportion of visceral subpopulations hAd2 and hAd6 and expression of pan-neuronal markers on the ambient RNA of individual visceral sNuc-seq samples. For scatterplots, p values were calculated using an F-test with the null hypothesis that the slope = 0.
Extended Data Fig. 12. Mouse adipocytes appear to have distinct functionality but are not analogous to human adipocyte subpopulations.
a-b, UMAP projections of mouse adipocytes split by depot (a) and diet (b). c, Proportion of cells in each mouse cluster per sample split by depot, diet, and sex. For male mice n = 4 ING Chow, 4 ING HFD, 3 EPI Chow, and 5 EPI HFD. For female mice, n = 2 per condition. d, Expression of genes associated with known adipocyte functions in mouse adipocyte subclusters. e-k, Expression of genes associated with GO or KEGG pathways indicative of individual mouse adipocyte subclusters. l-n, Riverplots of mouse cells showing the association between mouse and human adipocyte clusters from both subcutaneous and visceral depots (l), subcutaneous (ING and SAT) adipocytes only (m) or visceral (PG and VAT) adipocytes only (n). For depot comparisons, both mouse query objects and human reference objects were subset to the respective depot before mapping. For bar graph, error bars represent SEM, * indicates credible depot effect and # indicates credible diet effect, calculated using mAd6 as reference.
Extended Data Fig. 13. CellphoneDB identifies increasing numbers of cell-cell interactions within WAT during obesity.
a, Heatmap showing number of significant interactions identified between cell types in SAT of low (<30) and high (>40) BMI individuals as determined by CellphoneDB. b, Expression of ligand and receptor genes from Figure 4b in human adipocyte subclusters. c, Heatmaps showing number of significant interactions identified between cell types in ING and PG WAT of chow and HFD fed mice. d, Venn diagrams showing the overlap of significant interactions between adipocytes and endothelial cells, ASPCs, and macrophages between depot, BMI/diet, and species. e, Jitter plots of the relationship between number of WAT cell types expressing a ligand (y axis) vs. the number of cell types expressing the receptor (x axis) for all significant interactions in high BMI human VAT (left) and mouse HFD PG (right).
Extended Data Fig. 14. Association with GWAS data provides further insight into the contribution of white adipocytes to human traits.
a-c, Expression of PPARG in human adipocyte subclusters (a), and in METSIM SAT bulk RNA-seq plotted against WHR (b) or HOMA-IR (c). d, Expression of PPARG in isolated subcutaneous adipocyte bulk RNA-seq plotted against HOMA-IR. e-h, SNPs in the PPARG gene identified by DEPICT as associated with BMI-adjusted WHR plotted against PPARG gene expression (e, g) and HOMA-IR (f, h) in isolated subcutaneous adipocyte bulk RNA-seq data and cohort. For rs17819328 n = 7 for T/T, 30 for T/G, and 6 for G/G. For rs1797912 n = 7 for A/A, 31 for A/C, and 5 for C/C. For box plots, horizontal line = median, lower and upper bounds of the box = 1st and 3rd quartile respectively, lower and upper whisker = 1st quartile – 1.5 x interquartile range (IQR) and 3rd quartile + 1.5 x IQR respectively. p values were calculated using a Wilcoxin test. i-j, Expression of genes in human adipocyte subtypes from sNuc-seq data (i) and from isolated subcutaneous adipocyte bulk RNA-seq plotted against LDL (j). k, p values of the association between mouse cell types and GWAS studies. l-m, p values of the association between mouse adipocyte (l) or ASPC (m) subclusters with GWAS studies. For all graphs, the grey line represents p = 0.05 and the orange line represents significant p value after Bonferroni adjustment (p = 0.003 for all cell, p = 0.001 for subclusters), calculated based on number of cell types queried. For scatterplots, p values were calculated using an F-test with the null hypothesis that the slope = 0.
Extended Data Table 1. Subject information for Drop-Seq, sNuc-seq, and bulk RNA-seq of isolated subcutaneous human adipocytes.
BMI, age, sex, race/ethnicity, depot, fat location, and surgery information for all Drop-Seq and sNuc-seq subjects as well as information for insulin sensitive and insulin resistant bulk RNA-seq adipocyte cohort. p values were calculated using two tailed t-tests with no adjustment for multiple comparisons.
| Subjects for Drop-Seq | |||||||
|---|---|---|---|---|---|---|---|
| Subject | BMI | Age | Sex | Race/Ethnicity | SAT | Surgery | Institution |
| Hs235 | 36.04 | 53 | F | Caucasian | Pannus | Panniculectomy | BIDMC |
| Hs236 | 25.74 | 35 | F | Caucasian | Thigh | Thighplasty | BIDMC |
| Hs237 | 22.59 | 53 | F | Caucasian | Pannus | DIEP | BIDMC |
| Hs238 | 19.57 | 49 | F | Caucasian | Pannus | Abdominoplasty | BIDMC |
| Hs239 | 24.8 | 71 | F | Caucasian | Pannus | DIEP | BIDMC |
| Hs240 | 25.82 | 59 | F | Caucasian | Pannus | Panniculectomy | BIDMC |
| Hs242 | 22.88 | 59 | F | Caucasian | Pannus | DIEP | BIDMC |
| Hs248 | 32.28 | 68 | F | Caucasian | Pannus | Panniculectomy | BIDMC |
| Hs249 | 26.46 | 54 | F | Caucasian | Pannus | DIEP | BIDMC |
| DIEP: Deep inferior epigastric perforators | |||||||
| Subjects for sNuc-seq | ||||||||
|---|---|---|---|---|---|---|---|---|
| Subject | BMI | Age | Sex | Race/ Ethnicity |
SAT | VAT | Surgery | Institution |
| Hs001 | 49.3 | 29 | F | Caucasian | Periumbilical | Omental | VSG | UPitt |
| Hs002 | 33.1 | 57 | F | Caucasian | Periumbilical | NA | Hernia | UPitt |
| Hs004 | 25.4 | 51 | F | Caucasian | Periumbilical | NA | CCY | UPitt |
| Hs009 | 45.7 | 41 | F | Black | Periumbilical | Omental | VSG | UPitt |
| Hs010 | 43.1 | 35 | F | Caucasian | Periumbilical | Omental | RYGB | UPitt |
| Hs011 | 42.8 | 58 | F | Black | Periumbilical | NA | VSG | UPitt |
| Hs012 | 48.7 | 36 | M | Caucasian | Periumbilical | Omental | VSG | UPitt |
| Hs013 | 43.2 | 24 | M | Caucasian | Periumbilical | Omental | VSG | UPitt |
| Hs253 | 30.04 | 53 | F | Caucasian | Periumbilical | Preperitoneal | TAH BSO | BIDMC |
| Hs254 | 23.96 | 41 | F | Caucasian/Hispanic | Periumbilical | Preperitoneal | TAH BSO | BIDMC |
| Hs255 | 24.27 | 73 | F | Caucasian | Periumbilical | Preperitoneal | TAH BSO | BIDMC |
| Hs256 | 34.53 | 41 | F | Black | Periumbilical | Omental | CCY | BIDMC |
| Hs266 | 22.15 | 68 | M | Caucasian | Periumbilical | Omental | Colon polyp | BIDMC |
| Bulk RNA-seq of floated adipocytes | |||
|---|---|---|---|
| Insulin Sensitive average(min-max) |
Insulin Resistant average(min-max) |
p Value | |
| N | 16 | 27 | |
| AGE | 47.3 (36-63) | 50.6 (33-71) | 0.289 |
| BMI | 27.2 (21-33) | 30.1 (21-42) | 0.042 |
| HOMA-IR | 0.70 (0.46-0.88) | 5.8 (2.1-24.5) | 0.00012 |
| HDL | 70.5 (42-154) | 54.1 (26-100) | 0.022 |
| LDL | 93.2 (54-133) | 97.9 (51-169) | 0.651 |
Abbreviations: VSG: Vertical sleeve gastrectomy; CCY: Cholecystectomy; RYGB: Roux en Y gastric bypass; TAH BSO: Total abdominal hysterectomy and bilateral salpingo-oophorectomy
Extended Data Table 2. Numbers of cells in human and mouse single cell experiments broken down by cluster, depot, BMI/diet, and technology.
Cell counts per cluster for human and mouse data broken down by technology, depot, and BMI/diet.
| Human Cell Numbers | |||||||||||
|---|---|---|---|---|---|---|---|---|---|---|---|
| VAT | SAT | VAT total |
SAT total |
Total | |||||||
| sNuc | sNuc | Drop | |||||||||
| BMI | < 30 | 30-40 | > 40 | < 30 | 30-40 | > 40 | < 30 | > 30 | |||
| Adipocyte | 5211 | 1011 | 5253 | 7611 | 2847 | 3938 | 0 | 0 | 11475 | 14396 | 25871 |
| ASPCs | 5938 | 1404 | 7304 | 6848 | 2703 | 7329 | 15195 | 5761 | 14646 | 37836 | 52482 |
| Mesothelium | 7773 | 1927 | 20782 | 0 | 0 | 0 | 0 | 0 | 30482 | 0 | 30482 |
| Endothelial | 2351 | 1030 | 2345 | 4231 | 2783 | 2059 | 577 | 107 | 5726 | 9757 | 15483 |
| Lymphatic Endo | 677 | 240 | 1138 | 195 | 130 | 305 | 168 | 48 | 2055 | 846 | 2901 |
| Pericyte | 381 | 109 | 254 | 353 | 132 | 172 | 60 | 3 | 744 | 720 | 1464 |
| Smooth Muscle | 448 | 360 | 423 | 709 | 621 | 237 | 83 | 5 | 1231 | 1655 | 2886 |
| Macrophage | 1908 | 630 | 6328 | 3121 | 1795 | 2871 | 1256 | 403 | 8866 | 9446 | 18312 |
| Monocyte | 98 | 41 | 173 | 187 | 155 | 549 | 359 | 387 | 312 | 1637 | 1949 |
| Dendritic Cell | 125 | 30 | 340 | 169 | 119 | 188 | 756 | 714 | 495 | 1946 | 2441 |
| Mast Cell | 111 | 27 | 139 | 210 | 294 | 298 | 66 | 23 | 277 | 891 | 1168 |
| Neutrophil | 7 | 9 | 4 | 98 | 12 | 14 | 0 | 2 | 20 | 126 | 146 |
| B Cell | 28 | 12 | 39 | 57 | 49 | 188 | 30 | 26 | 79 | 350 | 429 |
| NK Cell | 229 | 92 | 242 | 375 | 279 | 669 | 297 | 446 | 563 | 2066 | 2629 |
| T Cell | 762 | 382 | 1661 | 667 | 510 | 1522 | 977 | 713 | 2805 | 4389 | 7194 |
| Endometrium | 45 | 150 | 114 | 0 | 0 | 0 | 2 | 1 | 309 | 3 | 312 |
| Total | 26092 | 7454 | 46539 | 24831 | 12429 | 20339 | 19826 | 8639 | 80085 | 86064 | 166149 |
| Mouse Cell Numbers | |||||||
|---|---|---|---|---|---|---|---|
| PG | Ing | ||||||
| Chow | HFD | Chow | HFD | PG Total | Ing Total | Total | |
| Adipocyte | 12874 | 5139 | 8645 | 13276 | 18013 | 21921 | 39934 |
| ASPCs | 9928 | 10194 | 16308 | 14797 | 20122 | 31105 | 51227 |
| Mesothelium | 10074 | 4873 | 0 | 0 | 14947 | 0 | 14947 |
| Endothelial | 1521 | 673 | 1141 | 2261 | 2194 | 3402 | 5596 |
| Lymphatic Endo | 678 | 101 | 224 | 173 | 779 | 397 | 1176 |
| Pericyte | 62 | 170 | 56 | 309 | 232 | 365 | 597 |
| Smooth Muscle | 56 | 52 | 30 | 125 | 108 | 155 | 263 |
| Macrophage | 3788 | 35673 | 9370 | 9017 | 39461 | 18387 | 57848 |
| Monocyte | 975 | 2801 | 1286 | 2545 | 3776 | 3831 | 7607 |
| Dendritic Cell | 268 | 688 | 237 | 379 | 956 | 616 | 1572 |
| Mast Cell | 4 | 267 | 13 | 27 | 271 | 40 | 311 |
| Neutrophil | 23 | 9 | 8 | 7 | 32 | 15 | 47 |
| B Cell | 301 | 594 | 28 | 279 | 895 | 307 | 1202 |
| NK Cell | 110 | 215 | 67 | 282 | 325 | 349 | 674 |
| T Cell | 266 | 472 | 69 | 479 | 738 | 548 | 1286 |
| Male Epithelial | 3463 | 36 | 19 | 329 | 3499 | 348 | 3847 |
| Female Epithelial | 76 | 45 | 6331 | 3135 | 121 | 9466 | 9587 |
| Total | 44467 | 62002 | 43832 | 47420 | 106469 | 91252 | 197721 |
Extended Data Table 3. GWAS studies used for CELLECT analysis.
List of sources for GWAS datasets used in the CELLECT analysis.
| Trait | Study/collection |
|---|---|
| BMI | Pulit, S. L. et al. Meta-analysis of genome-wide association studies for body fat distribution in 694 649 individuals of European ancestry. |
| HDL | https://alkesgroup.broadinstitute.org/sumstats_formatted/ |
| LDL | https://alkesgroup.broadinstitute.org/sumstats_formatted/ |
| T1D | https://alkesgroup.broadinstitute.org/sumstats_formatted/ |
| T2D (BMI adjusted) | Mahajan, A. et al. Fine-mapping type 2 diabetes loci to single-variant resolution using high-density imputation and islet-specific epigenome maps. |
| Triglycerides | https://alkesgroup.broadinstitute.org/sumstats_formatted/ |
| WHR (BMI adjusted) | Loh, P.-R., Kichaev, G., Gazal, S., Schoech, A. P. & Price, A. L. Mixed-model association for biobank-scale datasets |
Supplementary Material
ACKNOWLEDGEMENTS
This work was supported by NIH grants RC2 DK116691 to EDR, LTT, AC, OA, and AR, AHA POST14540015 and DoD PRMRP-DAW81XWH to LTT, Broad-BADERC Collaboration Initiative Award (NIH 5P30DK057521) to LTT and EDR, and R01 DK102173 to EDR. MPE is supported by NIH grant F32DK124914. Additional support includes PRIN 2017 (Italian Ministry of University, #2017L8Z2EM) to AG, THP acknowledges the Novo Nordisk Foundation (unconditional donation to the Novo Nordisk Foundation Center for Basic Metabolic Research; grant number NNF18CC0034900) and the Lundbeck Foundation (Grant number R190-2014-3904), grants AMP-T2D RFB8b (FNIH) and UM1DK126185 (NIDDK) to MC, Sarnoff Cardiovascular Research Foundation Fellowship to S.A., grants 1K08HG010155 and 1U01HG011719 to A.V.K. from the National Human Genome Research Institute, and a sponsored research agreement from IBM Research to the Broad Institute of MIT and Harvard to A.V.K. All single cell library construction and sequencing was performed through the Boston Nutrition Obesity Research Center Functional Genomics and Bioinformatics Core (NIH P30DK046200). We thank Christina Usher for artistic support and Miriam Udler for helpful discussions.
Footnotes
CODE AVAILABILITY
Data analysis pipelines used in this study for processing of raw sequencing data, integration, and clustering can be obtained from https://gitlab.com/rosen-lab/white-adipose-atlas.
COMPETING INTEREST DECLARATION
S.A. has served as a scientific consultant to Third Rock Ventures. A.V.K. has served as a scientific advisor to Sanofi, Amgen, Maze Therapeutics, Navitor Pharmaceuticals, Sarepta Therapeutics, Novartis, Verve Therapeutics, Silence Therapeutics, Veritas International, Color Health, Third Rock Ventures, and Columbia University (NIH); received speaking fees from Illumina, MedGenome, Amgen, and the Novartis Institute for Biomedical Research; and received a sponsored research agreement from the Novartis Institute for Biomedical Research. M.C. holds equity in Waypoint Bio and is a member of the Nestle Scientific Advisory Board. A.R. is a co-founder and equity holder of Celsius Therapeutics, an equity holder in Immunitas Therapeutics and a scientific advisory board member of Thermo Fisher Scientific, Syros Pharmaceuticals, Asimov and Neogene Therapeutics. A.R. is also an employee of Genentech. All other authors declare no competing interests.
DATA AVAILABILITY
Single cell RNA expression and count data is deposited in the Single Cell Portal (Study #SCP1376). Processed count data for bulk RNA-seq and dge matrices for single cell and single nucleus RNA-seq have been deposited in GEO (Bulk-seq Accession #GSE174475, sc-RNA-seq Accession # GSE176067, sNuc-sec Acession #GSE176171), raw sequencing reads for mouse data are available in SRA, study #SRP322736. FASTQ and SNP array files for human samples are deposited in dbGaP, Accession #phs002766.v1.p1. Publicaly available datasets and databases used were the following: METSIM RNA-seq data from Raulerson et. al.13 (GSE135134); single cell ASPC data from Burl et. al.4 (SRP145475), Hepler et. al.6 (GSE111588), Merrick et. al.5 (GSE128889), Sárvári et. al.9 (GSE160729), and Schwalie et. al.3 (E-MTAB-6677); human assembly GRCh38 and GENCODE annotation 27 (https://www.gencodegenes.org/human/release_27.html); mouse assembly GRCm38 and GENCODE annotation M16 (https://www.gencodegenes.org/mouse/release_M16.html).
REFERENCES
- 1.Rosen ED & Spiegelman BM What We Talk About When We Talk About Fat. Cell 156, 20–44 (2014). [DOI] [PMC free article] [PubMed] [Google Scholar]
- 2.Kahn SE, Hull RL & Utzschneider KM Mechanisms linking obesity to insulin resistance and type 2 diabetes. Nature 444, 840–846 (2006). [DOI] [PubMed] [Google Scholar]
- 3.Schwalie PC et al. A stromal cell population that inhibits adipogenesis in mammalian fat depots. Nature 559, 103–108 (2018). [DOI] [PubMed] [Google Scholar]
- 4.Burl RB et al. Deconstructing Adipogenesis Induced by β3-Adrenergic Receptor Activation with Single-Cell Expression Profiling. Cell Metab. 28, 300–309.e4 (2018). [DOI] [PMC free article] [PubMed] [Google Scholar]
- 5.Merrick D et al. Identification of a mesenchymal progenitor cell hierarchy in adipose tissue. Science 364, (2019). [DOI] [PMC free article] [PubMed] [Google Scholar]
- 6.Hepler C et al. Identification of functionally distinct fibro-inflammatory and adipogenic stromal subpopulations in visceral adipose tissue of adult mice. eLife 7, e39636 (2018). [DOI] [PMC free article] [PubMed] [Google Scholar]
- 7.Vijay J et al. Single-cell analysis of human adipose tissue identifies depot- and disease-specific cell types. Nat. Metab 2, 97–109 (2020). [DOI] [PMC free article] [PubMed] [Google Scholar]
- 8.Rajbhandari P et al. Single cell analysis reveals immune cell–adipocyte crosstalk regulating the transcription of thermogenic adipocytes. eLife 8, e49501 (2019). [DOI] [PMC free article] [PubMed] [Google Scholar]
- 9.Sárvári AK et al. Plasticity of Epididymal Adipose Tissue in Response to Diet-Induced Obesity at Single-Nucleus Resolution. Cell Metab. 33, 437–453.e5 (2021). [DOI] [PubMed] [Google Scholar]
- 10.Sun W et al. snRNA-seq reveals a subpopulation of adipocytes that regulates thermogenesis. Nature 587, 98–102 (2020). [DOI] [PubMed] [Google Scholar]
- 11.Benites-Zapata VA et al. High waist-to-hip ratio levels are associated with insulin resistance markers in normal-weight women. Diabetes Metab. Syndr. Clin. Res. Rev 13, 636–642 (2019). [DOI] [PubMed] [Google Scholar]
- 12.Wang X, Park J, Susztak K, Zhang NR & Li M Bulk tissue cell type deconvolution with multi-subject single-cell expression reference. Nat. Commun 10, 380 (2019). [DOI] [PMC free article] [PubMed] [Google Scholar]
- 13.Raulerson CK et al. Adipose Tissue Gene Expression Associations Reveal Hundreds of Candidate Genes for Cardiometabolic Traits. Am. J. Hum. Genet 105, 773–787 (2019). [DOI] [PMC free article] [PubMed] [Google Scholar]
- 14.Blüher M Transgenic animal models for the study of adipose tissue biology. Best Pract. Res. Clin. Endocrinol. Metab 19, 605–623 (2005). [DOI] [PubMed] [Google Scholar]
- 15.An atlas of cell types in the mouse epididymis and vas deferens ∣ eLife. https://elifesciences.org/articles/55474. [DOI] [PMC free article] [PubMed] [Google Scholar]
- 16.Villani A-C et al. Single-cell RNA-seq reveals new types of human blood dendritic cells, monocytes, and progenitors. Science 356, (2017). [DOI] [PMC free article] [PubMed] [Google Scholar]
- 17.Hildreth AD et al. Single-cell sequencing of human white adipose tissue identifies new cell states in health and obesity. Nat. Immunol 1–15 (2021) doi: 10.1038/s41590-021-00922-4. [DOI] [PMC free article] [PubMed] [Google Scholar]
- 18.Suganami T & Ogawa Y Adipose tissue macrophages: their role in adipose tissue remodeling. J. Leukoc. Biol 88, 33–39 (2010). [DOI] [PubMed] [Google Scholar]
- 19.Weisberg SP et al. Obesity is associated with macrophage accumulation in adipose tissue. J. Clin. Invest 112, 1796–1808 (2003). [DOI] [PMC free article] [PubMed] [Google Scholar]
- 20.Reilly SM & Saltiel AR Adapting to obesity with adipose tissue inflammation. Nat. Rev. Endocrinol 13, 633–643 (2017). [DOI] [PubMed] [Google Scholar]
- 21.Shi M & Shi G-P Different Roles of Mast Cells in Obesity and Diabetes: Lessons from Experimental Animals and Humans. Front. Immunol 3, 7 (2012). [DOI] [PMC free article] [PubMed] [Google Scholar]
- 22.Xu H et al. Chronic inflammation in fat plays a crucial role in the development of obesity-related insulin resistance. J. Clin. Invest 112, 1821–1830 (2003). [DOI] [PMC free article] [PubMed] [Google Scholar]
- 23.Ferrero R, Rainer P & Deplancke B Toward a Consensus View of Mammalian Adipocyte Stem and Progenitor Cell Heterogeneity. Trends Cell Biol. 30, 937 (2020). [DOI] [PubMed] [Google Scholar]
- 24.Wang QA, Tao C, Gupta RK & Scherer PE Tracking adipogenesis during white adipose tissue development, expansion and regeneration. Nat. Med 19, 1338–1344 (2013). [DOI] [PMC free article] [PubMed] [Google Scholar]
- 25.Jeffery E, Church CD, Holtrup B, Colman L & Rodeheffer MS Rapid Depot-Specific Activation of Adipocyte Precursor Cells at the Onset of Obesity. Nat. Cell Biol 17, 376–385 (2015). [DOI] [PMC free article] [PubMed] [Google Scholar]
- 26.Bäckdahl J et al. Spatial mapping reveals human adipocyte subpopulations with distinct sensitivities to insulin. Cell Metab. 33, 1869–1882.e6 (2021). [DOI] [PubMed] [Google Scholar]
- 27.Stefan N et al. Circulating Palmitoleate Strongly and Independently Predicts Insulin Sensitivity in Humans. Diabetes Care 33, 405–407 (2010). [DOI] [PMC free article] [PubMed] [Google Scholar]
- 28.Laber S et al. Discovering cellular programs of intrinsic and extrinsic drivers of metabolic traits using LipocyteProfiler. 2021.07.17.452050 https://www.biorxiv.org/content/10.1101/2021.07.17.452050v1 (2021) doi: 10.1101/2021.07.17.452050. [DOI] [PMC free article] [PubMed] [Google Scholar]
- 29.Rajakumari S et al. EBF2 determines and maintains brown adipocyte identity. Cell Metab. 17, 562–574 (2013). [DOI] [PMC free article] [PubMed] [Google Scholar]
- 30.Pulit SL et al. Meta-analysis of genome-wide association studies for body fat distribution in 694 649 individuals of European ancestry. Hum. Mol. Genet 28, 166–174 (2019). [DOI] [PMC free article] [PubMed] [Google Scholar]
- 31.Agrawal S et al. Inherited basis of visceral, abdominal subcutaneous and gluteofemoral fat depots. 2021.08.24.21262564 https://www.medrxiv.org/content/10.1101/2021.08.24.21262564v1 (2021) doi: 10.1101/2021.08.24.21262564. [DOI] [PMC free article] [PubMed] [Google Scholar]
- 32.Willows JW et al. Visualization and analysis of whole depot adipose tissue neural innervation. iScience 24, 103127 (2021). [DOI] [PMC free article] [PubMed] [Google Scholar]
- 34.Roh HC et al. Adipocytes fail to maintain cellular identity during obesity due to reduced PPARγ activity and elevated TGFβ-SMAD signaling. Mol. Metab 42, 101086 (2020). [DOI] [PMC free article] [PubMed] [Google Scholar]
- 36.Park J et al. Progenitor-like characteristics in a subgroup of UCP1+ cells within white adipose tissue. Dev. Cell 56, 985–999.e4 (2021). [DOI] [PMC free article] [PubMed] [Google Scholar]
- 37.Priest C & Tontonoz P Inter-organ cross-talk in metabolic syndrome. Nat. Metab 1, 1177–1188 (2019). [DOI] [PubMed] [Google Scholar]
- 38.Schling P & Löffler G Cross talk between adipose tissue cells: impact on pathophysiology. News Physiol. Sci. Int. J. Physiol. Prod. Jointly Int. Union Physiol. Sci. Am. Physiol. Soc 17, 99–104 (2002). [DOI] [PubMed] [Google Scholar]
- 39.Kane H & Lynch L Innate Immune Control of Adipose Tissue Homeostasis. Trends Immunol. 40, 857–872 (2019). [DOI] [PubMed] [Google Scholar]
- 40.Efremova M, Vento-Tormo M, Teichmann SA & Vento-Tormo R CellPhoneDB: inferring cell-cell communication from combined expression of multi-subunit ligand-receptor complexes. Nat. Protoc 15, 1484–1506 (2020). [DOI] [PubMed] [Google Scholar]
- 41.Cao Y Angiogenesis and vascular functions in modulation of obesity, adipose metabolism, and insulin sensitivity. Cell Metab. 18, 478–489 (2013). [DOI] [PubMed] [Google Scholar]
- 42.Hubert A et al. Selective Deletion of Leptin Signaling in Endothelial Cells Enhances Neointima Formation and Phenocopies the Vascular Effects of Diet-Induced Obesity in Mice. Arterioscler. Thromb. Vasc. Biol 37, 1683–1697 (2017). [DOI] [PubMed] [Google Scholar]
- 43.Scott RA et al. An Expanded Genome-Wide Association Study of Type 2 Diabetes in Europeans. Diabetes 66, 2888–2902 (2017). [DOI] [PMC free article] [PubMed] [Google Scholar]
- 44.Shungin D et al. New genetic loci link adipose and insulin biology to body fat distribution. Nature 518, 187–196 (2015). [DOI] [PMC free article] [PubMed] [Google Scholar]
- 45.Huang LO et al. Genome-wide discovery of genetic loci that uncouple excess adiposity from its comorbidities. Nat. Metab 3, 228–243 (2021). [DOI] [PubMed] [Google Scholar]
- 46.Timshel PN, Thompson JJ & Pers TH Genetic mapping of etiologic brain cell types for obesity. eLife 9, e55851 (2020). [DOI] [PMC free article] [PubMed] [Google Scholar]
- 47.O’Rahilly S & Farooqi IS Human obesity as a heritable disorder of the central control of energy balance ∣ International Journal of Obesity. https://www.nature.com/articles/ijo2008239. [DOI] [PubMed] [Google Scholar]
- 48.Sailer S, Keller MA, Werner ER & Watschinger K The Emerging Physiological Role of AGMO 10 Years after Its Gene Identification. Life Basel Switz. 11, (2021). [DOI] [PMC free article] [PubMed] [Google Scholar]
- 49.Dupuis J et al. New genetic loci implicated in fasting glucose homeostasis and their impact on type 2 diabetes risk. Nat. Genet 42, 105–116 (2010). [DOI] [PMC free article] [PubMed] [Google Scholar]
- 50.Loh NY et al. RSPO3 impacts body fat distribution and regulates adipose cell biology in vitro. Nat. Commun 11, 2797 (2020). [DOI] [PMC free article] [PubMed] [Google Scholar]
METHODS REFERENCES
- 51.Chi J et al. Three-Dimensional Adipose Tissue Imaging Reveals Regional Variation in Beige Fat Biogenesis and PRDM16-Dependent Sympathetic Neurite Density. Cell Metab. 27, 226–236.e3 (2018). [DOI] [PubMed] [Google Scholar]
- 52.Katz A et al. Quantitative Insulin Sensitivity Check Index: A Simple, Accurate Method for Assessing Insulin Sensitivity In Humans. J. Clin. Endocrinol. Metab 85, 2402–2410 (2000). [DOI] [PubMed] [Google Scholar]
- 53.Matthews DR et al. Homeostasis model assessment: insulin resistance and β-cell function from fasting plasma glucose and insulin concentrations in man. Diabetologia 28, 412–419 (1985). [DOI] [PubMed] [Google Scholar]
- 54.Macosko EZ et al. Highly Parallel Genome-wide Expression Profiling of Individual Cells Using Nanoliter Droplets. Cell 161, 1202–1214 (2015). [DOI] [PMC free article] [PubMed] [Google Scholar]
- 55.Drokhlyansky E et al. The Human and Mouse Enteric Nervous System at Single-Cell Resolution. Cell 182, 1606–1622.e23 (2020). [DOI] [PMC free article] [PubMed] [Google Scholar]
- 56.Slyper M et al. A single-cell and single-nucleus RNA-Seq toolbox for fresh and frozen human tumors. Nat. Med 26, 792–802 (2020). [DOI] [PMC free article] [PubMed] [Google Scholar]
- 57.Delorey TM et al. A single-cell and spatial atlas of autopsy tissues reveals pathology and cellular targets of SARS-CoV-2. bioRxiv (2021) doi: 10.1101/2021.02.25.430130. [DOI] [Google Scholar]
- 58.Dobin A et al. STAR: ultrafast universal RNA-seq aligner. Bioinforma. Oxf. Engl 29, 15–21 (2013). [DOI] [PMC free article] [PubMed] [Google Scholar]
- 59.CellBender remove-background: a deep generative model for unsupervised removal of background noise from scRNA-seq datasets ∣ bioRxiv. https://www.biorxiv.org/content/10.1101/791699v1. [Google Scholar]
- 60.Lun ATL et al. EmptyDrops: distinguishing cells from empty droplets in droplet-based single-cell RNA sequencing data. Genome Biol. 20, 63 (2019). [DOI] [PMC free article] [PubMed] [Google Scholar]
- 61.Wolock SL, Lopez R & Klein AM Scrublet: Computational Identification of Cell Doublets in Single-Cell Transcriptomic Data. Cell Syst. 8, 281–291.e9 (2019). [DOI] [PMC free article] [PubMed] [Google Scholar]
- 62.Patro R, Duggal G, Love MI, Irizarry RA & Kingsford C Salmon provides fast and bias-aware quantification of transcript expression. Nat. Methods 14, 417–419 (2017). [DOI] [PMC free article] [PubMed] [Google Scholar]
- 63.Srivastava A et al. Alignment and mapping methodology influence transcript abundance estimation. Genome Biol. 21, 239 (2020). [DOI] [PMC free article] [PubMed] [Google Scholar]
- 64.Soneson C, Love MI & Robinson MD Differential analyses for RNA-seq: transcript-level estimates improve gene-level inferences. F1000Research 4, 1521 (2015). [DOI] [PMC free article] [PubMed] [Google Scholar]
- 65.Stuart T et al. Comprehensive integration of single-cell data. Cell 177, 1888–1902.e21 (2019). [DOI] [PMC free article] [PubMed] [Google Scholar]
- 66.Hafemeister C & Satija R Normalization and variance stabilization of single-cell RNA-seq data using regularized negative binomial regression. Genome Biol. 20, 296 (2019). [DOI] [PMC free article] [PubMed] [Google Scholar]
- 67.Hao Y et al. Integrated analysis of multimodal single-cell data. bioRxiv 2020.10.12.335331 (2020) doi: 10.1101/2020.10.12.335331. [DOI] [Google Scholar]
- 68.Yu G, Wang L-G, Han Y & He Q-Y clusterProfiler: an R Package for Comparing Biological Themes Among Gene Clusters. OMICS J. Integr. Biol 16, 284–287 (2012). [DOI] [PMC free article] [PubMed] [Google Scholar]
- 69.Littlejohns TJ et al. The UK Biobank imaging enhancement of 100,000 participants: rationale, data collection, management and future directions. Nat. Commun 11, 2624 (2020). [DOI] [PMC free article] [PubMed] [Google Scholar]
- 70.Sudlow C et al. UK Biobank: An Open Access Resource for Identifying the Causes of a Wide Range of Complex Diseases of Middle and Old Age. PLOS Med. 12, e1001779 (2015). [DOI] [PMC free article] [PubMed] [Google Scholar]
- 71.Agrawal S et al. Association of machine learning-derived measures of body fat distribution in >40,000 individuals with cardiometabolic diseases. 2021.05.07.21256854 https://www.medrxiv.org/content/10.1101/2021.05.07.21256854v1 (2021) doi: 10.1101/2021.05.07.21256854. [DOI] [Google Scholar]
- 72.Kichaev G et al. Leveraging Polygenic Functional Enrichment to Improve GWAS Power. Am. J. Hum. Genet 104, 65–75 (2019). [DOI] [PMC free article] [PubMed] [Google Scholar]
- 73.Pruim RJ et al. LocusZoom: regional visualization of genome-wide association scan results. Bioinforma. Oxf. Engl 26, 2336–2337 (2010). [DOI] [PMC free article] [PubMed] [Google Scholar]
- 74.Timshel PN, Thompson JJ & Pers TH Genetic mapping of etiologic brain cell types for obesity. eLife 9, e55851 (2020). [DOI] [PMC free article] [PubMed] [Google Scholar]
- 75.Mahajan A et al. Fine-mapping type 2 diabetes loci to single-variant resolution using high-density imputation and islet-specific epigenome maps. Nat. Genet 50, 1505–1513 (2018). [DOI] [PMC free article] [PubMed] [Google Scholar]
- 76.Loh P-R, Kichaev G, Gazal S, Schoech AP & Price AL Mixed-model association for biobank-scale datasets. Nat. Genet 50, 906–908 (2018). [DOI] [PMC free article] [PubMed] [Google Scholar]
- 77.Finucane HK et al. Partitioning heritability by functional annotation using genome-wide association summary statistics. Nat. Genet 47, 1228–1235 (2015). [DOI] [PMC free article] [PubMed] [Google Scholar]
- 78.Teslovich TM et al. Biological, clinical and population relevance of 95 loci for blood lipids. Nature 466, 707–713 (2010). [DOI] [PMC free article] [PubMed] [Google Scholar]
- 79.Bradfield JP et al. A Genome-Wide Meta-Analysis of Six Type 1 Diabetes Cohorts Identifies Multiple Associated Loci. PLOS Genet. 7, e1002293 (2011). [DOI] [PMC free article] [PubMed] [Google Scholar]
- 80.Loh P-R et al. Reference-based phasing using the Haplotype Reference Consortium panel. Nat. Genet 48, 1443–1448 (2016). [DOI] [PMC free article] [PubMed] [Google Scholar]
- 81.Das S et al. Next-generation genotype imputation service and methods. Nat. Genet 48, 1284–1287 (2016). [DOI] [PMC free article] [PubMed] [Google Scholar]
- 82.Robinson MD, McCarthy DJ & Smyth GK edgeR: a Bioconductor package for differential expression analysis of digital gene expression data. Bioinformatics 26, 139–140 (2010). [DOI] [PMC free article] [PubMed] [Google Scholar]
- 83.Büttner M, Ostner J, Müller C, Theis F & Schubert B scCODA: A Bayesian model for compositional single-cell data analysis. bioRxiv 2020.12.14.422688 (2020) doi: 10.1101/2020.12.14.422688. [DOI] [PMC free article] [PubMed] [Google Scholar]
- 84.Cawthorn WP, Scheller EL & MacDougald OA Adipose tissue stem cells meet preadipocyte commitment: going back to the future[S]. J. Lipid Res 53, 227–246 (2012). [DOI] [PMC free article] [PubMed] [Google Scholar]
Associated Data
This section collects any data citations, data availability statements, or supplementary materials included in this article.
Supplementary Materials
Data Availability Statement
Single cell RNA expression and count data is deposited in the Single Cell Portal (Study #SCP1376). Processed count data for bulk RNA-seq and dge matrices for single cell and single nucleus RNA-seq have been deposited in GEO (Bulk-seq Accession #GSE174475, sc-RNA-seq Accession # GSE176067, sNuc-sec Acession #GSE176171), raw sequencing reads for mouse data are available in SRA, study #SRP322736. FASTQ and SNP array files for human samples are deposited in dbGaP, Accession #phs002766.v1.p1. Publicaly available datasets and databases used were the following: METSIM RNA-seq data from Raulerson et. al.13 (GSE135134); single cell ASPC data from Burl et. al.4 (SRP145475), Hepler et. al.6 (GSE111588), Merrick et. al.5 (GSE128889), Sárvári et. al.9 (GSE160729), and Schwalie et. al.3 (E-MTAB-6677); human assembly GRCh38 and GENCODE annotation 27 (https://www.gencodegenes.org/human/release_27.html); mouse assembly GRCm38 and GENCODE annotation M16 (https://www.gencodegenes.org/mouse/release_M16.html).


