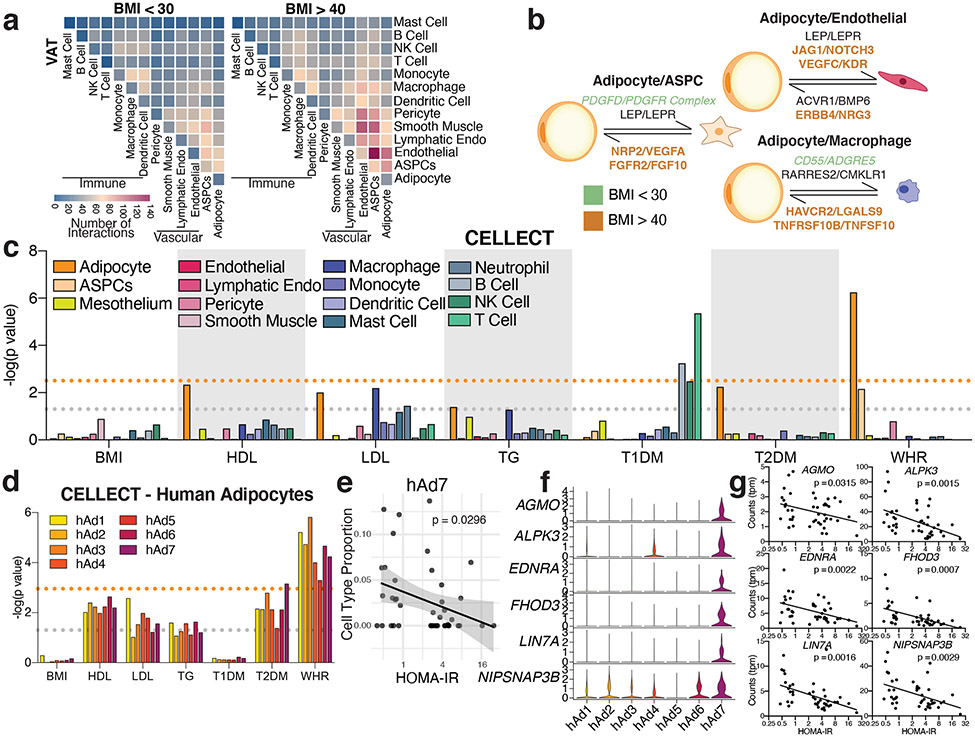
Fig. 4. Extensive cell-cell interactions in WAT and associations with human disease traits.
a, Heatmap showing number of significant interactions identified between cell types in VAT of low (<30) and high (>40) BMI individuals as determined by CellphoneDB. b, Selected interactions between adipocytes and ASPCs, endothelial cells, and macrophages identified using CellphoneDB; orange and green indicate interactions that are significant only in BMI > 40 or only in BMI >30, respectively. c, CELLECT p values of the association between cell types in the human adipose sNuc-seq dataset with GWAS studies. The grey line represents p = 0.05 and the orange line represents significant p value after Bonferroni adjustment (p = 0.003), based on number of cell types queried. Both T2D and WHR were BMI-adjusted. d, CELLECT p values for adipocyte subpopulations. The grey line represents p = 0.05 and the orange line represents significant p value after Bonferroni adjustment (p = 0.001), based on all cell subtypes queried. e, Estimated cell type proportion of hAd7 in bulk RNA-seq data of enzymatically isolated subcutaneous adipocytes from 43 individuals plotted against HOMA-IR. For line of best fit, R2 = 0.11, the error band represents a confidence level of 0.95. f-g, Expression of hAd7 marker genes negatively correlated with HOMA-IR in human adipocyte subpopulations (f) and bulk RNA sequencing data of human adipocytes (g). For scatterplots, p values were calculated using an F-test with the null hypothesis that the slope = 0.

