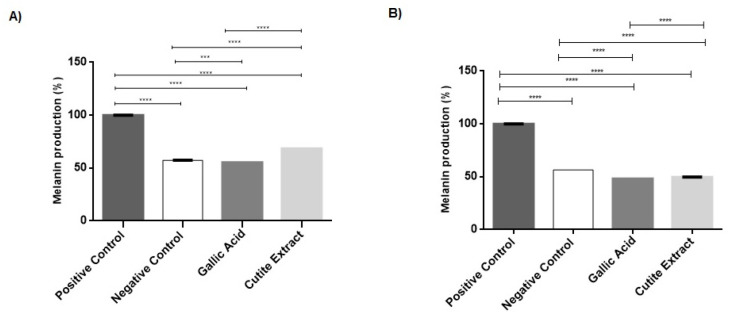
Figure 2.
Melanocyte pigmentation was analyzed compared to IBMX-stimulated cells (positive control) and untreated cells (negative control). Intracellular melanin (A) production produced by B16F10 cells as well as melanin secretion in culture supernatant (B) after treatment with gallic acid and extract for 48 h, stored in an oven, were measured. Each bar represents an average of 3 determinations ± SD. *** p < 0.001; **** p < 0.0001.

