Figure 4.
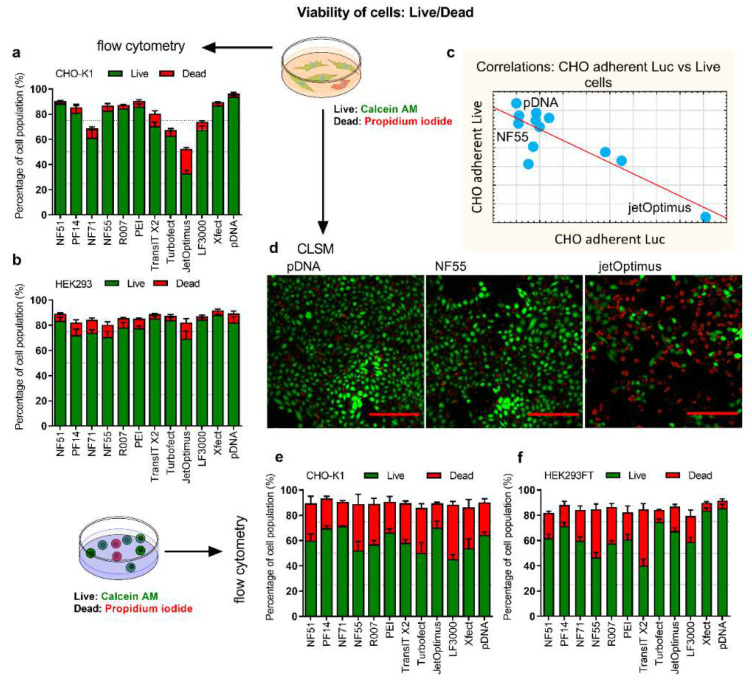
Cell viability post-transfection was assessed by the live/dead assay. Adherent (a) CHO-K1 cells and (b) HEK293 cells were transfected with 0.5 µg of pLuc per 24-well plate well. CPP/pDNA complexes were formed at CR3:1, and PEI complexes at N/P20. Analysis was done 24 h post-transfection. Calcein AM (live) and PI (dead) were added to detect live and dead cells. (c) The correlation graph depicting correlations between luciferase expression levels against viability of cells in adherent cell experiments. (d) The representative confocal images of cells 24 h post-treatment with pDNA, and cells transfected using jetOPTIMUS (jetOptimus) or NF55 (NF55). The red bar corresponds to 200 µm. Suspension (e) CHO K1 and (f) HEK293FT cells were transfected in serum-free media with 0.75 µg of pSEAP. CPP/pDNA complexes were formed at CR2:1, and PEI/pDNA at N/P20 (HEK293FT) or N/P60 (CHO-K1). 48 h post-transfection cells were collected, and Calcein AM and PI were added to detect live and dead cells from the whole cell population. N ≥ 3.

