Abstract
In vivo genetic footprinting was developed in the yeast Saccharomyces cerevisiae to simultaneously assess the importance of thousands of genes for the fitness of the cell under any growth condition. We have developed in vivo genetic footprinting for Escherichia coli, a model bacterium and pathogen. We further demonstrate the utility of this technology for rapidly discovering genes that affect the fitness of E. coli under a variety of growth conditions. The definitive features of this system include a conditionally regulated Tn10 transposase with relaxed sequence specificity and a conditionally regulated replicon for the vector containing the transposase and mini-Tn10 transposon with an outwardly oriented promoter. This system results in a high frequency of randomly distributed transposon insertions, eliminating the need for the selection of a population containing transposon insertions, stringent suppression of transposon mutagenesis, and few polar effects. Successful footprints have been achieved for most genes longer than 400 bp, including genes located in operons. In addition, the ability of recombinant proteins to complement mutagenized hosts has been evaluated by genetic footprinting using a bacteriophage λ transposon delivery system.
Large-scale sequencing of the genomes of many different microorganisms has yielded information for thousands of genes. However, the functions of a significant number of these genes remain unknown. Conventional knockout techniques have been used to examine the effect of deleting or disrupting a gene, but these techniques are difficult to apply on a genomic scale. Genetic footprinting allows the rapid, simultaneous determination of the importance of a large number of genes required for growth under a chosen condition (19, 20).
Genetic footprinting is a three-step process involving transposon mutagenesis, outgrowth of the mutagenized cell population, and analysis of the fate of cells carrying mutations in specific genes. The first step involves insertional mutagenesis using a transposon that inserts randomly throughout the genome. Following this period of mutagenesis where transposase expression is induced, a sample of the initial population, designated T0 (time zero), is taken. The second step is growth of the mutagenized T0 culture over many population doublings under conditions that repress transposase expression and plasmid replication. The third step is the comparative evaluation of transposon insertions present within specific genes based on analysis of PCR products generated from DNA isolated from the T0 mutagenized culture versus samples from the outgrowth culture (e.g., T15, T30, and T45 [15, 30, 45 population doublings, respectively]). Bacteria containing transposon insertions in genes that are important for the fitness or viability of the organism under a specific growth condition will not be represented in the outgrowth population, and therefore loss or diminution of PCR products corresponding to insertions within that gene will be observed. By measuring the loss of gene-specific PCR products with time, Smith and coworkers (20) estimated the relative growth rate of each mutant and exposed subtle effects on growth rate from the loss of function of a gene considered nonessential by conventional gene disruption and phenotypic examination. In contrast, cells will tolerate transposon insertions within nonessential or redundant genes under a specific growth condition.
Two related methods have been described to identify candidate essential or important genes in two fastidious bacteria, Haemophilus influenzae and Streptococcus pneumoniae (1, 18). These approaches utilize in vitro transposon mutagenesis of genomic DNA or PCR products, followed by transformation of the host with the mutagenized DNA pool, selection for recombinants, and detection of transposon insertions within a gene of interest. However, this technology is likely to be limited to a set of organisms with natural competence for transformation with linear DNA and high homologous recombination rates (e.g., H. influenzae and S. pneumoniae) (1, 18). In this report we describe the development of in vivo, plasmid-borne, transposon-mediated genetic footprinting in bacteria, allowing the rapid analysis of the importance of a multiplicity of genes for the growth of Escherichia coli. In addition, we demonstrate the application of a λ phage transposon delivery system for genetic footprinting.
MATERIALS AND METHODS
Media.
L medium (20 g of tryptone, 10 g of yeast extract, and 7 g of NaCl per liter) and M9 minimal medium (0.2% glucose, 1 mM MgSO4, 1 μg of thiamine HCl per ml, 0.1 mM CaCl2) were used for plasmid-based genetic footprinting (7). Unless noted otherwise, antibiotics were used at the following final concentrations: ampicillin (AMP) at 100 μg/ml, kanamycin (KAN) at 30 μg/ml, chloramphenicol (CHL) at 30 μg/ml, and streptomycin (STR) at 1 mg/ml. Isopropylthiogalactopyranoside (IPTG) was used at 1 mM final concentration unless noted otherwise. Luria-Bertani medium (LB), used for the phage-mediated genetic footprinting, contains 10 g of tryptone, 5 g of yeast extract, and 10 g of NaCl per liter. For phage infection, we used TBMM (10 g of tryptone and 5 g of NaCl per liter, 0.2% maltose, 10 mM MgSO4, 1 μg of thiamine per ml) as described previously (14).
Strains.
E. coli strains W3110 and MG1655 have been described elsewhere (13). For recombinant gene expression, W3110 was modified to express T7 RNA polymerase as follows. T7 RNA polymerase and lacI were amplified by PCR from E. coli λDE3 (21), with oligonucleotides 5′-CCGTTCCCGGGGCCCGAGAAGATGTTGAGC-3′ and 5′-TCGCTCCCGGGCCGCTTTCATCCGGCACAG-3′, to introduce flanking SmaI sites. The resulting PCR product was cloned into pUC19 at the SmaI site to generate pUC19T7. DNA sequence analysis revealed that the T7 RNA polymerase gene contained two transitions compared to the published sequence (GenBank accession number 216011), an A-to-G change at position 389 and a C-to-T change at position 2236. The erythromycin resistance gene (erm) was cloned from pAT110 (22), as an EcoRI fragment, into pUC19T7, yielding pUC19T7erm. The entire T7erm cassette was cloned into pBRINT (3) as a HindIII (complete digest) and EcoRI (partial digest) fragment. JC7623 (recBC sbcC) (23) was transformed by pBRINT T7erm to gentamicin resistance (10 μg/ml) to select for recombination into the chromosome at the lacZ locus. Phage P1 was grown on an isolate, and the resulting lysate was used to transduce W3110 to gentamicin (10 μg/ml) resistance. The resulting colonies were then checked for the ability to overexpress a protein of interest (see below). A positive isolate was designated W3110 T7 RNAP.
Construction of footprinting plasmid pGT-G69.
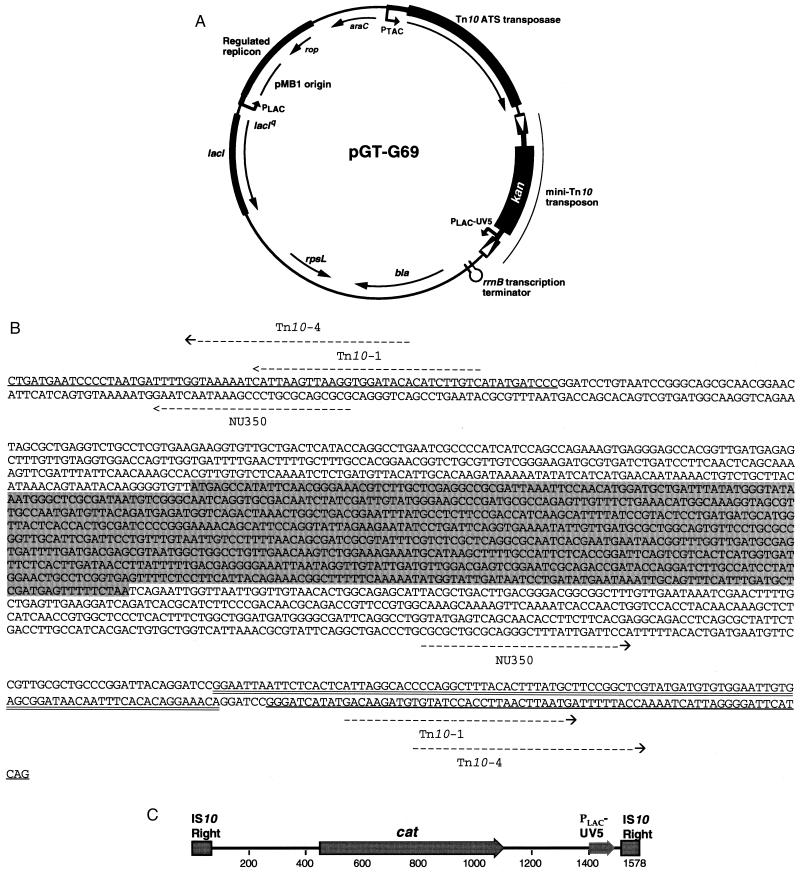
The transposon delivery plasmid, pGT-G69, used for footprinting is shown in Fig. 1A. Plasmid pAM34 (ATCC 77185) was digested with BamHI and AatII and blunt ended with DNA polymerase I (Klenow fragment). The resulting 3-kb fragment, containing a strong terminator, the ColE1 origin of replication under lac promoter (Plac) control, the rop gene, and the lacIq gene, was purified and ligated to pBAD18 that had been previously digested with AlwN1 and ClaI and blunt ended. Clones were tested for IPTG-dependent replication. A plasmid having the lacIq gene in a counterclockwise orientation was chosen and designated pBAD37.
FIG. 1.
(A) Schematic illustration of the genetic footprinting vector pGT-G69. The relaxed-target-specificity Tn10 transposase gene is under the control of the tac promoter (PTAC), the mini-Tn10 has the lac-UV5 promoter (PLAC-UV5) at one end of the element, and the pMB1 origin of replication is regulated by the lac promoter (PLAC). (B) Sequence of the mini-Tn10-kan-Plac-UV5 transposon and locations of the primers used for footprinting. Sequence features: shaded, kan gene; underlined, inverted repeat of mini-Tn10; double underlined, Plac-UV5; arrows, locations and directions of primers Tn10-1, Tn10-4, and NU350. The distances from the 5′ ends of primers Tn10-1 and Tn10-4 to the end of the transposon are the same in both directions; therefore, the length of the PCR product generated from a gene-specific primer and either Tn10-1 or Tn10-4 is independent of the orientation of insertion. Since the NU350 primer is asymmetrically located due to the presence of Plac-UV5 in one orientation, the distance from the 5′ end of the NU350 primer to the end of the transposon is 258 or 148 nucleotides, depending on the orientation. (C) Schematic illustration of the mini-Tn10-cat-Plac-UV5 transposon used in phage-mediated genetic footprinting. Transposon features are as described above.
The wild-type rpsL gene from plasmid pNO1523 (ATCC 37095) was introduced into pBAD37 as follows. Plasmid pNO1523 was digested with SspI and PshAI, and the resulting 1.4-kb blunt-ended fragment was ligated into the DraIII site (blunt ended with T4 DNA polymerase) of pBAD37. The ligation products were used to transform a Strr rpsL mutant strain, and recombinant clones were tested for loss of the plasmid in the presence of STR (1 mg/ml), with IPTG (promoting plasmid replication) or without IPTG. A clone exhibiting the appropriate phenotype for both selections was chosen and designated pBAD39. As expected, counterselection of pBAD39 on plates containing STR was more effective when simultaneously using nonreplicative (no IPTG) conditions for the plasmid. Under these conditions, pBAD37 and pBAD39 require about 14 population doublings to be lost from the bacterial population when replication is repressed by the absence of IPTG (data not shown).
The final step in construction of footprinting plasmid, pGT-G69, was inserting a mini-Tn10 transposon (14) derived from pNK2887 (Ptac-mini-Tn10-Plac) (ATCC 77343) into pBAD39. To minimize possible polar effects arising from insertion of the transposon into an operon, the transposon contains an outward-reading Plac-UV5 located within the mini-Tn10. pGT-G69 was constructed by subcloning the 4.0-kb EcoRI fragment from pNK2887 (blunt ended using T4 polymerase) and ligating it into the pBAD39 backbone digested with SacI and NsiI and blunt ended with T4 DNA polymerase. Other general features of pGT-G69 include the E. coli rrnB transcription terminator, a β-lactamase gene encoding AMP resistance (Ampr), and a counterselectable marker, rpsL (not used for the footprinting experiments described here).
Construction of a bacteriophage λ transposon delivery vehicle, λHS.
The λ phage λHS was used to deliver a mini-Tn10 transposon marked with a Tn9-derived cat gene (conferring Chlr) followed by an outward-reading Plac-UV5 and the relaxed-target-specificity transposase on the hop phage λ b522 cI857 Pam80 nin5 (14). The mini-Tn10 portion of λHS is depicted in Fig. 1C. λHS, a derivative of λNK1324 (14) differing only in that an outward-reading Plac-UV5 is downstream of the cat gene in the BamHI site, was constructed as follows. The cat gene was first fused to Plac-UV5 using PCR by the overlap extension method of Horton and coworkers (12). Primers 5′-AGACGTTCGGGATCCGATGTCCGGCGGTGCTTTTG-3′ and 5′-AATGAGTGAGAATTAATTCCAACCGTTTTTATCAGGCTCT-3′ were used to amplify the cat gene from pNK2884 (14), and primers 5′-AGAGCCTGATAAAAACGGTTGGAATTAATTCTCACTCATT-3′ and 5′-ACGTCTATGGATCCTGTTTCCTGTGTGA-3′ were used to amplify the Plac-UV5 sequence from pNK2887 (14). The resulting DNA fragment was digested with BamHI and ligated to the large fragment of BamHI-digested pNK2859 (14), which carries the transposase, yielding pHS241. The orientation of cat relative to the transposase was found to be the same as in the mini-Tn10 cat present in pNK2884. The mini-Tn10-cat-Plac-UV5/transposase was then recombined into the λ hop phage as follows. Plasmid pHS241 was propagated in E. coli C600 (14), and a phage lysate was made using λNK1327 (mini-Tn10-kan-Plac-UV5 located on the λ hop phage [14]). This phage lysate was then used for plaque production on C600 cells in LB soft agar containing 6 μg of CHL per ml (a concentration that reduces growth of C600 in the soft agar overlay [data not shown]). Phage that caused increased cell growth surrounding the plaque (suggesting that these phage contained the cat gene) were purified. The resulting phage, named λHS, was used to deliver the mini-Tn10-cat-Plac-UV5 to W3110. All Chlr colonies were Kans and Amps, indicating that the Chlr marker exchanged with the Kanr marker of λNK1327 and that pHS241 linked to the Ampr marker did not recombine into the mini-Tn10 (data not shown). It should be noted that λHS, at a given concentration, infected host C600 and gave rise to plaques in an overlay but did not give rise to plaques on W3110 (data not shown).
Expression plasmids.
The E. coli murB and murI genes were cloned into plasmid pET-29a(+) such that the expressed protein product was fused to the S peptide at the N terminus and to a six-histidine peptide at the C terminus (Novagen, Madison, Wis.). These plasmids were introduced into W3110 T7 RNAP, and expression was verified by immunoblotting (data not shown).
Transposase induction and selection for Tn10 transposition in E. coli: T0 population.
E. coli strain MG1655 rpsL(pGT-G69) was grown in 50 ml of L broth (containing AMP and IPTG) until the cells reached an optical density at 600 nm (OD600) of 0.8 (2 × 10⁸ to 5 × 10⁸ cells/ml). The 50-ml culture was then added to 1 liter of L broth supplemented with AMP (100 μg/ml) and IPTG (1 mM) and incubated at 37°C until the cells reached an OD600 of 0.8 (growth time of approximately 4 h). This cycle was repeated three more times for a total of four growth cycles. To obtain sufficient T0 DNA for footprinting on a genomic scale, at the end of the fourth growth cycle, 500 ml of culture was added to a fermentation vessel containing 10 liters of L broth and grown until the culture reached an OD600 of 0.8. In total, the five growth cycles represent approximately 25 population doublings. Cells were harvested, resuspended in medium containing 15% glycerol at a concentration of 40:1, dispensed in 2-ml fractions, and stored at −80°C. DNA and cells obtained from these frozen samples were designated T0.
Outgrowth of mutagenized cell populations: isolation of T15, T30, and T45 cultures.
A 2-ml aliquot of frozen cells (1.6 × 10¹⁰ to 8 × 10¹⁰ cells) from the T0 culture was used to inoculate 500 ml of L broth lacking IPTG. The culture was incubated at 37°C until an OD600 of 0.8 was reached. Fifty milliliters of the culture was transferred to 1 liter of rich medium, and the culture was grown for 45 population doublings by repeating this step eight to nine times. During outgrowth, 50-ml T15 and T30 samples were withdrawn and treated in the same manner as the T45 culture: resuspended in 15% glycerol at a concentration of 40:1 and frozen in aliquots for subsequent isolation of chromosomal DNA. For alternate outgrowth conditions, the growth procedure described above was repeated using different media including minimal medium and minimal medium supplemented with leucine.
Infection and analysis for bacteriophage λ-based transposon delivery.
Cells containing a tagged gene to be tested for complementation were infected with λHS as follows. The transformed W3110 T7 RNAP strain, in 10 ml of TBMM plus KAN (35 μg/ml), was grown at 37°C for 16 h. The cells were harvested and resuspended in 1 ml of LB. These cells were infected with 0.5 ml of λ phage lysate (multiplicity of infection = 1) and incubated at room temperature for 15 min and then at 37°C for 15 min. The cells were transferred to a 250-ml flask containing 50 ml of LB supplemented with 50 mM sodium citrate and 50 μM IPTG, grown for 1 h with shaking at 37°C, and then harvested and transferred to 1 liter of LB containing 5 mM sodium citrate, CAM (35 μg/ml), KAN (35 μg/ml), and 50 μM IPTG. The culture was incubated with shaking at 30°C for 14 to 16 h or until the OD600 reached 1.0 to 1.4. Cells from 100 ml of the culture were harvested, resuspended in 2 ml of LB plus 10% glycerol, frozen in a dry ice-ethanol bath, and stored at −80°C.
Genomic DNA isolation, PCR, and product analysis.
Bacterial chromosomal DNA was isolated using a Qiagen Genomic Tip-500 (according to the manufacturer's instructions). Extracted DNA was dissolved in 10 mM Tris-HCl (pH 8.0).
Conditions for PCR and the criteria for oligonucleotide primer design were similar to those described previously (19). Primers were chosen using the program Oligo 4.06 (National Biosciences, Plymouth, Minn.) and annealed within 300 to 1,500 bp of the 5′ terminus of each gene. Gene-specific primers (24-mers) were synthesized by Research Genetics (Huntsville, Ala.) and contained a covalently attached 6-carboxyfluorescein moiety at the 5′ terminus. Three unlabeled transposon-specific primers were used in these studies; Tn10-1 and Tn10-4 are complementary to both IS10 elements of the pNK2887-derived mini-Tn10 (Fig. 1 and Table 1). The 5′ end of Tn10-1 begins 62 nucleotides from the end of each insertion sequence element, while the 5′ end of Tn10-4 begins 53 nucleotides from the end of each insertion sequence element. Thus, both oligonucleotides prime outwardly, generating a PCR product from any given gene-specific primer irrespective of the orientation of the transposon. The third transposon-specific primer, NU350, anneals to a region asymmetrically located within the transposon; the distance from the 5′ end of the NU350 primer to the end of the transposon is either 258 or 148 nucleotides. PCRs were performed in a 50-μl final volume that contained 0.5 μg of template DNA, 0.5 μM each primer, 250 μM each deoxynucleoside triphosphate, PCR buffer (10 mM Tris-HCl [pH 8.3], 50 mM KCl, 1.5 mM MgCl2, 0.001% gelatin), and 2 U of Taq DNA polymerase (Perkin-Elmer, Foster City, Calif.). Amplification conditions were 94°C for 1 min; 92°C for 30 s, 67°C for 45 s, and 72°C for 2 min (10 cycles); 92°C for 30 s, 62°C for 45 s, and 72°C for 2 min (20 cycles); and 72°C for 3 min. If initial PCR conditions for the phage-based system did not produce a robust product, the annealing temperatures were reduced to 62°C in the first 10 cycles and 58°C for the next 22 cycles.
TABLE 1.
Oligonucleotide PCR primers used for genetic footprinting
| Genetic locus | Primer name | Primer sequence | 3′ end of gene-specific oligonucleotidea | Transposon primer |
|---|---|---|---|---|
| Transposon | NU350 | CGCTGCGCAGGGCTTTATTGATTC | ||
| Tn10-1 | GACAAGATGTGTATCCACCTTAACTTAATG | |||
| Tn10-4 | TGTATCCACCTTAACTTAATGATTTTTACC | |||
| leuA | EXFP004 | ACTTTGATCGCCATGATGACTTCT | 726 | Tn10-1 |
| leuB | EXFP005 | CATCATCGGCATCCAGGCTGTAAC | 932 | Tn10-1 |
| leuC | EXFP006 | GTTGCGAATGTCGGCGAAATGTCC | 1369 | Tn10-1 |
| leuD | EXFP007 | AAACGCAGGTTGTTTTGCTTCATA | 574 | Tn10-1 |
| malE | EFP0520 | TCTTTCGCCAACTCTTCCTCGTAA | 996 | NU350 |
| phnE | EFP0526 | GCAGCACGCCGTAGAGGATCTCTT | 583 | Tn10-1 |
| rplD | EFP2199 | TCAGCACATCTTCCAGAGCCATGT | 419 | Tn10-1 |
| secD | EFP2018 | CTGGTTGCTGCCCTGGCTGCTAAT | 604 | Tn10-4 |
| secF | EFP0206 | CGTCTGGGTCAAGGACACGTTAAA | 709 | NU350 |
| yacE | EFP3003 | TTTTCCTGTGAGACAAACTGCGAC | 591 | Tn10-1 |
| yacF | EFP4065 | ACGAATGGCAAAACGGCTCTTATG | 652 | Tn10-1 |
| yacG | EFP4064 | CTGCTGGGGATTCGTTTTTCTTCA | 156 | Tn10-1 |
| murB | EFP55 | GGTGCTGTTGGAAATTGTGACAGT | 729 | NU350 |
| murI | EFP515 | TACAACGGTATCTGGCGGCTCTTT | 592 | NU350 |
| murBb | murB R1 | GGTGCTGTTGGAAATTGTGACAGT | 54c | Tn10-1 |
| murIb | murI L1 | TCACCTCTCACCTGACAGTTCGTG | 973 | Tn10-1 |
All positions relative to first nucleotide of initiation codon.
Gene-specific primer used for bacteriophage-mediated genetic footprinting.
Primes in direction of stop codon.
For analysis, 3-μl aliquots of the PCR products were added to 3 μl of loading solution (100 mg of blue dextran per ml, GeneScan 2500 Tamara gene standards [Perkin-Elmer], deionized formamide [1:1:5]). Samples were denatured for 3 min at 100°C, immediately placed in an ice-water bath, and loaded (1.5 to 3 μl) onto a 5% polyacrylamide gel (Long Ranger; BioWhittaker, Rockland, Maine) containing 6 M urea and 1× Tris-borate-EDTH buffer. Electrophoresis and analysis of the PCR products were performed using an ABI 377 Prism DNA sequencer (Perkin-Elmer) and associated software (377XL model version 2.0 and GeneScan version 2.0.2). Size and distribution of PCR products were further analyzed with the ABI Genotyper software package, version 2.0.
RESULTS
Plasmid-based transposon delivery for genetic footprinting in E. coli.
A transposon delivery plasmid for bacterial mutagenesis and footprinting includes three important features: a transposon that inserts randomly throughout the genome; an outward-reading promoter on the transposon to minimize potential polar effects of insertion mutations within operons; and to suppress further mutagenesis, a transposase linked to a regulatable promoter on a plasmid containing a conditionally functional origin of replication. Based on these requirements, we developed a plasmid for genetic footprinting in E. coli (Fig. 1A). The central feature of pGT-G69 is the mini-Tn10 (kan) transposon, containing the outwardly oriented Plac-UV5, described by Kleckner and coworkers (14) (Fig. 1B). To achieve the necessary distribution of insertions on a genomic scale while maintaining the frequency of insertions typical of Tn10, we used a previously described Tn10 transposase with a relaxed target sequence specificity (4, 5). These Tn10 transposase mutations, ats1 and ats2, cause a general relaxation in site specificity without a substantial effect on the rate of transposition (4). To regulate mutagenesis, the transposase was placed under the control of Ptac (Fig. 1A), a strong, IPTG-inducible promoter (8).
To repress replication of pGT-G69 after transposon induction was complete, Plac (Fig. 1A) replaced the natural RNA II transcript promoter of ColE1-derived plasmids. To decrease plasmid replication further, the plasmid carries the lacIq repressor gene. Therefore, maintenance of the plasmid requires the presence of IPTG; in the absence of IPTG, replication is inhibited and plasmids are lost by segregation (data not shown).
Analysis of the genetic footprint of known nonessential and essential genes of E. coli.
A transposon insertion mutation within a nonessential gene would not be expected to affect the growth rate of the cell, whereas a transposon insertion within an essential gene would likely result in a measurably diminished growth rate or fitness of the mutant compared to the cell population. As a consequence of this competitive growth disadvantage, the abundance of gene-specific PCR products amplified from insertion mutations within an essential gene will be substantially (>90%) reduced from T0 to T15 (20). A gene in which the majority of the transposon insertions present in the T0 sample are present at similar levels in the later samples is not likely to be critical for growth under the conditions tested. Here we refer to genes that show results similar to the former as important or critical for cell viability and the latter as nonessential.
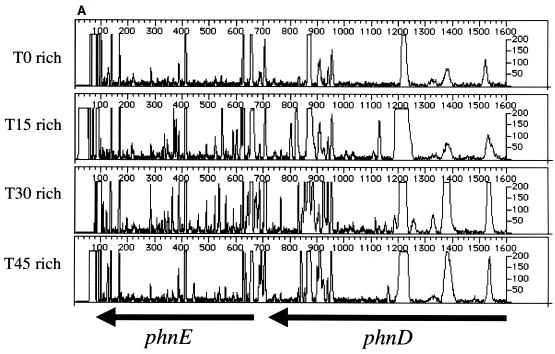
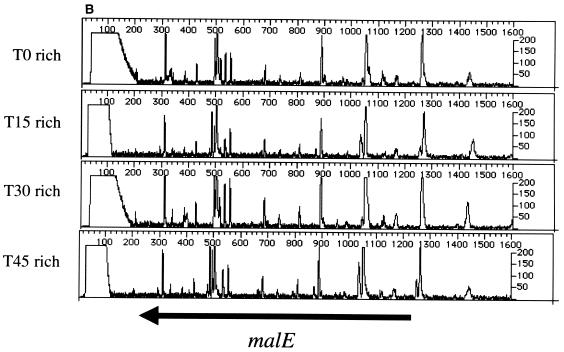
We performed PCR using T0, T15, T30, and T45 template DNA and gene-specific primers (see Materials and Methods and Table 1) for several known nonessential and essential genes. The results of the analysis of PCR products generated using phnD- and malE-specific primers are shown in Fig. 2. At T0 there are numerous transposon insertions. The later time points demonstrate a pattern of mutagenesis similar to that of the T0 sample. Thus, the cells harboring transposon insertions in phnE, phnD (phosphonate transport) (15), or malE (maltose binding protein) (11) are able to grow and divide for 45 population doublings in rich medium, with little or no difference in growth rate from strains without insertions in these loci. These results confirm that the phnE, phnD, and malE genes are dispensable for growth and therefore nonessential under the conditions tested.
FIG. 2.
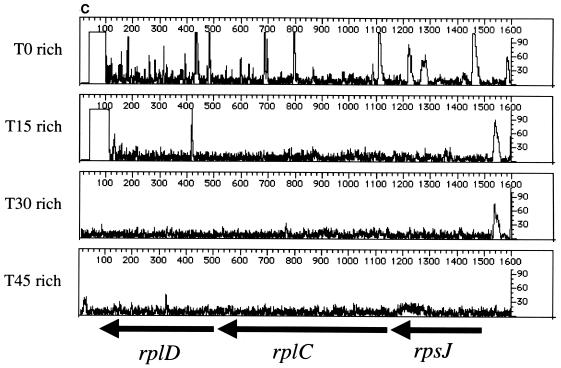
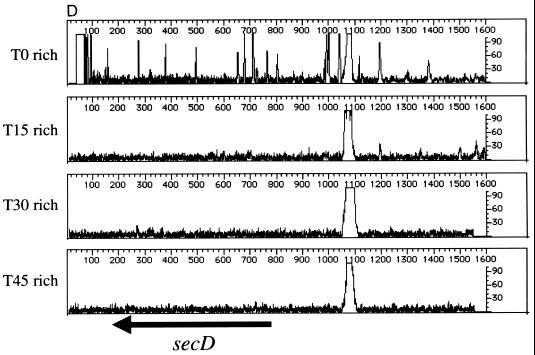
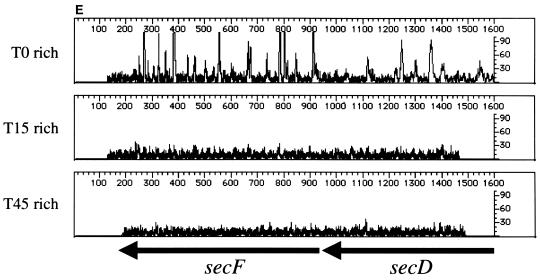
Genetic footprinting of known nonessential and essential genes. Results are plotted as product abundance versus length. (A) phnE and phnD; (B) malE; (C) rplD, rplC, and rpsJ; (D) secD and secF. T0 is the point at which the replication of the plasmid and insertion of the transposon are repressed, and T15, T30, and T45 are the number of population doublings in rich medium after T0. The arrows correspond to the position of the gene, from the initiator codon, and indicate the direction of transcription of the gene. Table 1 gives exact positions of the primers.
We then footprinted several genes known to be important for growth in rich media (ribosomal proteins [rplD, rplC, and rpsJ] and protein secretion factors [secD and secF]). Like the nonessential genes described above, we observed a significant level of mutagenesis in the T0 samples; however, the loss of PCR products representing insertions into these genes is apparent when the T0 populations are compared to the T15, T30, and T45 populations (Fig. 2C to and E). In agreement with published results of mutation analysis (10, 16), the genetic footprints of these genes indicate that cells carrying insertions in rplD, rplC, rpsJ, secD, or secF grow at significantly lower rates in rich medium than the cell population without disruption in these genes.
Analysis of the genetic footprints of genes showing conditional importance.
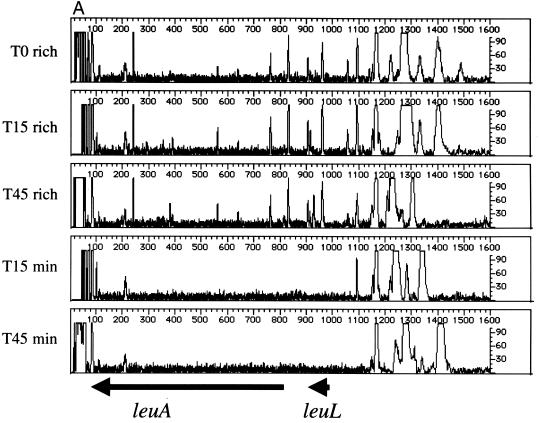
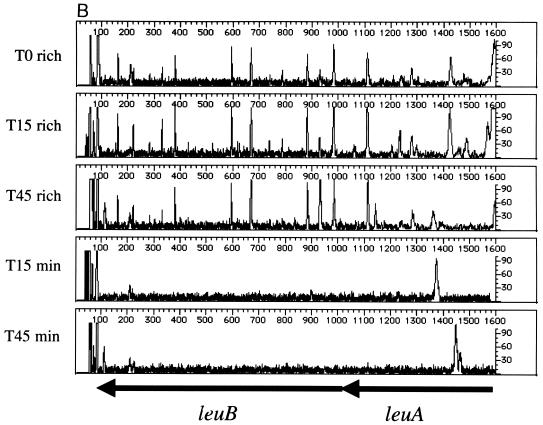
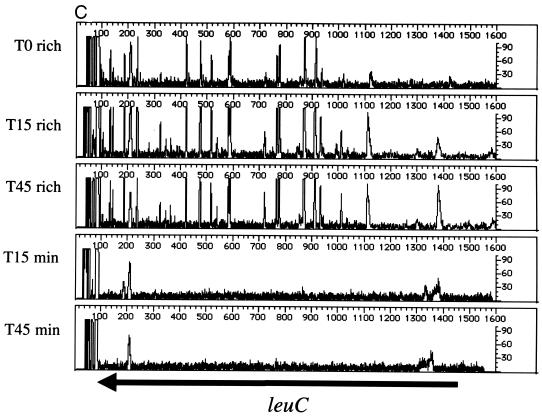
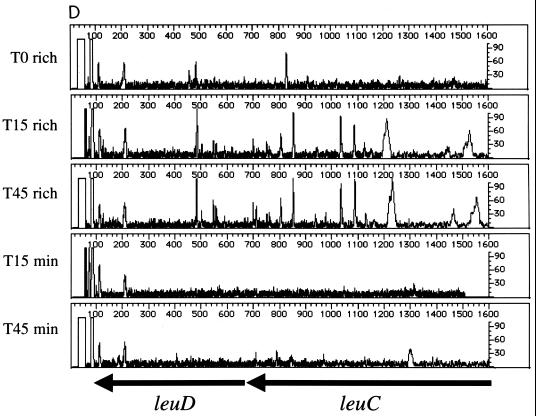
Beginning with the same T0 cell population, the leu operon (leuABCD) was footprinted after outgrowth in rich or minimal medium. This operon encodes four of the five enzymes required for leucine biosynthesis (conversion of α-ketoisovalerate to α-ketoisocaproate). Thus, insertions within the leu operon should affect only the growth of cells propagated in minimal media (lacking leucine). The results of footprinting the four leu genes are shown in Fig. 3. The gene-specific primer sequence used for leuA lies within the open reading frame; it covers the first half of the gene and the 5′ flanking sequences that include the leader sequence leuL and ∼600 nucleotides between leuL and leuO. As expected, insertion mutations in leuA are maintained during growth in rich medium from T0 to the T15 and T45 populations (Fig. 3A). In contrast, when the cell population is grown in minimal medium lacking leucine, the PCR products generated from insertion mutations within the leu genes disappear. The data in Figure 3B confirm these findings. Although leuL is small (87 nucleotides), the footprint pattern is similar to that seen for leuA. Thus, leuA and leuL are important for growth in minimal media. In contrast, insertions proximal to leuL are maintained during growth in minimal media at T15 and T45, indicating that this region is not required for growth under this condition. Similar patterns are seen in Fig. 3B to 3D, which show the impact of insertions in the leuB, leuC, and leuD genes. From the results in Fig. 3, we conclude that insertions into the leuABCD operon have little impact on the growth of E. coli in rich media but severely affect growth in minimal media.
FIG. 3.
Genetic footprinting of conditionally essential genes. Cells were subjected to transposon mutagenesis in rich medium (T0), followed by outgrowth to T15 and T45 in either rich medium (rich) or minimal medium lacking leucine (min). (A) leuA and leuL; (B) leuB and leuA; (C) leuC; (D) leuD and leuC. Other features are as described in the legend to Fig. 2.
Analysis of the genetic footprints of uncharacterized genes.
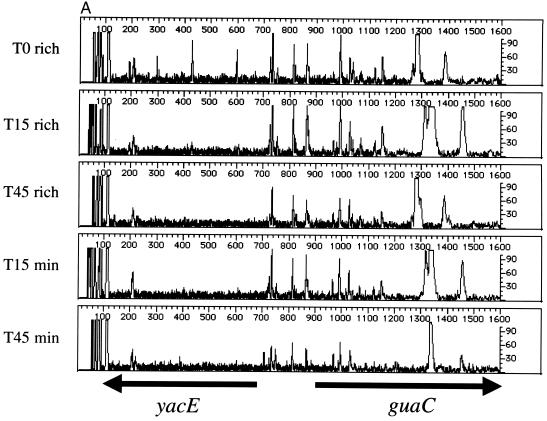
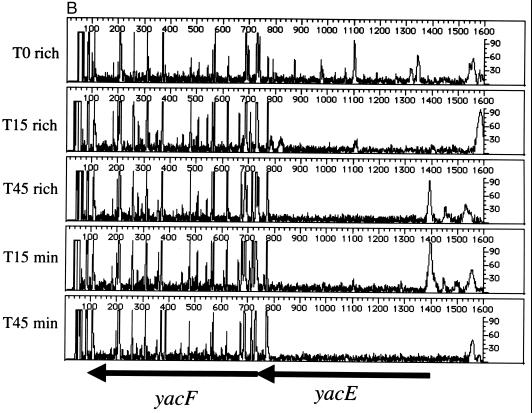
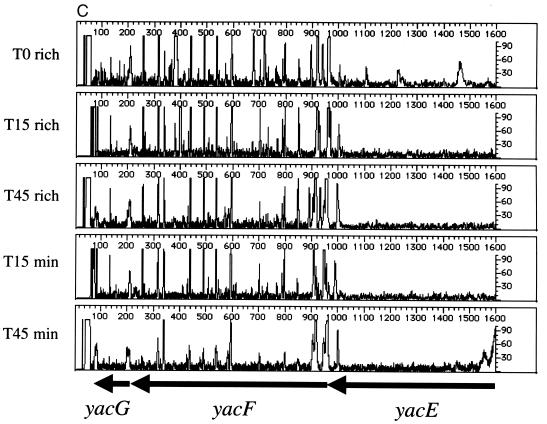
As suggested previously, the major utility of genetic footprinting is in the analysis of genes of unknown function (19). Like the case for Saccharomyces cerevisiae, the complete sequence of the E. coli genome has yielded a large number of open reading frames whose predicted products have no known function (generally designated in E. coli with a four-letter code beginning with the letter “y”). Three such genes, yacE, yacF, and yacG, are clustered together at 2.4 min, between guaC and mutT. The stop codon of yacE and the start codon of yacF overlap, with a consensus ribosome binding site sequence (AGGA) located between 9 and 12 nucleotides upstream of the start codon of yacF. Similarly, the distance between the stop codon for yacF and the start codon for yacG is 10 nucleotides, with a highly conserved consensus ribosome binding site sequence (AAGGAG) between the two genes. This architecture suggests that these genes constitute an operon. To examine the importance of these three open reading frames for cell fitness, we carried out genetic footprinting of yacE, yacF, and yacG using the primers listed in Table 1. Figure 4 shows the analysis of the yacE yacF yacG gene cluster. The data shown in Fig. 4A were generated using the yacE primer, which surveys yacE and the proximal ∼900 nucleotides. This region includes putative 5′ regulatory regions and a portion of the purine salvage enzyme guanine monophosphate reductase gene, guaC (2). These data suggest that the region adjacent to yacE (including guaC) is dispensable for cells grown in rich or minimal media. However, the footprint in the region corresponding to the yacE gene shows a loss of intragenic PCR products in the outgrowth population compared to T0 cells (Fig. 4A and B). For yacF (Fig. 4B and C, using the yacF and yacG primers, respectively), insertions are tolerated when cells are grown in rich medium (T15 and T45) or minimal medium (T15). There may be a small effect on the growth of yacF insertion mutants, as a slight loss of gene-specific PCR products is evident in the T45 cell population grown in minimal medium (Fig. 4C). The small size of the yacG gene (198 bp) makes it difficult to establish a reproducible transposon insertion profile. However, the data in Fig. 4C suggest that yacG may have the same genetic footprint as yacF, with some effects observed at T45 in minimal medium. Consistent with published data (6), our footprint analysis of cells grown in rich medium demonstrated that mutT (encoding 7,8-dihydro-8-oxoguanine triphosphatase), which is distal to the yacE yacF yacG region, is nonessential under these conditions (data not shown). Thus, yacE is important for growth of E. coli in both rich and minimal media, and yacF and yacG are dispensable.
FIG. 4.
Genetic footprinting of genes of unknown function. (A) yacE and guaC; (B) yacF and yacG; (C) yacG, yacF, and yacE. Other features are as described in the legends to Fig. 2 and 3.
Alternative transposon delivery system.
In addition to assessing the contribution of a gene to cell viability, genetic footprinting may also be useful for testing the ability of cloned genes to complement transposon insertion mutations. However, use of the plasmid delivery system described above is complicated by the requirement for plasmid compatibility in bacteria. Transposon delivery from a phage should alleviate this problem and allow complementation testing by a cloned gene in standard, commercially available expression vectors [e.g., pET-29a(+)]. Bacteriophage λ provides an efficient method of transposon delivery (4). We developed a mini-Tn10 transposon, λHS, and used a nonreplicative, phage-based delivery vehicle for genetic footprinting (Fig. 1C).
Our system relies on carrying out phage infection at a level sufficient to obtain a diverse population of mutants while limiting cell lysis that results from superinfection. To this end, infection at a multiplicity of infection equal to 1 was followed by addition of sodium citrate and CHL to suppress secondary infection and increase the abundance of insertion mutants, respectively. Without this selection we were unable to obtain a useful T15 profile (data not shown), and the low abundance of insertion mutants in the initial cell population did not allow a T0 comparator.
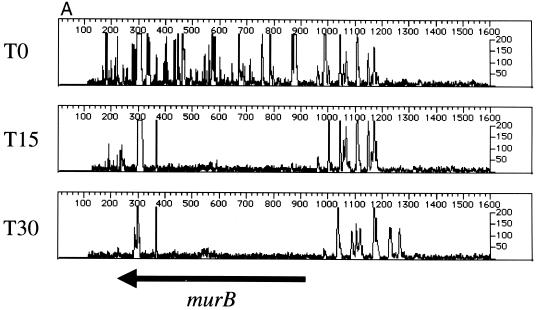
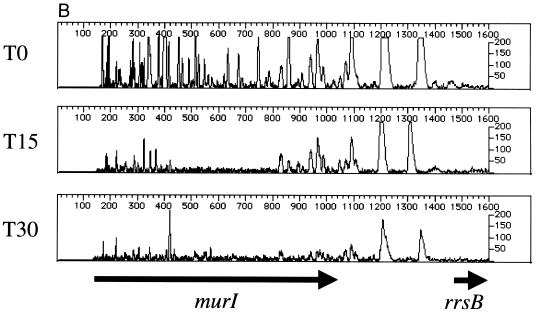
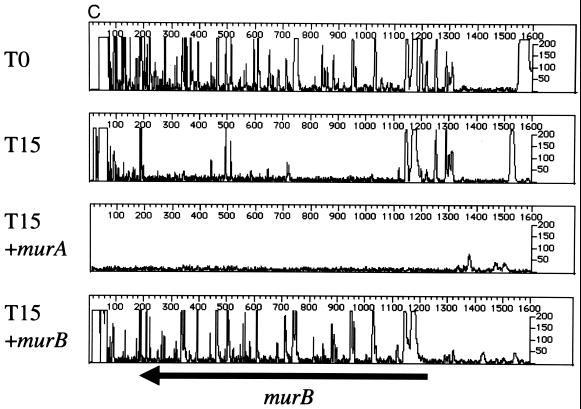
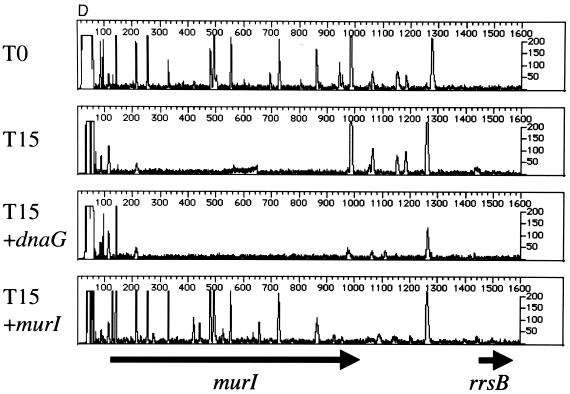
To validate the results of the phage delivery system, we first footprinted two known, essential genes in the murein biosynthesis pathway, murB (UDP-GlcNAc-enolpyruvate reductase) (17) and murI (glutamate racemase) (9), with the plasmid-based system described above. The results indicate that murB (Fig. 5A) and murI (Fig. 5B) are important for cell viability. We then footprinted the same genes using the phage-based delivery system. As in Fig. 5A and B, the primers designed for complementation testing (Table 1; see below) show a pattern indicative of a gene required for robust cell growth (T0 and T15 [Fig. 5C and D]). All primers used for complementation testing anneal to chromosomal DNA located outside the region of the gene contained in the plasmid. To provide a comparator mutant population and test a cloned gene for complementation, cells were mutagenized with λHS in the presence and absence of a plasmid expressing either murB or murI. We predicted that if recombinant versions of murB or murI, containing N- and C-terminal peptide tags, can complement insertion mutants in the chromosomal locus, then the footprint at the chromosomal locus, using gene-specific primers outside the region in the plasmid, should give the appearance of a nonessential gene. This was the case for murB (Fig. 5C). Expression of murA did not complement the effects of insertion mutations in murB. Figure 5D shows similar results for murI; expression of murI complemented the insertion mutations at the murI chromosomal locus, whereas dnaG did not.
FIG. 5.
Genetic footprinting and complementation testing using phage λ-mediated transposon delivery. The primers used for complementation testing (Table 1) anneal to a region of the subject gene outside of the open reading frame cloned into the expression vector. (A and B) murB and murI, using plasmid-mediated transposon delivery; (C) T0 and T15 cultures of murB mutagenized by the plasmid-delivered transposon, using primer murB R1, and murB mutagenized by the λHS-delivered transposon in the absence (+murA) or presence (+murB) of a complementing expression plasmid; (D) T0 and T15 cultures of murI mutagenized by the plasmid-delivered transposon, using primer murIL1, and murI mutagenized by the λHS-delivered transposon in the absence (+dnaG) or presence (+murI) of a complementing expression plasmid. Other features are as described in the legend to Fig. 2 and 3.
DISCUSSION
Genetic footprinting can be used on a genomewide scale for rapidly evaluating the importance of many genes to the growth or viability of the organism. Previous work demonstrated the feasibility and application of this technique in yeast (19, 20); we have extended this to the bacterium E. coli. A significant feature of genetic footprinting is the requirement for multiple random insertion events in each gene to be analyzed. To achieve this, we used a transposase with a relaxed target specificity (4). In addition, we have shown that transposon delivery for genetic footprinting can be accomplished from either a plasmid or a bacteriophage.
Two observations described in this work provide confirmation of our genetic footprint assessments and gene evaluation. First, due to the small size of some bacterial genes and the close proximity of genes in operons, it was often possible to obtain footprint information on two or three adjacent genes using a single primer. Thus, the data generated from a gene-specific primer gave a pattern consistent with a primer located within an adjacent gene, as shown in Fig. 2 to 4. Second, using the λ phage transposon delivery system, the genomic footprint pattern for two known essential genes could be complemented by expression of the cognate gene from a plasmid but not by an unrelated gene (Fig. 5).
Genetic footprinting provides a way to capitalize on the substantial experimental and bioinformatics knowledge base available for E. coli. Since many genes encoding proteins of unknown function have been identified in the complete genome sequence, footprinting offers a way to analyze even the subtle contribution of these genes to the fitness of the organism. This feature, along with the ability to detect functional associations of genes by common growth defects (decreased fitness) under different conditions, makes footprinting an attractive tool for genomics research. For example, the fitness of thousands of mutants can be readily compared under conditions such as high temperature, nutrient limitation, or drug addition. Alternatively, a small set of genes, such as the known or suspected members of a metabolic pathway, could be analyzed following growth under many different conditions. In any experimental scenario, once a selection has been applied and template DNA has been prepared, it is possible to assess the relative impact of insertion mutations in thousands of genes in a high-throughput manner. Thus, this technology enables rapid screening of genomes for candidate genes to test for functional relationships. Follow-up studies may involve performing individual gene disruptions to confirm the function of or genetic relationships within a specific group of genes. Furthermore, identification of new genes that play a significant role in the fitness of an organism is critical in the validation of novel targets for antimicrobial drug discovery.
Genetic footprinting whether by in vitro or, as described here, in vivo transposon delivery does have some potential limitations: difficulty in footprinting smaller genes (<400 bp) due to the lower number of transposition events per gene, potentially questionable footprinting resulting from genes in which production of a portion of the gene is sufficient to provide function, and an inability to assess the contribution of a gene that is duplicated or has a functional paralog. In addition, certain genes or regions may be “cold spots” for transposition or recombination in vivo. However, low insertion frequencies may be overcome by manipulating PCR conditions to enhance the appearance of peaks in a particular region. Despite these constraints, genetic footprinting is a robust method likely to be useful in studying the majority of the genetic complement of an organism.
The utility of genetic footprinting as an effective tool to aid in the assessment of the function of large numbers of genes has now been demonstrated in S. cerevisiae (19, 20) and in E. coli. The requirements to expand the adaptation of this technology, a complete genome sequence and a regulatable, random, and efficient transposon, are likely to be satisfied in other experimental systems.
ACKNOWLEDGMENTS
We thank George H. Miller and Gerald F. Vovis for support of this project, Eric R. Olson for helpful discussions, and Todd A. Black, Beth DiDomenico, and Paul M. McNicholas for critical reading of the manuscript.
Footnotes
This article is dedicated to the memory of Claire M. Berg, who advised us on the early stages of this project and was a dear mentor and friend.
REFERENCES
- 1.Akerley B J, Rubin E J, Camilli A, Lampe D J, Robertson H M, Mekalanos J J. Systematic identification of essential genes by in vitro mariner mutagenesis. Proc Natl Acad Sci USA. 1998;95:8927–8932. doi: 10.1073/pnas.95.15.8927. [DOI] [PMC free article] [PubMed] [Google Scholar]
- 2.Andrews S C, Guest J R. Nucleotide sequence of the gene encoding the GMP reductase of Escherichia coli K12. Biochem J. 1988;255:35–43. doi: 10.1042/bj2550035. [DOI] [PMC free article] [PubMed] [Google Scholar]
- 3.Balbas P, Alexeyev M, Shokolenko I, Bolivar F, Valle F. A pBRINT family of plasmids for integration of cloned DNA into the Escherichia coli chromosome. Gene. 1996;172:65–69. doi: 10.1016/0378-1119(96)00028-5. [DOI] [PubMed] [Google Scholar]
- 4.Bender J, Kleckner N. IS10 transposase mutations that specifically alter target site recognition. EMBO J. 1992;11:741–750. doi: 10.1002/j.1460-2075.1992.tb05107.x. [DOI] [PMC free article] [PubMed] [Google Scholar]
- 5.Bender J, Kleckner N. Tn10 insertion specificity is strongly dependent upon sequences immediately adjacent to the target-site consensus sequence. Proc Natl Acad Sci USA. 1992;89:7996–8000. doi: 10.1073/pnas.89.17.7996. [DOI] [PMC free article] [PubMed] [Google Scholar]
- 6.Conrad S E, Dussik K T, Siegel E C. Bacteriophage Mu-1-induced mutation to mutT in Escherichia coli. J Bacteriol. 1976;125:1018–1023. doi: 10.1128/jb.125.3.1018-1023.1976. [DOI] [PMC free article] [PubMed] [Google Scholar]
- 7.Davis R W, Botstein D, Roth J R. A manual for genetic engineering: advanced bacterial genetics. Cold Spring Harbor, N.Y: Cold Spring Harbor Laboratory; 1980. [Google Scholar]
- 8.de Boer H A, Comstock L J, Vasser M. The tac promoter: a functional hybrid derived from the trp and lac promoters. Proc Natl Acad Sci USA. 1983;80:21–25. doi: 10.1073/pnas.80.1.21. [DOI] [PMC free article] [PubMed] [Google Scholar]
- 9.Doublet P, van Heijenoort J, Bohin J P, Mengin-Lecreulx D. The murI gene of Escherichia coli is an essential gene that encodes a glutamate racemase activity. J Bacteriol. 1993;175:2970–2979. doi: 10.1128/jb.175.10.2970-2979.1993. [DOI] [PMC free article] [PubMed] [Google Scholar]
- 10.Freedman L P, Zengel J M, Archer R H, Lindahl L. Autogenous control of the S10 ribosomal protein operon of Escherichia coli: genetic dissection of transcriptional and posttranscriptional regulation. Proc Natl Acad Sci USA. 1987;84:6516–6520. doi: 10.1073/pnas.84.18.6516. [DOI] [PMC free article] [PubMed] [Google Scholar]
- 11.Hazelbauer G L. Maltose chemoreceptor of Escherichia coli. J Bacteriol. 1976;122:206–214. doi: 10.1128/jb.122.1.206-214.1975. [DOI] [PMC free article] [PubMed] [Google Scholar]
- 12.Horton R M, Hunt H D, Ho S N, Pullen J K, Pease L R. Engineering hybrid genes without the use of restriction enzymes: gene splicing by overlap extension. Gene. 1989;77:61–68. doi: 10.1016/0378-1119(89)90359-4. [DOI] [PubMed] [Google Scholar]
- 13.Jensen K F. The Escherichia coli K-12 “wild types” W3110 and MG1655 have an rph frameshift mutation that leads to pyrimidine starvation due to low pyrE expression levels. J Bacteriol. 1993;175:3401–3407. doi: 10.1128/jb.175.11.3401-3407.1993. [DOI] [PMC free article] [PubMed] [Google Scholar]
- 14.Kleckner N, Bender J, Gottesman S. Uses of transposons with emphasis on Tn10. Methods Enzymol. 1991;204:139–180. doi: 10.1016/0076-6879(91)04009-d. [DOI] [PubMed] [Google Scholar]
- 15.Metcalf W W, Wanner B L. Mutational analysis of an Escherichia coli fourteen-gene operon for phosphonate degradation, using TnphoA elements. J Bacteriol. 1993;175:3430–3432. doi: 10.1128/jb.175.11.3430-3442.1993. [DOI] [PMC free article] [PubMed] [Google Scholar]
- 16.Pogliano J A, Beckwith J. SecD and SecF facilitate protein export in Escherichia coli. EMBO J. 1994;13:554–561. doi: 10.1002/j.1460-2075.1994.tb06293.x. [DOI] [PMC free article] [PubMed] [Google Scholar]
- 17.Pucci M J, Discotto L F, Dougherty T J. Cloning and identification of the Escherichia coli murB DNA sequence, which encodes UDP-N-acetylenolpyruvoylglucosamine reductase. J Bacteriol. 1992;174:1690–1693. doi: 10.1128/jb.174.5.1690-1693.1992. [DOI] [PMC free article] [PubMed] [Google Scholar]
- 18.Reich K A, Chovan L, Hessler P. Genome scanning in Haemophilus influenzae for identification of essential genes. J Bacteriol. 1999;181:4961–4968. doi: 10.1128/jb.181.16.4961-4968.1999. [DOI] [PMC free article] [PubMed] [Google Scholar]
- 19.Smith V, Botstein D, Brown P O. Genetic footprinting: a genomic strategy for determining a gene's function given its sequence. Proc Natl Acad Sci USA. 1995;92:6479–6483. doi: 10.1073/pnas.92.14.6479. [DOI] [PMC free article] [PubMed] [Google Scholar]
- 20.Smith V, Chou K N, Lashkari D, Botstein D, Brown P O. Functional analysis of the genes of yeast chromosome V by genetic footprinting. Science. 1996;274:2069–2074. doi: 10.1126/science.274.5295.2069. [DOI] [PubMed] [Google Scholar]
- 21.Studier F W, Moffatt B A. Use of bacteriophage T7 RNA polymerase to direct selective high-level expression of cloned genes. J Mol Biol. 1986;189:113–130. doi: 10.1016/0022-2836(86)90385-2. [DOI] [PubMed] [Google Scholar]
- 22.Trieu-Cuot P, Poyart-Salmeron C, Carlier C, Courvalin P. Nucleotide sequence of the erythromycin resistance gene of the conjugative transposon Tn1545. Nucleic Acids Res. 1990;18:3660. doi: 10.1093/nar/18.12.3660. [DOI] [PMC free article] [PubMed] [Google Scholar]
- 23.Wyman A R, Wolfe L B, Botstein D. Propagation of some human DNA sequences in bacteriophage lambda vectors requires mutant Escherichia coli hosts. Proc Natl Acad Sci USA. 1985;82:2880–2884. doi: 10.1073/pnas.82.9.2880. [DOI] [PMC free article] [PubMed] [Google Scholar]


