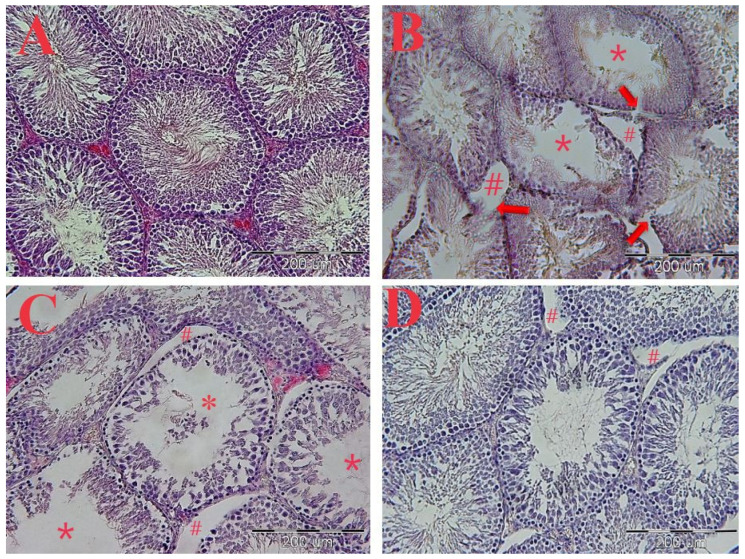
Figure 7.
The effects of PO extract on the H&E staining of the transverse section of testicular tissue. (A) Control, (B) diabetic, (C) PO extract (100 mg/kg), and (D) PO extract (300 mg/kg). Microscopic view with magnification (20×) of the cross-section of testicular tissue. (A) Sham group: spermatogenic tubes with normal structural and cellular order. (B) Control group: geometric deformation of tubules, disintegration and rupture of the epithelium of spermatogenic tubules (arrows), reduction of spermatozoid population (*), increase in the distance between tubules, and atrophy and destruction of interstitial cells (Leydig) (#). (C) Treatment group with a dose of 100 mg/kg: The decrease in the density of spermatogenic cells is obvious, and there is a decrease in the number of sperm cells (*) and an increase in the distance between tubules (#). (D) treatment group with a dose of 300 mg/kg: a slight increase in the distance between tubules.

