

Abstract
Executive function (EF) is critical to everyday life, but it can be undermined by adverse psychological states like stress and negative affect. For example, inadequate time to perform a task is a common stressor that can disrupt EF. Although the impact of actual time pressure on EF has been established, little is known about how self-generated, perceived time pressure (PTP) affects EF in the absence of objective time limits. We chose Eriksen’s Flanker task as an index of cognitive inhibition, a key component of EF, and we varied the interval between successive trials, the inter-trial interval (ITI), to proxy PTP. This manipulation strongly impacted task performance: shrinking the ITI to increase PTP diminished cognitive inhibition and increased both stress and negative affect. Subsequently lengthening the ITI to decrease PTP reversed nearly all of these effects, except stress, which persisted. Multilevel linear regression modeling revealed that ITI and stress predicted inhibition, and exploratory mediation modeling suggested that stress mediates the relationship between ITI and inhibition. These findings validate perceived time pressure as an empirical stressor and demonstrate EF’s sensitivity to changes in PTP.
Keywords: Perceived time pressure, Inter-trial interval, Executive function, Cognitive inhibition, Stress, Negative affect
1. Introduction
The processes that constitute executive function (EF) influence how we operate in everyday life. One of these processes, inhibition, is responsible for our ability to prioritize goal-relevant information while discounting irrelevant or distracting information (Diamond, 2013; Shields et al., 2016). There are two types of inhibition, response and cognitive: response inhibition refers to the processes involved in preventing prepotent responses, while cognitive inhibition reflects interference control (i.e. selectively attending to and ignoring information; Shields et al., 2016). Cognitive inhibition can be compromised by adverse psychological states like stress (Diamond, 2013; Shields et al., 2016; Snyder et al., 2015), perhaps through the redistribution of cognitive resources away from a task at hand and towards coping with a stressor instead (Diamond, 2013; Hockey, 1997; Mendl, 1999; Plieger & Reuter, 2020; Shields et al., 2016; Steinhauser et al., 2007; van Moorselaar & Slagter, 2020; Vogel et al., 2016).
One well known stressor is the pressure of limited time (Caviola et al., 2017; De Paola & Gioia, 2016; Gok & Atsan, 2016; Maule et al., 2000; Maule & Hockey, 1993; Orbach et al., 2020; Zakay, 1993; Zuzanek, 1998). Given how often this stressor is experienced, it has received surprisingly little attention from researchers. One reason may be that time pressure is complex, actually composed of two distinct components. One component can be described as “objective,” meaning that it reflects an actual limit on the time available to perform a task. An example would be the pressure from a deadline defined in clock time (e. g., Dambacher & Hübner, 2015). The subjective counterpart of time pressure has been even less studied. This aspect, which we term perceived time pressure (hereafter, PTP) refers to the sense of time pressure experienced in the absence of genuine time limits (Zakay, 1990, 1993). An example might be the unfounded belief that an impending deadline is closer than it really is (e.g., Sun & Sekuler, 2021). Interestingly, PTP can be induced merely by encouraging somebody to think about the passage of time, even when time is not relevant to the task at hand (DeDonno & Demaree, 2008; Zakay, 1990). We set out to understand if PTP alone (1) induces a psychological stress response and (2) impacts cognitive inhibition.
For answers, we manipulated PTP by altering the length of the inter-trial interval (ITI), the time between successive trials in an experiment (Sun & Sekuler, 2021). This manipulation was meant to increase participants’ awareness of the task’s global pace without affecting the duration of individual trials or the time available for decision-making (Zakay, 1990). In other words, our manipulation did not impact any aspect of the trials themselves: stimulus duration and response windows were held constant throughout the experiment. Therefore, any time pressure arising from this manipulation of the ITI can be understood as unnecessary and self-generated rather than a result of a change in the task itself. This reflects perceived, not objective, time pressure (Zakay, 1990).
Throughout our project we use ITI duration as a proxy for PTP. We make no commitment to the exact form of the relationship between ITI and PTP, other than that they are monotonically related.
2. Methods
2.1. Participants
Ninety-five Brandeis University undergraduate students between the ages of 18 and 35 years old participated in this study in exchange for course credit. All experimental procedures were approved by Brandeis University’s Committee for the Protection of Human Subjects, and all work was conducted in accordance with the Declaration of Helsinki. All participants provided informed consent. A power analysis using the pwr package in R (Champely et al., 2018) confirmed the adequacy of our sample size. The analysis showed that 40 participants would be sufficient to detect a significant effect of ITI on inhibition with 80% power in the regression model we planned.
Data from 18 participants were excluded: eight because of incomplete data, three because of software failures, five because for the experiment, which was conducted online, they used a web browser with suboptimal temporal precision (Bridges et al., 2020), and two because of consistently low accuracy (below 50%). This left usable data from 77 participants (mean age = 19.19 years, SD age = 1.26 years). Of these participants, 52 were female, and three did not identify as either female or male (two non-binary/genderqueer, one not sure/unknown).
2.2. Measures
Apparatus and stimuli.
The experimental task was coded in PsychoPy (v.2.4), and run online through the Pavlovia server (Pavlovia, 2020; Peirce et al., 2019). The experiment also used questionnaires that were hosted on the Qualtrics platform (Qualtrics, 2020). Because of restrictions imposed by the COVID-19 pandemic, all testing was conducted online. To make different participants’ testing environments as alike as possible, we adopted techniques that measured and then compensated for variation in participants’ screen sizes and viewing distances. First, to take account of the dimensions of each participant’s computer display, participants adjusted an image of a mock student ID card on the screen to match their physical Brandeis University student ID card (8.6 cm wide and 5.4 cm tall; Morys-Carter, 2020). Next, each participant’s viewing distance was estimated by a routine that located their blind spot relative to their screen width (Li et al., 2020). These measures of screen size and viewing distance allowed PsychoPy to scale task-related stimuli to the same size in degrees of visual angle (°) for all participants. After completing these calibration procedures, participants were repeatedly encouraged to remain seated in their same position for the rest of the experiment.
Task.
To measure cognitive inhibition, we used Eriksen’s Flanker task (Diamond, 2013; Eriksen & Eriksen, 1974; Shields et al., 2016). This task offers high test-retest reliability and construct validity (Zelazo et al., 2014). In our implementation of the Flanker task, participants saw five horizontally aligned arrow heads (< or >), and judged the direction in which the middle arrowhead pointed, left or right. The arrowheads were black against a middle grey background. We call the middle arrowhead the “Target,” and the four arrowheads surrounding it the “Flankers.” On half of the trials, the Flanker and Target arrowheads pointed in the same direction (hereafter, Congruent; < < < < < or > > > > >). On the remaining trials, the Flanker and Target arrowheads pointed in opposite directions (hereafter, Incongruent; > > < > > or < < > < <). Presentations of Congruent and Incongruent stimuli were randomly interleaved throughout the experiment. Each arrowhead was 1° visual angle wide, and neighboring arrowheads were separated 1.25° visual angle center-to-center, making the entire horizontal array 6° wide, as in Lange-Malecki and Treue (2012).
On Incongruent trials, a correct response to the Target direction required participants to override the contradictory influence from the Flanker arrows, and base a decision on information from the Target arrow only. The need for such suppression is why performance on this task reflects cognitive inhibition. To calculate our index of cognitive inhibition, the Flanker effect, for each block of trials we subtracted participants’ mean accuracy on Incongruent trials from their mean accuracy on Congruent trials. This means that a higher Flanker effect indicates worse cognitive inhibition (e.g. Berggren & Derakshan, 2013; Lange-Malecki & Treue, 2012; Pacheco-Unguetti et al., 2010; Shields et al., 2016). Generally speaking, the speed of individual responses is sensitive to the overall tempo of an experiment (Ellis & Jones, 2010), which complicates the interpretation of response speed in our study. This is why we calculated the Flanker effect using response accuracy only.
An onscreen text display reminded participants to use the computer’s keyboard to communicate judgements of the Target’s direction and press the “f” key if the middle, Target arrowhead pointed to the left (<) and the “j” key if the middle, Target arrowhead pointed to the right (>). Note that stimulus-response compatibility was promoted by mapping a key on the keyboard’s left side to the response for a “left” Target arrowhead and a key on the keyboard’s right side to a “right” Target arrowhead (Bächtold et al., 1998).
Trial structure.
Every participant served in four blocks of trials of 192 trials each (96 Congruent and 96 Incongruent). First, ITIs decreased, to promote increased PTP, and then ITIs increased, to promote decreased PTP. Specifically, ITIs decreased over the first three blocks of trials, from 2 s in the first block to 1.25 s in the second block, and then finally 0.5 s in the third block. Then, ITIs returned to their initial value of 2 s in the fourth and final block. This selection of ITI values was established during pilot testing to produce a range of accuracies that spanned from chance (50%) to ceiling (100%) performance. Participants were told, “You will have less than a second to make each decision, and you should respond as quickly and accurately as possible. If you don’t respond in time, your decision will be marked as incorrect.” At the start of testing, participants completed 24 practice trials with a constant ITI of 2 s. After each block of trials, participants were instructed to set a one-minute timer and rest for that duration. To preserve statistical power within the limits of our available sample size, we did not counterbalance these ITI levels across participants.
To strengthen their possible influence, the four Flanker arrowheads appeared on the screen first, before the central Target arrowhead (Lange-Malecki & Treue, 2012). Then, after a random interval of 95, 100, or 105 ms, the Target arrowhead appeared. All five arrowheads disappeared together 200 ms later, after which participants were allowed up to 450 ms to register their judgement. Right after their response, participants received feedback about their accuracy for 300 ms. Following correct responses, the word “Correct” was displayed in green on the screen along with the pleasant “ding” sound commonly associated with success in video games. Following incorrect responses or the failure to respond in time, the text “Wrong.” was displayed in red along with an unpleasant buzzer sound that is commonly associated with failure in video games. We included these gamelike elements to promote task engagement and motivation (Miranda & Palmer, 2014). To calibrate the volume of the auditory feedback, at the beginning of the experiment participants were instructed to toggle their computer’s volume until the sound was at a comfortable audible level.
2.3. Ancillary measures
In order to link behavioral performance with psychological states, we periodically sampled participant’s feelings of stress and negative affect. We took both measures because of accumulating evidence suggesting that these two variables interact to impact EF (e.g. Finy et al., 2014; Qi & Gao, 2020; Vinski & Watter, 2013).
Stress.
Participants rated their subjective feelings of stress on an eight-point Likert scale (from 0 to 7; Sun & Sekuler, 2021). These ratings will be referred to hereafter as Likert Stress Scale (LSS) responses. As the autonomic nervous system’s sympathetic stress response peaks in the immediate aftermath of a stressor (Plieger & Reuter, 2020), LSS responses were collected before the start of the experiment and after each block of trials.
Negative Affect.
To measure negative affect, participants completed a short-form version of the Positive and Negative Affect Schedule, which has high convergent validity and test-retest reliability (PANAS; Thompson, 2007; Crawford & Henry, 2004). The negative affect component of this inventory asks participants to rate the extent that they’re experiencing the following feelings on a five-point Likert scale: “afraid”, “nervous”, “upset”, “hostile”, and “ashamed”. This test was completed before block 1, after the highest PTP condition (shortest ITI, block 3), and finally after the lowest PTP condition (longest ITI, block 4).
3. Results
Our analyses examined the relationships among ITI, cognitive inhibition, stress, and negative affect. As explained earlier, we measured cognitive inhibition with the Flanker effect (accuracy on Congruent trials minus accuracy on Incongruent trials) from the Flanker task, stress with a Likert scale (LSS), and negative affect with the PANAS inventory. The analyses used several packages in R (version 4.0.3; R Core Team, 2020), including tidyverse (Wickham et al., 2019), ez (Lawrence & Lawrence, 2016), lme4 (Bates et al., 2015) and mediation (Tingley et al., 2014). Coding and execution were done in RStudio’s integrated development environment (version 1.3.1093; RStudio Team, 2020).
We present three complimentary perspectives on our results. First, we describe how the ITI influences the Flanker task’s accuracy and response time. Second, we present a linear mixed effects regression model showing how ITI impacts the Flanker effect, stress, and negative affect while controlling for age and gender. Even though our age range was narrow, we controlled for age because considerable neurodevelopment occurs during the age range of our sample (e.g. Luciana, 2013). Finally, we present exploratory mediation models that assess if ITI’s impact on cognitive inhibition is related to stress. Ultimately, these analyses show that changing the ITI affects cognitive inhibition, and that stress mediates this relationship.
Data preparation.
To account for participants’ adjustments to changing ITIs, the first five trials at the start of each block were excluded from analysis. Overall, participants failed to respond within the allowed time limit (450 ms after the arrowheads disappeared) on only 3.84% of all trials; these trials were excluded from analysis. A two-way ANOVA showed that the number of missed trials varied with the trial’s Congruency (F(1, 76) = 43.41, p < .001) and block (ITI; F(3, 228) = 3.77, p = .014), as well as their interaction (F(3, 228) = 7.39, p < .001), such that responses were disproportionately missed on Incongruent trials and during the first block of testing. For each participant and condition, we derived two dependent measures from the Flanker task: the mean percent correct responses (accuracy) and the mean response time on correct trials. The Flanker effect was then calculated as the difference in accuracy across Congruent and Incongruent trials.
3.1. ITI, accuracy, and response time
Fig. 1 shows how variation in the ITI impacts Flanker task accuracy and response time. At each ITI in Panel A, we see a strong Flanker effect, that is, accuracy with Congruent stimuli is well above that for Incongruent stimuli. Additionally, in Panel B, response times to Incongruent stimuli are longer than response times to Congruent stimuli.
Fig. 1.
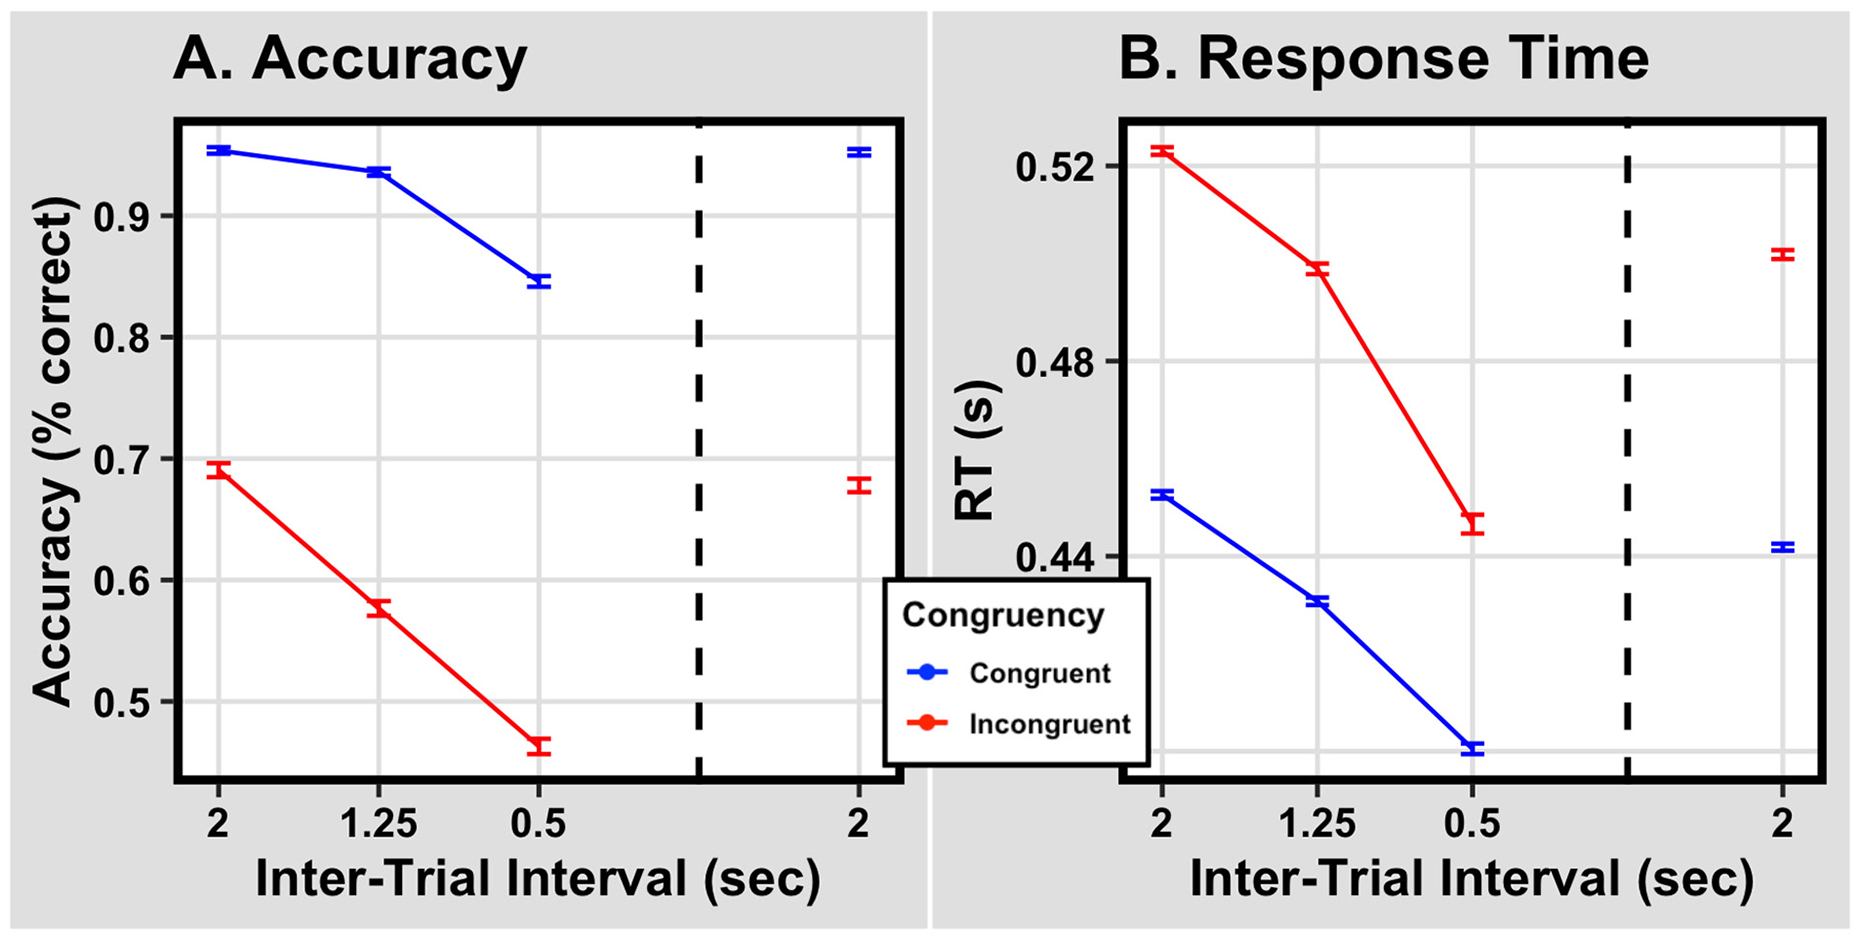
Panel A. Mean response accuracy as a function of ITI in successive blocks of trials. Note that ITI decreases over Blocks 1–3 and resumes its original value for Block 4. The dashed vertical line separates blocks over which ITI is decreasing from the block in which the original ITI has been restored. Results from Congruent trials are shown in blue; results from Incongruent trials are shown in red. Error bars extend one within-subject standard error above and below condition means. Panel B. Mean response times on correct trials shown in the same format as in Panel A.
Analysis for Blocks 1 to 3.
As ITI decreases from 2 s to 0.5 s, response accuracy to each type of stimulus declines, and response time to both types of stimuli decreases as well. Importantly, Panel A shows that with decreasing ITI, the gap between the two accuracy curves grows: in other words, that the size of the Flanker effect increases. Relatedly, Panel B shows that with decreasing ITI, the gap between the two response time curves shrinks; taken together with Panel A, this suggests that as the ITI quickens, participants prioritize speed more than accuracy for Incongruent trials.
A pair of two-way within-subjects ANOVAs examined performance across Blocks 1 to 3, when ITI was shrinking from 2 s to 0.5 s. One ANOVA, on accuracy data, is summarized in Table 1A, the other, on response times, is summarized in Table 1B. The effects represented in the ANOVAs were ITI, the time separating successive trials, and Congruency, the type of stimulus, Congruent or Incongruent. There were both main effects and a significant interaction between ITI and Congruency.
Table 1.
ANOVAs on results from Blocks 1–3.
| Effect | df’s | F value | p | η 2 |
|---|---|---|---|---|
| A: Accuracy | ||||
| ITI | 2, 152 | 104.40 | <.001 | 0.58 |
| Congruency | 1, 76 | 548.00 | <.001 | 0.88 |
| ITI × Congruency | 2, 152 | 15.49 | <.001 | 0.17 |
| B: Response time | ||||
| ITI | 2, 152 | 60.74 | <.001 | 0.44 |
| Congruency | 1, 76 | 393.90 | <.001 | 0.84 |
| ITI × Congruency | 2, 152 | 29.66 | <.001 | 0.28 |
Restoration of the long ITI: Comparing Blocks 1 and 4.
In the experiment’s fourth and final block, the ITI was restored to its original value. We were interested in whether this would restore performance to its original level as well. To test this, we used paired t -tests. One paired t -test revealed that accuracy did not differ reliably between the two blocks: Block 1 (M = 0.82, SD = 0.11) and Block 4 (M = 0.81, SD = 0.14; t(76) = 0.78, p = .439, d = 0.09). This approximate equivalence can be seen in Fig. 1 by comparing the leftmost and rightmost data points for each Congruency condition. The analogous analysis for response times told a different story. Mean response times in Block 1 tended to be longer than those in Block 4 (M = 0.48 s, SD = 0.04, M = 0.46, SD = 0.04, respectively; t (76) = 4.02, p < .001, d = 0.46). This relationship held for both Congruent and Incongruent trials (Congruent trials: MBlock1 = 0.45, SDBlock1 = 0.04, MBlock4 = 0.44, SDBlock4 = 0.04, t (76) = 3.17, p = .002, d = 0.36; Incongruent trials MBlock1 = 0.52, SDBlock1 = 0.05, MBlock4 = 0.50, SDBlock4 = 0.05, t(76) = 4.79, p < .001, d = 0.55).
Discussion.
These results show that changing ITI strongly impacts both accuracy and response time. Assuming that reduced ITI increases PTP, these effects of changing ITI are consistent with the idea that PTP can influence task performance on a task of cognitive control.
The significant interaction effects in the ANOVAs carry particular theoretical importance, as they inform the ITI’s impact on the Flanker effect (the difference between Congruent and Incongruent trials), our measure of cognitive inhibition. We found in particular that the Flanker effect grows as the ITIs decrease and then shrinks as the ITIs increase. Fig. 1 suggests that this change in the Flanker effect arises from the ITI’s disproportionate effect on Incongruent trials. This finding supports the idea that increasing PTP not only globally undermines performance, but also diminishes the cognitive inhibition required to filter out the distracting Flanker arrowheads (on Incongruent trials).
3.2. Multilevel linear regression analysis
Regressions on cognitive inhibition.
We used multilevel linear regressions to characterize the amount that cognitive inhibition (the Flanker effect, as characterized by accuracy on Incongruent trials subtracted from accuracy on Congruent trials) depended on ITI, stress, and negative affect while controlling for age and gender.
Fig. 2 shows that decreasing ITI (Blocks 1 and 3) and then increasing it (Blocks 3 and 4) impacts cognitive inhibition (the Flanker effect), stress, and negative affect. Shortening the ITI has two kinds of effects: it decreases cognitive inhibition, as shown by the increased Flanker effect (Fig. 2A), while it increases both stress (Fig. 2c) and negative affect (Fig. 2E). Conversely, restoring the ITI to its original longer value reverses these effects (Fig. 2B, D, and F), completely for both cognitive inhibition and negative affect (as shown below).
Fig. 2.
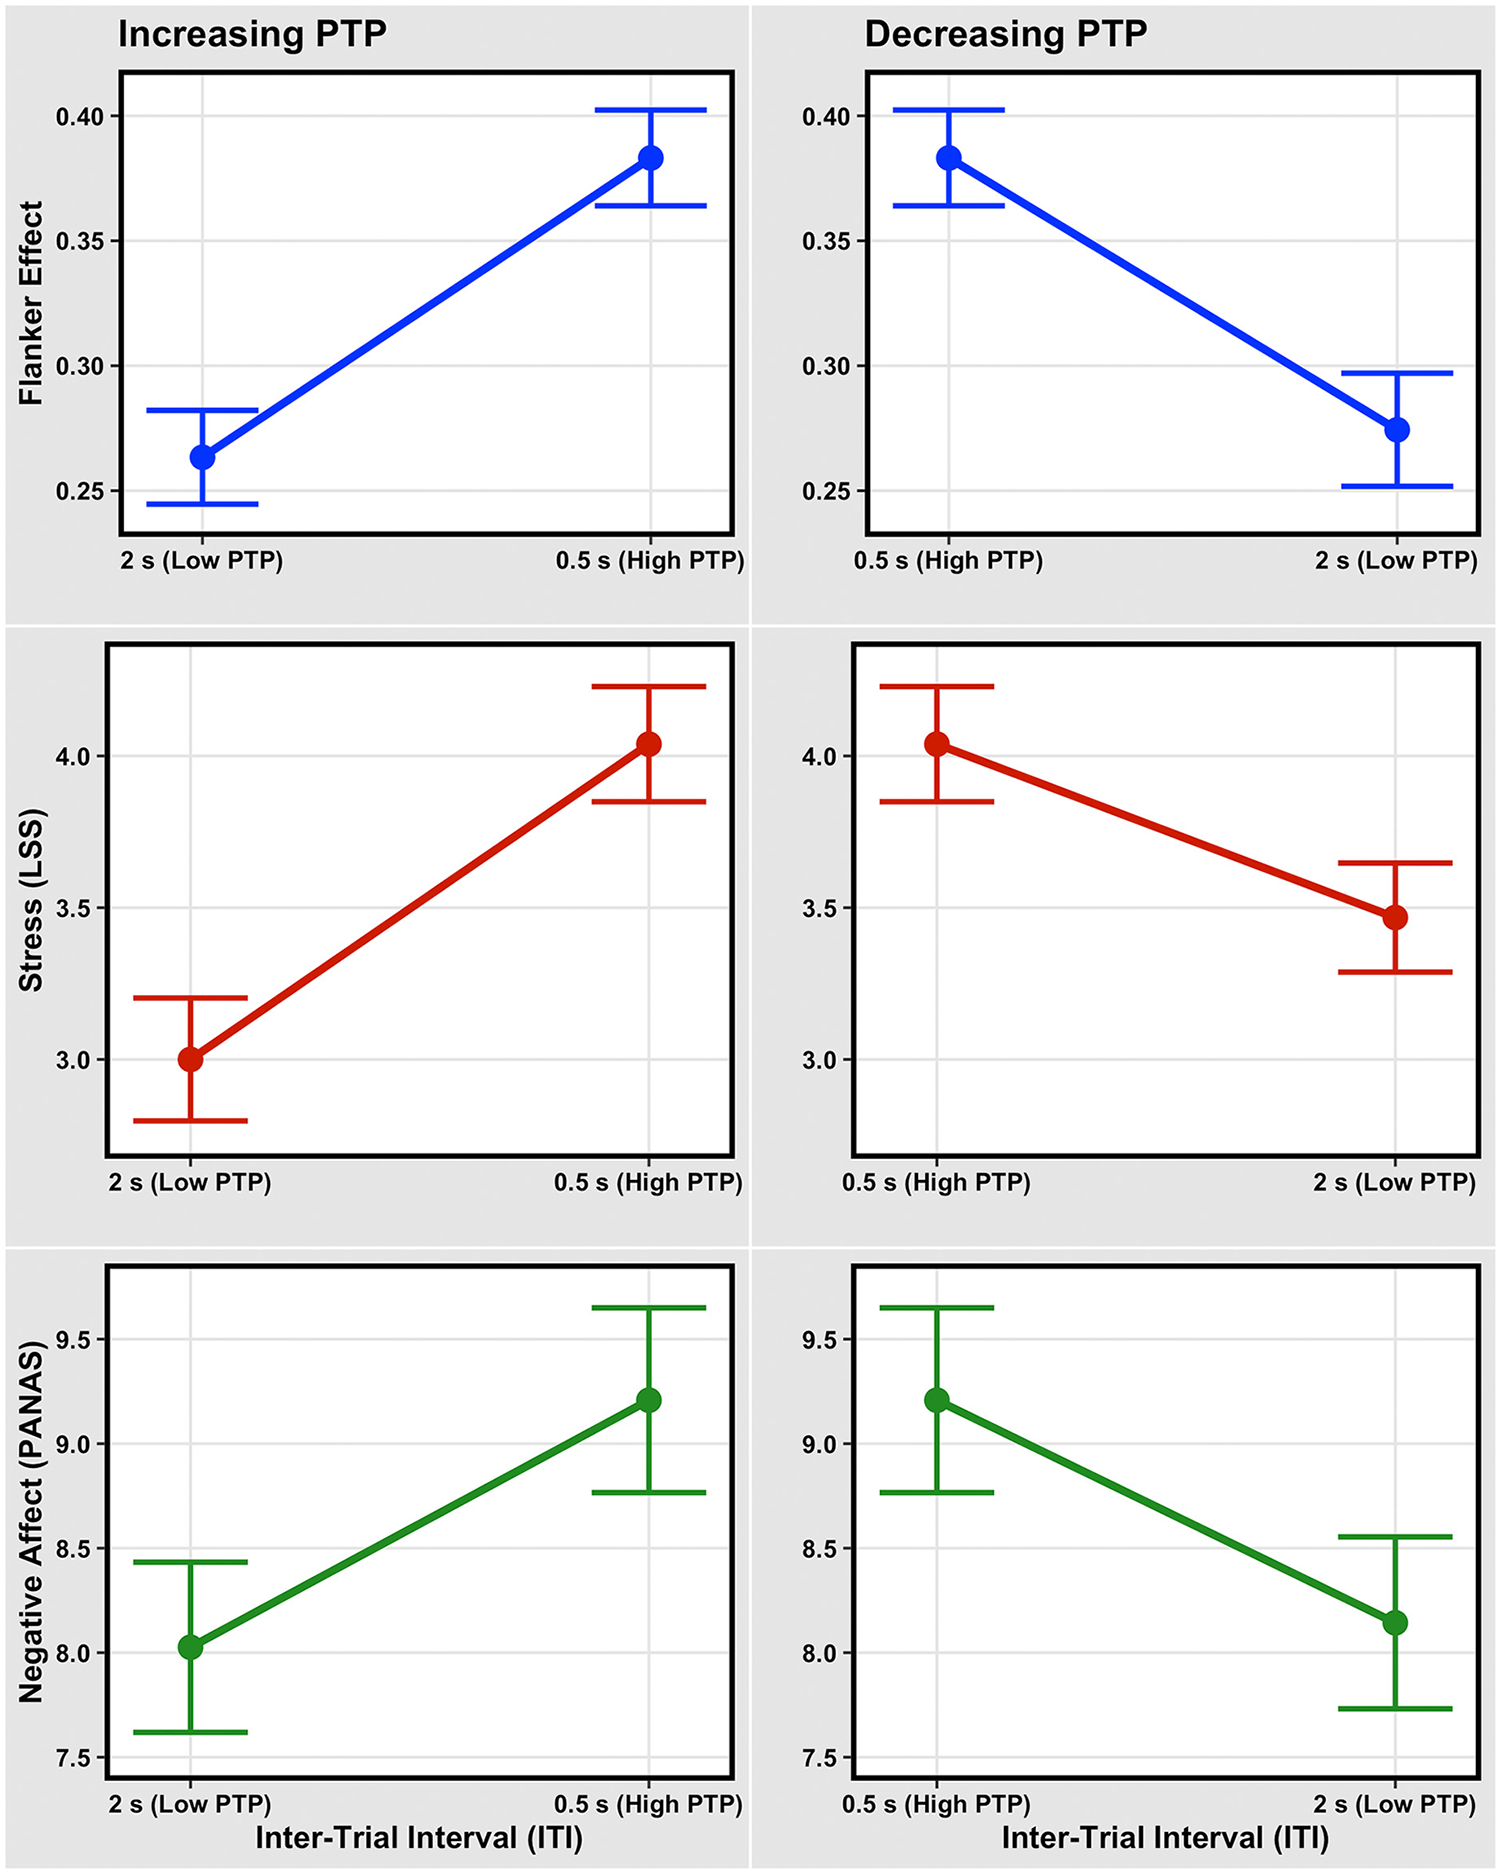
Panels A, C, and E depict the mean effects of decreasing ITI (increasing PTP; Block 1 to Block 3) on cognitive inhibition (the Flanker effect), stress, and negative affect. Panels B, D, and F depict the mean effects of increasing ITI (decreasing PTP; Block 3 to Block 4) on cognitive inhibition, stress, and negative affect. In all panels, error bars represent plus and minus one within-subject standard error. Note that the changes in the Flanker effect, stress, and negative affect are not equal in size.
A pair of regression analyses explored if the ITI, stress, negative affect, and the interaction between the latter two predicted changes in cognitive inhibition (the Flanker effect). The first regression examined the effects associated with a decrease in ITI from 2 s to 0.5 s (Block 1 to Block 3), and the second regression examined the effects with an increase in ITI from 0.5 s to 2 s (Block 3 to Block 4). Note that the difference between the ITIs was the same (1.5 s) for both regressions, but opposite in sign, facilitating comparisons across the two models. The model output is summarized in Table 2 for decreasing ITI (from Block 1 to Block 3), and in Table 3 for increasing ITI (from Block 3 to Block 4). Compared with the null model in Eq. (1), the full model for decreasing ITI as shown in Eq. (2) produced the superior fit (AICnull = 423.97, AICfull = 422.07, χ2(7) = 15.88, p = .026).
Table 2.
Multilevel linear regression results of the Flanker effect following a 1.5 second decrease in ITI. Estimates are standardized β coefficients. Gender effects are expressed relative to the female group. SE = standard error; LL = lower limit; UL = upper limit.
| Effect | Estimate | SE | 95 % LL | 95 % UL | p |
|---|---|---|---|---|---|
| Intercept | 1.31 | 1.22 | −0.989 | 3.61 | .284 |
| Inter-trial interval (ITI) | 0.541 | 0.148 | 0.254 | 0.832 | <001 |
| Stress | 0.188 | 0.096 | 0.002 | 0.370 | .053 |
| Negative affect | 0.098 | 0.108 | −0.107 | 0.307 | .367 |
| Stress * negative affect | −0.032 | 0.078 | −0.180 | 0.116 | .681 |
| Age | −0.077 | 0.063 | −0.197 | 0.043 | .229 |
| Gender (male) | −0.246 | 0.176 | −0.579 | 0.087 | .167 |
| Gender (non-binary/genderqueer) | −0.693 | 0.501 | −1.64 | 0.256 | .171 |
| Gender (not sure/unknown) | 0.081 | 0.697 | −1.24 | 1.40 | .908 |
Table 3.
Multilevel linear regression results of the Flanker effect following a 1.5 second increase in ITI. Estimates are standardized β coefficients. Gender effects are expressed relative to the female group. SE = standard error; LL = lower limit; UL = upper limit.
| Effect | Estimate | SE | 95 % LL | 95 % UL | p |
|---|---|---|---|---|---|
| Intercept | 0.459 | 1.23 | −1.87 | 2.79 | .711 |
| Inter-trial interval (ITI) | −0.489 | 0.154 | −0.789 | −0.188 | .002 |
| Stress | 0.223 | 0.090 | 0.050 | 0.392 | .014 |
| Negative affect | 0.050 | 0.093 | −0.125 | 0.230 | .589 |
| Stress * negative affect | −0.036 | 0.067 | −0.164 | 0.091 | .590 |
| Age | −0.012 | 0.064 | −0.134 | 0.109 | .851 |
| Gender (male) | 0.094 | 0.181 | −0.248 | 0.435 | .605 |
| Gender (non-binary/genderqueer) | −0.267 | 0.506 | −1.22 | 0.690 | .599 |
| Gender (not sure/unknown) | 1.01 | 0.711 | −0.340 | 2.35 | .162 |
| (1) |
| (2) |
Table 2 shows that with a 1.5 second decrease in ITI from Block 1 to Block 3 (to proxy increasing PTP), ITI explained significant variance in the Flanker effect (p < .001), while stress explained a borderline amount of variance in the Flanker effect (p = .053). In contrast, neither negative affect nor the interaction between stress and negative affect explained appreciable variance in the Flanker effect.
Similarly, as shown in Table 3, while ITIs were increasing (to proxy decreasing PTP), ITI again accounted for significant variance in the Flanker effect (p = .002), as did stress (p = .014), while neither negative affect nor the interaction between stress and negative affect explained significant variance in the Flanker effect.
Regressions on stress and negative affect.
Considering the impacts of ITI on the ancillary measures alone, decreasing ITIs (increasing PTP) worsened stress (β = .579, t (76) = 5.10, p < .001) and negative affect (β = .314, t (76) = 2.86, p = .005). Conversely, increasing ITIs (decreasing PTP) improved stress (β = − .348, t (76) = −3.29, p = .002) and negative affect (β = − .282, t (76) = −3.56, p < .001).
Lingering effects of PTP.
The Flanker effect during blocks 1 (M = 0.26, SD = 0.16) and 4 (M = 0.27, SD = 0.20) did not differ (t (76) = −0.55, p = .581, d = 0.06); the same is true for negative affect in Blocks 1 (M = 8.03, SD = 3.57) and 4 (M = 8.14, SD = 3.61; t (76) = −0.318, p = .752, d = 0.04). However, stress was elevated in Block 4 (M = 3.47, SD = 1.58) compared to Block 1 (M = 3.00, SD = 1.78; t (76) = −2.34, p = .022, d = 0.27), showing that the ITI’s effect on stress continued for some time after the ITI level was reset.
Discussion.
These analyses explored the relationships between ITI, cognitive inhibition, stress, and negative affect. The first set of analyses show that cognitive inhibition, as indexed by the Flanker effect (Congruent accuracy minus Incongruent accuracy), can be predicted by increasing and decreasing ITI as well as stress, but not negative affect or the interaction between stress and negative affect. Since PTP is approximated by ITI, these results strongly suggest that increasing PTP and stress undermines cognitive inhibition; conversely, that decreasing PTP and stress benefits cognitive inhibition.
The second set of analyses show that the ITI (PTP) directly impacts both stress and negative affect, and the third set of analyses show that changes in the ITI (PTP) have transient impacts on cognitive inhibition and negative affect but not stress. It’s interesting to note that this slower recovery of stress compared to that of cognitive inhibition and negative affect parallels the slower recovery of RT compared to that of accuracy seen in the previous set of results: it seems that response latency, a graded measure, could be more sensitively related to stress than the binary measure of response accuracy.
3.3. Exploratory analysis: trial-to-trial carryover
In response to research from Cheng et al. (2008) and Cheng et al. (2013) showing that visual information can linger across trials with ITIs less than five seconds, we tested if the direction of the target arrow (“<“ or “>“) on trial n influenced response key judgements on trial n + 1, and if ITI moderated this effect.
We ran a generalized linear mixed-effects logistic regression model, where response key (“f” or “j”, reflecting “<“ and “>“ decisions, respectively) was predicted by the Target arrow direction on the previous trial, the ITI during that block of trials, the interaction of these two variables, and a random effect of participant ID. In R, the model code can be written:
| (3) |
We found that the previous trial’s Target arrow direction had a reliable influence on the current trial’s key press (β = − .427, p < .001), but this effect was not significantly influenced by ITI (main effect: β = − .003, p = .826; interaction: β = .002, p = .925). While the visual overlap effect described by Cheng et al. (2008, 2013) was apparent in our data, it is unlikely to account for our findings because the previous trial’s influence on the current trial was not moderated by ITI.
3.4. Exploratory mediation analyses
To elucidate the relationships between ITI, stress, and cognitive inhibition (Flanker effect), we ran exploratory mediation models to assess whether stress mediates the relationship between ITI and inhibition. Fig. 3A shows that there is a significant mediation effect of stress on the relationship between ITI and the Flanker effect when ITIs are decreasing (PTP is increasing; ACME = 0.024, p = .004), with a significant direct effect (ADE = 0.096, p < .001) and total effect (effect = 0.120, p < .001). Similarly, Fig. 3B shows that there is a significant mediation effect of stress when ITIs are increasing as well (PTP is decreasing; ACME = −0.016, p = .006), with significant direct effects (ADE = −0.093, p < .001) and total effects (effect = −0.109, p < .001) too. These analyses show that PTP (as indexed by ITI) may exert its effects on inhibition via stress, and serve as a reminder that the psychological effects of PTP are important to consider when understanding its surprising effects on EF.
Fig. 3.
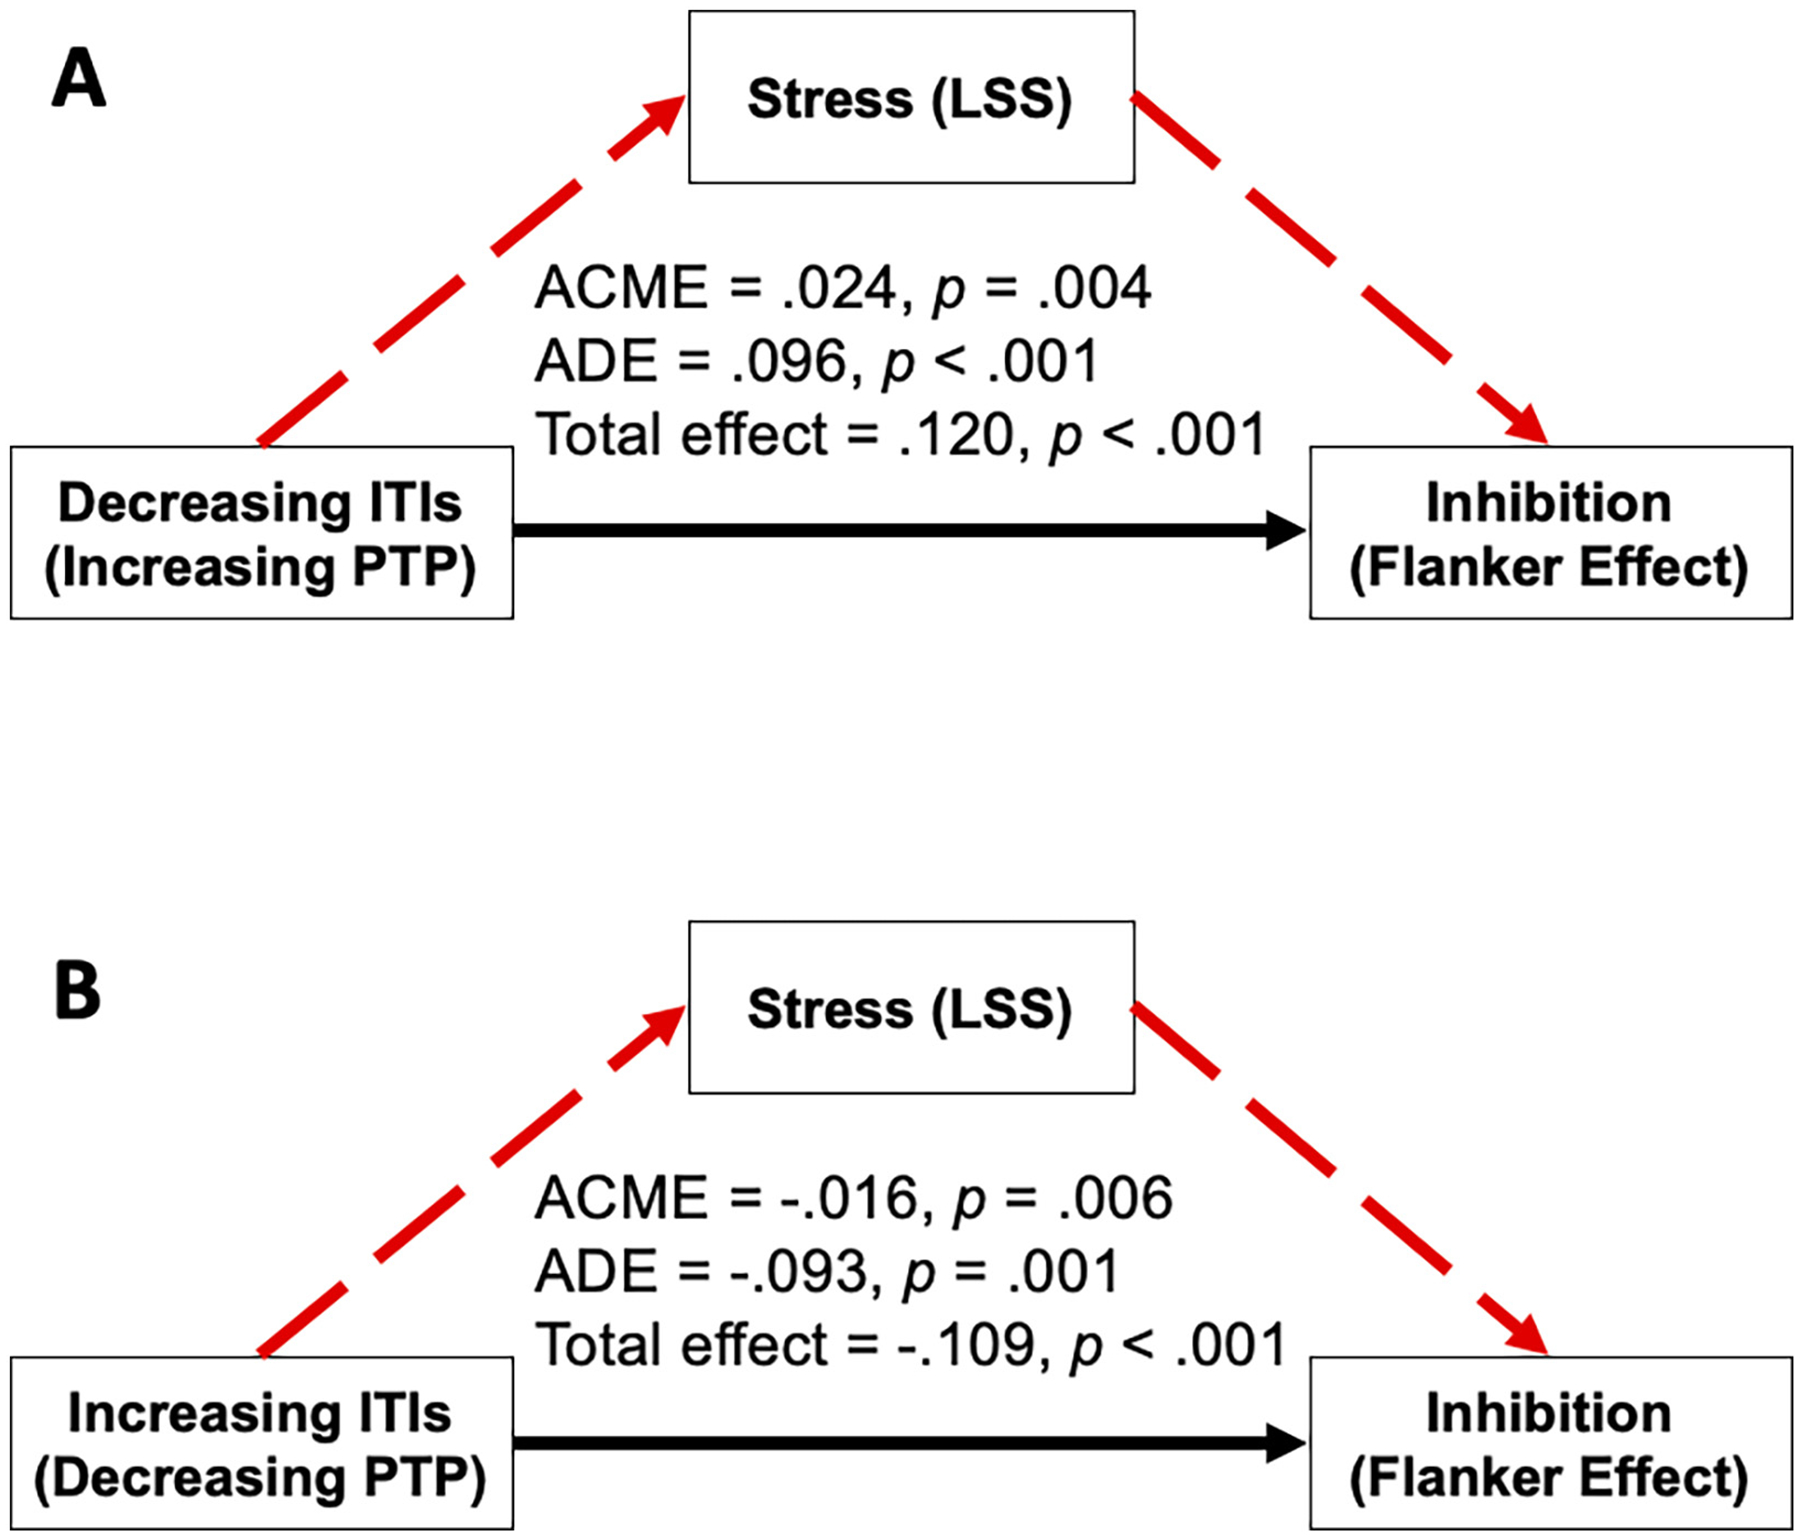
Exploratory mediation models of stress on the relationship between the ITI (PTP) and cognitive inhibition. ACME = Average Causal Mediation Effect; ADE = Average Direct Effect.
4. General discussion
This study examined the relationships between PTP (as proxied by changing ITIs), cognitive inhibition, stress, and negative affect during Eriksen’s Flanker task. First, we show that increasing PTP worsens accuracy, cognitive inhibition, stress, and negative affect, and speeds response times. Decreasing PTP reverses these effects, back to baseline for accuracy, cognitive inhibition and negative affect. We then show that PTP and stress predict inhibition in multilevel models, and in an exploratory analysis we show that stress mediates the relationship between PTP and cognitive inhibition.
We found that simulating time pressure by manipulating ITIs has real behavioral and psychological consequences (Compton et al., 2017; Endres et al., 2020; Shields et al., 2016; Sun & Sekuler, 2021; Young et al., 2018). As previously explained, changing ITIs does not induce objective time pressure: participants had the same amount of time to process and respond to every stimulus regardless of the ITI level. So, we show that merely the experience of feeling rushed—regardless of whether or not you actually are rushed—impairs executive functioning and induces distress (Frankenhaeuser, 1986). This study specifically indicates that PTP can impair inhibition, complimenting similar findings in cognitive flexibility (Sun & Sekuler, 2021) and decision-making in general (Maule et al., 2000).
That said, the observed behavioral effects of PTP are similar to those found in conditions of objective time pressure (De Paola & Gioia, 2016; Endres et al., 2020). According to an account from Payne et al. (1988), decision-makers adjust their strategies to optimize effort and accuracy in response to time pressure (Dambacher & Hübner, 2015; Gok & Atsan, 2016; Payne et al., 1988). These strategic changes include acceleration (faster processing; Spiliopoulos et al., 2018; Gok & Atsan, 2016) and filtration (increased specificity in information acquisition; Oh et al., 2016; Spiliopoulos et al., 2018; Maule et al., 2000; Gok & Atsan, 2016). Acceleration, evidenced by speeded information processing, is demonstrated here with decreased response times, and Filtration, selective information processing, is also apparent through enhanced selective attention to Flanker arrows (seen in reduced inhibition). This latter finding aligns with work from Dayan and Solomon (2010), who argue that under time pressure, it is optimal under Bayesian inference to selectively attend to the distracting Flanker arrows, as this strategy enables participants to make decisions fast enough (at the cost of accuracy). Thus, this study shows that responses to PTP mimic those observed under conditions of objective time pressure.
Manipulating the duration of the ITI is likely to affect the cognitive processes needed for participants to prepare for the next trial. As Vallesi and Shallice (2007) explain, cognitive changes during the ITI can be understood by a dual-process account involving (1) changes in motor readiness and (2) a strategic monitoring process during which the arrival time of the next stimulus is updated. Although longer ITIs benefit performance by restoring cognitive resources (Vallesi & Shallice, 2007), allowing participants to adequately prepare for the next trial (Vallesi et al., 2013) and alleviating performance losses associated with task switching if applicable (Meiran et al., 2000), ITIs also risk being too long, which could induce boredom, fatigue, and/or mind-wandering (Compton et al., 2017; Sun & Sekuler, 2021). In contrast, short ITIs facilitate sustained arousal (Vallesi et al., 2013), but can also undermine effective decision making (Compton et al., 2017; Young et al., 2018). It is clear that ITIs, despite their presumed independence from the experimental task itself, can affect decision-making in many ways. More work is needed to find the ideal (“Goldilocks”) ITI value, one that is neither too long nor too short (de Jonge et al., 2012). Knowing that value or range of values could help to reconcile experimental results across studies.
The relationships between PTP, stress, and negative affect deserve further exploration. PTP (both increasing and decreasing) predicts stress, and in turn, stress predicts cognitive inhibition. This expands previous demonstrations that the experience of stress is associated with diminished executive function (Sänger et al., 2014; Shields et al., 2016; Thayer & Lane, 2000). Yet, neither negative affect nor the interaction between stress and negative affect independently explained significant variance in inhibition, in contrast with previous findings (e.g. Vinski & Watter, 2013). This could be because negative affect has been primarily found to potentiate the effects of stress on task performance (Finy et al., 2014; Pessoa et al., 2012; Vinski & Watter, 2013).
4.1. Limitations and future directions
One of the limitations of this study is that the brief duration of the ITIs, particularly the shorter ITI’s, could have enabled cross-trial influence. Specifically, previous studies using short ITIs have noted that visual information can bleed across subsequent trials and influence performance (Cheng et al., 2008, 2013). Future work could compare how relative changes in longer ITIs impact executive functioning. Another limitation is the lack of counterbalancing between conditions of increasing and decreasing PTP and therefore sudden versus gradual changes in ITI. A follow-up study would do well to assess how the effects we observed change when ITIs are randomized, both between and within blocks. Randomizing the ITI across trials could also diffuse any effects of the ITI on the visual overlap effect just described. Future studies would also benefit by examining how biomarkers of stress, such as heart rate variability, blood pressure, cortisol levels, and salivary alpha-amylase levels, change with PTP.
5. Conclusions
Our study explored the effects of perceived time pressure (PTP) on the executive function (EF) of cognitive inhibition. Although participants had the same amount of time to process and respond to every trial in Eriksen’s Flanker task, the systematic variation of the inter-trial interval (ITI) to manufacture PTP profoundly affected task performance and psychological states including stress and negative affect. Increasing PTP, simulated with decreasing ITIs, sped response times and worsened accuracy, cognitive inhibition (the Flanker effect), stress, and negative affect. Decreasing PTP, simulated with increasing ITIs, reversed these effects, even back to baseline for accuracy, inhibition, and negative affect. Multilevel modeling revealed that PTP and stress predicted inhibition, and exploratory mediation modeling suggested that PTP impacted inhibition both directly and indirectly with stress as a mediator.
We validate the subjective experience of perceived time pressure as an empirical stressor and a disruptor of executive functioning. While this study focused on inhibition, preliminary evidence suggests that this effect generalizes to other executive functions like cognitive flexibility as well. These results suggest that strategies to avoid perceived time pressure in everyday life could benefit EF: time adequacy was related to high academic performance in college students (Nonis et al., 1998) and improved task-oriented behavior in employees (Lee et al., 2017). Similarly, these results emphasize the importance of interventions to lower stress as a way to promote EF. Future work would do well to assess how different biomarkers of stress inform these effects.
Acknowledgments
We thank Dr. Hannah Snyder for her guidance with the design and analysis of this project. We also thank Mercedes Villalonga and Dr. Claire Pontbriand for their help with data analysis.
Funding
This work was supported by the National Institutes of Health grant R90 DA033463 for Undergraduate Training in Computational Neuroscience.
Footnotes
CRediT author statement
R. F. Sussman: Conceptualization, Methodology, Software, Investigation, Data Curation, Visualization, Formal Analysis, Writing - Original Draft, Reviewing, and Editing, Funding Acquisition.
R. Sekuler: Conceptualization, Methodology, Resources, Investigation, Formal Analysis, Writing - Reviewing and Editing, Supervision, Project Administration, Funding Acquisition.
Studies in humans and animals
The work described in this study hasbeen carried out in accordance with the Declaration of Helsinki. Informed consent was obtained from all individual participants included in the study.
Submission declaration and verification
This work has not been published previously, is not under consideration for publication elsewhere, is approved by all authors, and will not be published elsewhere in the same form.
Open practices statement/research data
The data and materials for this experiment are available in the Open Science Framework (OSF) repository, at https://osf.io/c3tfm/?view_only=124a431e2b59485d84db525a86fed79a. The experiment was not preregistered.
Declaration of competing interest
The authors declare they have no competing interests.
References
- Bächtold D, Baumüller M, & Brugger P (1998). Stimulus-response compatibility in representational space. Neuropsychologia, 36(8), 731–735. [DOI] [PubMed] [Google Scholar]
- Bates D, Mächler M, Bolker B, & Walker S (2015). Fitting linear mixed-effects models using lme4. Journal of Statistical Software, 67(1), 1–48. 10.18637/jss.v067.i01 [DOI] [Google Scholar]
- Berggren N, & Derakshan N (2013). Attentional control deficits in trait anxiety: Why you see them and why you don’t. Biological Psychology, 92(3), 440–446. [DOI] [PubMed] [Google Scholar]
- Bridges D, Pitiot A, MacAskill MR, & Peirce JW (2020). The timing mega-study: Comparing a range of experiment generators, both lab-based and online. PeerJ, 8, Article e9414. [DOI] [PMC free article] [PubMed] [Google Scholar]
- Caviola S, Carey E, Mammarella IC, & Szucs D (2017). Stress, time pressure, strategy selection and math anxiety in mathematics: A review of the literature. Frontiers in Psychology, 8, 1488. [DOI] [PMC free article] [PubMed] [Google Scholar]
- Champely S, Ekstrom C, Dalgaard P, Gill J, Weibelzahl S, Anandkumar A, & De Rosario MH (2018). Package ‘pwr’. R package version, 1(2). [Google Scholar]
- Cheng DT, Luis M, & Tremblay L (2008). Randomizing visual feedback in manual aiming: Reminiscence of the previous trial condition and prior knowledge of feedback availability. Experimental Brain Research, 189(4), 403–410. [DOI] [PubMed] [Google Scholar]
- Cheng DT, Manson GA, Kennedy A, & Tremblay L (2013). Facilitating the use of online visual feedback: Advance information and the inter-trial interval? Motor Control, 17(2), 111–122. [DOI] [PubMed] [Google Scholar]
- Compton RJ, Heaton E, & Ozer E (2017). Intertrial interval duration affects error monitoring. Psychophysiology, 54(8), 1151–1162. [DOI] [PubMed] [Google Scholar]
- Crawford JR, & Henry JD (2004). The positive and negative affect schedule (PANAS): Construct validity, measurement properties and normative data in a large non-clinical sample. British Journal of Clinical Psychology, 43(3), 245–265. [DOI] [PubMed] [Google Scholar]
- Dambacher M, & Hübner R (2015). Time pressure affects the efficiency of perceptual processing in decisions under conflict. Psychological Research, 79(1), 83–94. [DOI] [PubMed] [Google Scholar]
- Dayan P, & Solomon JA (2010). Selective bayes: Attentional load and crowding. Vision Research, 50(22), 2248–2260. [DOI] [PubMed] [Google Scholar]
- de Jonge M, Tabbers HK, Pecher D, & Zeelenberg R (2012). The effect of study time distribution on learning and retention: A goldilocks principle for presentation rate. Journal of Experimental Psychology: Learning, Memory, and Cognition, 38(2), 405. [DOI] [PubMed] [Google Scholar]
- De Paola M, & Gioia F (2016). Who performs better under time pressure? Results from a field experiment. Journal of Economic Psychology, 53, 37–53. [Google Scholar]
- DeDonno MA, & Demaree HA (2008). Perceived time pressure and the Iowa gambling task. Judgment and Decision making, 3(8), 636. [Google Scholar]
- Diamond A (2013). Executive functions. Annual Review in Psychology, 64, 135–168. [DOI] [PMC free article] [PubMed] [Google Scholar]
- Ellis RJ, & Jones MR (2010). Rhythmic context modulates foreperiod effects. Attention, Perception, & Psychophysics, 72(8), 2274–2288. [DOI] [PubMed] [Google Scholar]
- Endres DN, Byrne KA, Anaraky RG, Adesegun N, Six SG, & Tibbett TP (2020). Stop the clock because I can’t stop: Time pressure, but not monitoring pressure, impairs response inhibition performance. Journal of Cognitive Psychology, 1–18. [Google Scholar]
- Eriksen BA, & Eriksen CW (1974). Effects of noise letters upon the identification of a target letter in a nonsearch task. Perception & Psychophysics, 16(1), 143–149. [Google Scholar]
- Finy MS, Bresin K, Korol DL, & Verona E (2014). Impulsivity, risk taking, and cortisol reactivity as a function of psychosocial stress and personality in adolescents. Development and Psychopathology, 26(4pt1), 1093–1111. [DOI] [PubMed] [Google Scholar]
- Frankenhaeuser M (1986). A psychobiological framework for research on human stress and coping. In Dynamics of stress (pp. 101–116). Springer. [Google Scholar]
- Gok K, & Atsan N (2016). Decision-making under stress and its implications for managerial decision-making: A review of literature. International Journal of Business and Social Research, 6(3), 38–47. [Google Scholar]
- Hockey GRJ (1997). Compensatory control in the regulation of human performance under stress and high workload: A cognitive-energetical framework. Biological Psychology, 45(1–3), 73–93. [DOI] [PubMed] [Google Scholar]
- Lange-Malecki B, & Treue S (2012). A flanker effect for moving visual stimuli. Vision Research, 62, 134–138. [DOI] [PubMed] [Google Scholar]
- Lawrence MA, & Lawrence MMA (2016). Package ‘ez’. R package version, 4(0). [Google Scholar]
- Lee S, McHale SM, Crouter AC, Kelly EL, Buxton OM, & Almeida DM (2017). Perceived time adequacy improves daily well-being: Day-to-day linkages and the effects of a workplace intervention. Community, Work & Family, 20(5), 500–522. [DOI] [PMC free article] [PubMed] [Google Scholar]
- Li Q, Joo SJ, Yeatman JD, & Reinecke K (2020). Controlling for participants’viewing distance in large-scale, psychophysical online experiments using avirtual chinrest. Scientific Reports, 10(1), 1–11. [DOI] [PMC free article] [PubMed] [Google Scholar]
- Luciana M (2013, Nov). Adolescent brain development in normality and psychopathology. Development and Psychopatholgy, 25(4 Pt 2), 1325–1345. 10.1017/S0954579413000643 [DOI] [PMC free article] [PubMed] [Google Scholar]
- Maule AJ, & Hockey GRJ (1993). State, stress, and time pressure. In Time pressure and stress in human judgment and decision making (pp. 83–101). Springer. [Google Scholar]
- Maule AJ, Hockey GRJ, & Bdzola L (2000). Effects of time-pressure on decision-making under uncertainty: Changes in affective state and information processing strategy. Acta Psychologica, 104(3), 283–301. [DOI] [PubMed] [Google Scholar]
- Meiran N, Chorev Z, & Sapir A (2000). Component processes in task switching. Cognitive Psychology, 41(3), 211–253. [DOI] [PubMed] [Google Scholar]
- Mendl M (1999). Performing under pressure: Stress and cognitive function. Applied Animal Behaviour Science, 65(3), 221–244. [Google Scholar]
- Miranda AT, & Palmer EM (2014). Intrinsic motivation and attentional capture from gamelike features in a visual search task. Behavior Research Methods, 46(1), 159–172. [DOI] [PubMed] [Google Scholar]
- Morys-Carter W (2020). Screenscale. https://gitlab.pavlovia.org/Wake/screenscale.
- Nonis SA, Hudson GI, Logan LB, & Ford CW (1998). Influence of perceived control over time on college students’stress and stress-related outcomes. Research in Higher Education, 39(5), 587–605. [Google Scholar]
- Oh H, Beck JM, Zhu P, Sommer MA, Ferrari S, & Egner T (2016). Satisficing in split-second decision making is characterized by strategic cue discounting. Journal of Experimental Psychology: Learning, Memory, and Cognition, 42(12), 1937. [DOI] [PubMed] [Google Scholar]
- Orbach L, Herzog M, & Fritz A (2020). State-and trait-math anxiety and their relation to math performance in children: The role of core executive functions. Cognition, 200, Article 104271. [DOI] [PubMed] [Google Scholar]
- Pacheco-Unguetti AP, Acosta A, Callejas A, & Lupiáñez J (2010). Attention and anxiety: Different attentional functioning under state and trait anxiety. Psychological Science, 21(2), 298–304. [DOI] [PubMed] [Google Scholar]
- Pavlovia. (2020). https://pavlovia.org/ (Accessed: 2020-09-30).
- Payne JW, Bettman JR, & Johnson EJ (1988). Adaptive strategy selection in decision making. Journal of Experimental Psychology: Learning, Memory, and Cognition, 14(3), 534. [Google Scholar]
- Peirce J, Gray JR, Simpson S, MacAskill M, Höchenberger R, Sogo H, & Lindeløv JK (2019). PsychoPy2: Experiments in behavior made easy. Behavior Research Methods, 51(1), 195–203. [DOI] [PMC free article] [PubMed] [Google Scholar]
- Pessoa L, Padmala S, Kenzer A, & Bauer A (2012). Interactions between cognition and emotion during response inhibition. Emotion, 12(1), 192. [DOI] [PMC free article] [PubMed] [Google Scholar]
- Plieger T, & Reuter M (2020). Stress & executive functioning: A review considering moderating factors. Neurobiology of Learning and Memory, 107254. [DOI] [PubMed] [Google Scholar]
- Qi M, & Gao H (2020). Acute psychological stress promotes general alertness and attentional control processes: An ERP study. Psychophysiology, 57(4), Article e13521. [DOI] [PubMed] [Google Scholar]
- Qualtrics. (2020). https://www.qualtrics.com (Accessed: 2020-09-30).
- R Core Team. (2020). R: A language and environment for statistical computing [Computer software manual]. Vienna, Austria. Retrieved from https://www.R-project.org/. [Google Scholar]
- RStudio Team. (2020). Rstudio: Integrated development environment for r [Computer software manual]. Boston, MA. Retrieved from http://www.rstudio.com/. [Google Scholar]
- Sänger J, Bechtold L, Schoofs D, Blaszkewicz M, & Wascher E (2014). The influence of acute stress on attention mechanisms and its electrophysiological correlates. Frontiers in Behavioral Neuroscience, 8, 353. [DOI] [PMC free article] [PubMed] [Google Scholar]
- Shields GS, Sazma MA, & Yonelinas AP (2016). The effects of acute stress on core executive functions: A meta-analysis and comparison with cortisol. Neuroscience & Biobehavioral Reviews, 68, 651–668. [DOI] [PMC free article] [PubMed] [Google Scholar]
- Snyder HR, Miyake A, & Hankin BL (2015). Advancing understanding of executive function impairments and psychopathology: Bridging the gap between clinical and cognitive approaches. Frontiers in Psychology, 6, 328. [DOI] [PMC free article] [PubMed] [Google Scholar]
- Spiliopoulos L, Ortmann A, & Zhang L (2018). Complexity, attention, and choice in games under time constraints: A process analysis. Journal of Experimental Psychology: Learning, Memory, and Cognition, 44(10), 1609. [DOI] [PubMed] [Google Scholar]
- Steinhauser M, Maier M, & Hübner R (2007). Cognitive control under stress: How stress affects strategies of task-set reconfiguration. Psychological Science, 18(6), 540–545. [DOI] [PubMed] [Google Scholar]
- Sun Y, & Sekuler R (2021). Decision-making and multisensory combination under time stress. Perception, 50, 627–645. [DOI] [PubMed] [Google Scholar]
- Thayer JF, & Lane RD (2000). A model of neurovisceral integration in emotion regulation and dysregulation. Journal of Affective Disorders, 61(3), 201–216. [DOI] [PubMed] [Google Scholar]
- Thompson ER (2007). Development and validation of an internationally reliable short-form of the positive and negative affect schedule (PANAS). Journal of Cross-Cultural Psychology, 38(2), 227–242. [Google Scholar]
- Tingley D, Yamamoto T, Hirose K, Keele L, & Imai K (2014). Mediation: R package for causal mediation analysis.
- Vallesi A, Lozano VN, & Correa Á (2013). Dissociating temporal preparation processes as a function of the inter-trial interval duration. Cognition, 127(1), 22–30. [DOI] [PubMed] [Google Scholar]
- Vallesi A, & Shallice T (2007). Developmental dissociations of preparation over time: Deconstructing the variable foreperiod phenomena. Journal of Experimental Psychology: Human Perception and Performance, 33(6), 1377. [DOI] [PubMed] [Google Scholar]
- van Moorselaar D, & Slagter HA (2020). Inhibition in selective attention. Annals of the New York Academy of Sciences, 1464(1), 204. [DOI] [PMC free article] [PubMed] [Google Scholar]
- Vinski MT, & Watter S (2013). Being a grump only makes things worse: A transactional account of acute stress on mind wandering. Frontiers in Psychology, 4, 730. [DOI] [PMC free article] [PubMed] [Google Scholar]
- Vogel S, Fernández G, Joëls M, & Schwabe L (2016). Cognitive adaptation under stress: A case for the mineralocorticoid receptor. Trends in CognitiveSciences, 20(3), 192–203. [DOI] [PubMed] [Google Scholar]
- Wickham H, Averick M, Bryan J, Chang W, McGowan LD, François R, et al. (2019). Welcome to the tidyverse. Journal of Open Source Software, 4(43), 1686. [Google Scholar]
- Young ME, Sutherland SC, & McCoy AW (2018). Optimal go/no-go ratios to maximize false alarms. Behavior Research Methods, 50(3), 1020–1029. [DOI] [PubMed] [Google Scholar]
- Zakay D (1990). In Block RA (Ed.), Cognitive models of psychological time (pp. 59–84). Hillsdale, NI: Lawrence Erlbaum Associates, Inc. [Google Scholar]
- Zakay D (1993). The impact of time perception processes on decision making under time stress. Retrieved from. In Svenson O MA. (Ed.), Time pressure and stress in human judgment and decision making (pp. 59–72). Boston, MA: Springer. [Google Scholar]
- Zelazo PD, Anderson JE, Richler J, Wallner-Allen K, Beaumont JL, Conway KP, & Weintraub S (2014). Nih toolbox cognition battery (cb): Validation of executive function measures in adults. Journal of the International Neuropsychological Society: JINS, 20(6), 620. [DOI] [PMC free article] [PubMed] [Google Scholar]
- Zuzanek J (1998). Time use, time pressure, personal stress, mental health, and life satisfaction from a life cycle perspective. Journal of Occupational Science, 5(1), 26–39. [Google Scholar]