Abstract
The most frequent internal modification in eukaryotic mRNA is N6-methyladenosine (m6A). However, what we know about the m6A regulators in Ankylosing spondylitis (AS) is still limited. In our study, eight distinct m6A regulators were selected utilizing Differentially Expressed Gene (DEG) analysis of the Gene Expression Omnibus GSE73754 dataset for making comparisons between AS (Ankylosing spondylitis) and non-AS patients. The random forest model and the nomogram model were used to screen the eight candidate m6A regulators and evaluate their prediction accuracy for the occurrence of AS. Furthermore, based on the selected m6A regulators, the AS patients were divided into two subgroups, and we applied principal component analysis algorithms to calculate their m6A score and evaluate the m6A patterns. Our findings revealed that patients in cluster A were linked to activated CD4 T cell immunity and activated CD8 T cell immunity. With its major contributions in the area of immunology, our research in m6A patterns may benefit the future diagnosis and treatment strategies of AS.
1. Introduction
Ankylosing spondylitis (AS), also known as radiographic axial spondyloarthritis (already developed structural damage in the sacroiliac joints or spine visible on radiographs), is a chronic inflammatory disease categorized within spondyloarthropathies (SpA) and manifested by damage to the axial skeleton [1]. In the general population, the prevalence of AS ranges from 9 to 30 per 10,000 in the world [2]. Up to 90% of patients with AS have the Human Leukocyte Antigen (HLA)-B27 gene haplotype, while this number in the general population is less than 10%, which indicates that AS has a strong association with the HLA-B27 gene [3]. AS tends to occur in young adults aged 15 to 30. About 80% of its cases first develop before 30 [4]. Up to 15% of patients with AS first have symptoms before 16 years old [5]. The clinical manifestations of AS include arthritis in peripheral joints or peripheral entheses at some point in the disease course. Peripheral arthritis, enthesitis, or dactylitis are involved in the significant clinical manifestation of AS [6]. A single anteroposterior pelvis X-ray, magnetic resonance imaging, ultrasonography, laboratory tests (such as erythrocyte sedimentation rate and C-reactive protein), and HLA-B27 in the patient with clinical features of SpA are beneficial to the diagnosis of AS [7]. The most crucial factor is the presence of HLA-B27 [3]. However, HLA-B60, HLA-B61, HLA-DR8, HLADRB1, and MICA (MHC class I chain-related gene A) play an essential role in AS [8–12]. Moreover, non-HLA susceptibility genes (PUM1 and ZFP91) play a critical role in the development of AS [13]. In addition to IL23R, several risk genes (TYK2, CARD9, IL12B, IL27, NKX2, and PTGER4) identified in AS are either directly involved in the IL-23–IL-17 pathway or interactive with it [14–18]. The average delay from symptom onset to AS physician diagnosis is 5-7 years [19]. As a result, early screening and effective prevention of AS, from the perspective of genetics, will have a big impact on controlling the number of AS patients.
More than 100 types of RNA modification have been described thus far [20], including 1-methyladenosine, 2-methylthio-N6-isopentenyladenosine, and N6-methyladenosine (m6A) [21]. The most common and abundant internal modification in eukaryotic mRNA is N6-methyladenosine (m6A), which methylates the nitrogen-6 position of adenosine in mRNA via various m6A modification regulators [22]. The primary role of m6A in AS is achieved through the regulation of various immune cells and bone cells [13]. The m6A modification involves three types of regulators, known as “Writers”, “Erasers”, and “Readers” [23]. “Writers”, also named m6A methyltransferases, can be removed by the demethylases or “Erasers”. The m6A modification is recognized by m6A-binding proteins, known as “Readers” [24].
However, the roles of m6A regulators in AS remain limited in scientific and clinical studies. In this study, a microarray dataset from GEO database was used to evaluate the functions of m6A regulators in the diagnosis and subtype classification of AS. Furthermore, the current study provides more insight into how m6A modifications influence immune infiltration in AS and guide subsequent treatments.
2. Materials and Methods
2.1. Data Collection
The transcriptome profiling datasets of 52 AS patients with active disease and 20 matched controls were obtained from publicly available datasets (http://www.ncbi.nlm.nih.gov/geo/) with the accession of GSE73754. The normalized matrix files for microarray data from the Illumina platforms were directly downloaded. We extracted a total of 21 m6A regulators from the dataset for corresponding analysis. These 21 m6A regulators are from a recently published paper [25], including eight Writers (METTL3, ZC3H13, METTL14, RBM15B, CBLL1, WTAP, RBM15, and KIAA1429), two Easers (FTO and ALKBH5), and 11 Readers (YTHDC1, YTHDC2, ELAVL1, YTHDF1, LRPPRC, YTHDF2, FMR1, YTHDF3, HNRNPC, HNRNPA2B1, and IGF2BP1).
2.2. Establishment of Random Forest Model and Support Vector Machine Model
Both random forest (RF) and support vector machine (SVM) are models for predicting the occurrence of AS. We evaluated the two models by using “Reverse Cumulative Distribution of Remainder”, “Boxplots of Remainder”, and the receiver operating characteristic (ROC) curve. Random forest as an integration and supervision model based on decision trees can be used for classification and regression. The RF model was established among the 21 m6A regulators by R statistical software with the package of “RandomForest” to predict the occurrence of AS. In our research, we first set the ntree and mtry values to 500 and 2, respectively. Then, we analyzed the point with the smallest cross-validation error in the RF model and selected the important disease-related m6A regulators. The SVM model can minimize a loss function to predict variables that are arranged between lower and upper estimated error bounds. The RF and SVM models were constructed by the R statistical software with the packages “RandomForest” and “KernLab”.
2.3. Nomogram Model of Significant m6A Regulators
We then used R to build a nomogram model to predict the risk of AS via significant candidate m6A regulators, paying attention to the calibration of the model. We also performed DCA and clinical impact curves to figure out whether the decisions based on the model were helpful to the patients. Moreover, ROC curves were built using the R package “pROC”.
2.4. AS Classification Based on Significant m6A Regulators
To explore the connection between the expression of 21 m6A regulators and AS subtypes, we applied unsupervised clustering with the R package “Consensus Cluster Plus” to discover distinct m6A modification patterns based on the expression of 21 m6A regulators; we raised the number of cluster k values from 2 to 9. The optimal number of clusters was estimated according to the consensus clustering algorithm, and the Pheatmap R package was used to build a heat map corresponding to consistent clustering and m6A expression.
2.5. Identification of Differentially Expressed Genes between Distinct m6A Subtypes and Classification of Subtypes Based on the DEGs
The “Limma” package in R was used to determine the Differentially Expressed Genes (DEGs) between different clusters in AS. A p value <0.05 was selected as the screening criterion. A consensus clustering method was used to classify AS into different genomic subtypes based on m6A-related DEGs.
2.6. Functional Enrichment Analysis of Differentially Expressed m6A-Related Genes
Along with the databases of the Gene Ontology (GO) and Kyoto Encyclopedia of Genes and Genomes (KEGG), the enrichment function of the m6A-related genes was analyzed and visualized by using the “Cluster Profiler” in R software. These analyses were performed based on these DEGs.
2.7. Generation of the m6A Gene Signature
To further explore the m6A patterns, we used principal component analysis (PCA) to calculate the m6A score for each sample. The process consists of two steps: the first step is to distinguish the m6A patterns; the second step is to calculate the m6A score according to the following formula [26, 27]: m6Ascore = ∑(PC1i + PC2i), where “i” represents DEG expression.
2.8. Evaluation of Immune Cell Infiltration
To evaluate the abundance of immune cells in AS, we used single-sample gene set enrichment analysis (ssGSEA) to calculate the scores of infiltrating immune cells and evaluate the correlation between the significant m6A regulators and the immune cells. The “GSVA” package was utilized to conduct the ssGSEA, and the “Pheatmap” package in R was used to plot the heat map between the infiltrating immune cells and the significant RNA N6-methyladenosine regulators.
2.9. Statistical Analysis
Pearson's chi-square test was used to analyze the correlations between Readers, Writers, and Erasers. “ConsensusClusterPlus” package in R was used to identify m6A subtypes and gene clusters. Kruskal-Wallis tests were adopted to compare the differences between clusters. All parametric analyses were based on two-tailed tests and p < 0.05 was set as the significance threshold. All data analyses were carried out using R software (version 4.1.2).
3. Results
3.1. The Landscape of the 21 m6A Regulators in AS
In the research, 21 m6A regulators were analyzed via the “Limma” package in R to find the differential expression levels between non-AS patients and AS patients. Eight significant m6A regulators (WTAP, YTHDC1, CBLL1, HNRNPA2B1, METTL14, RBMX, ALKBH5, and IGFBP1) were screened and visualized using a heat map and histogram. We found that WTAP and YTHDC1 were over-expressed in AS patients, while the other significant m6A regulators displayed decreased expression in AS patients compared to non-AS patients (Figures 1(a) and 1(b)). The “RCircos” package in R was utilized to visualize the chromosomal positions of the 21 m6A regulators (Figure 1(c)). Spearman's correlation analysis of the 21 m6A RNA methylation modulators is shown in Figure 1(d).
Figure 1.
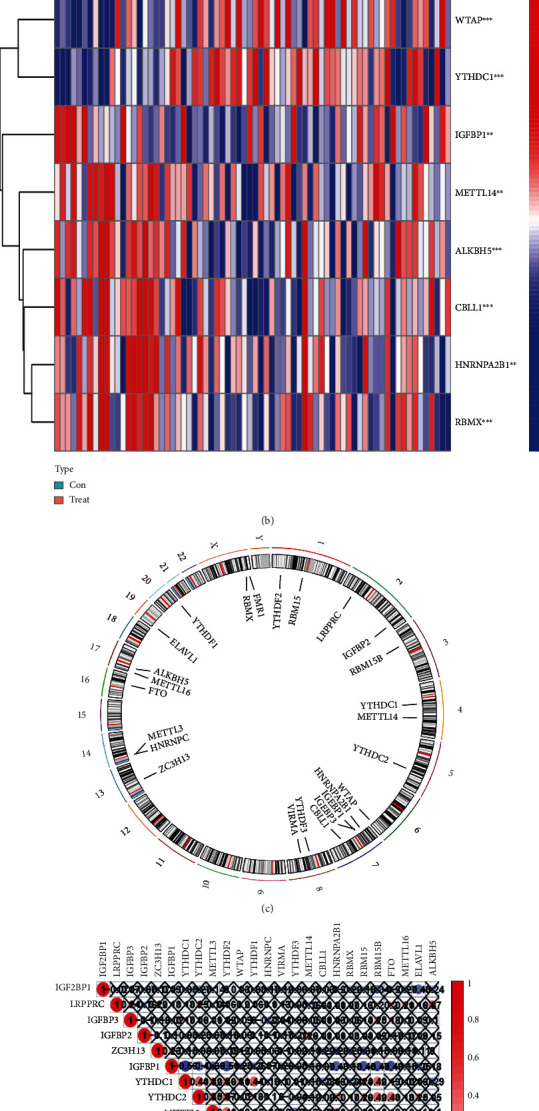
Landscape of the 21 RNA N6-methyladenosine (m6A) regulators in AS. (a) Differential expression histogram of the 21 m6A regulators identified between non-AS and AS patients. (b) Expression heat map of the 21 m6A regulators between non-AS and AS patients. (c) Chromosomal positions of the 21 m6A regulators. (d) Spearman's correlation analysis of the 21 m6A RNA methylation modulators in AS patients ∗p < 0.05, ∗∗p < 0.01, and ∗∗∗p < 0.001.
3.2. Correlation between Writers, Readers, and Erasers in AS
To explore the gene expression levels among Writers, Readers, and Erasers, linear regression analyses were employed to analyze the correlation. p < 0.05 was set as the significance threshold and the correlation coefficient was set at 0.4. The expression levels of Writers and Readers, Erasers and Readers, and Writers and Readers could be found in (Figures 2(a)–2(l)). We found that the expression levels of RBM15B, HNRNPA2B1, IGFBP1, RBMX, and YTHDC2 in AS patients had a significant positive correlation with FTO. Meanwhile, the expression levels of LRPPRC, RBMX, and ELAVL1 displayed a positive correlation with ALKBH5. Furthermore, the results and analyses demonstrated positive correlations between Writers and Readers.
Figure 2.
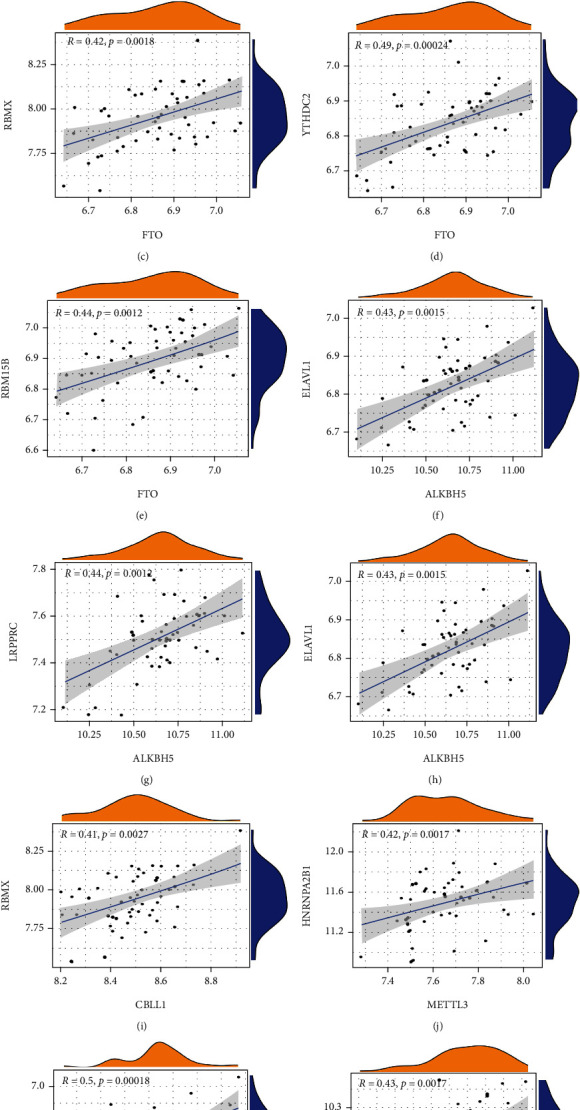
Correlation between Writers, Readers, and Erasers in AS patients (a–l). Writer genes: WAP1, RBM15, RBM15B, METTL14, METTL3, KIAA1429, CBLL1, and ZC3H1; Eraser genes: ALKBH5 and FTO; Reader genes: YTHDC1, YTHDC2, ELAVL1, YTHDF1, LRPPRC, YTHDF2, FMR1, YTHDF3, HNRNPC, HNRNPA2B1, and IGF2BP1.
3.3. Establishment of Random Forest Model and Support Vector Machine Model
Eight candidate m6A regulators were chosen among a total of twenty m6A regulators. Then, we developed regression and support vector machine models to predict the occurrence of AS. Both the “Reverse Cumulative Distribution of residuals” and the “Boxplots of residuals” (Figures 3(a) and 3(b)) revealed that the RF model had minimal residuals. Following that, we further evaluated the model. The evaluation of receiver operating characteristic curve (ROC curve) (Figure 3(c)) and the AUC value of the ROC curve also indicated that the RF model was more appropriate than the SVM model (Figure 3(c)). Thus, we built a RF model based on the differentially expressed m6A-related genes between non-AS patients and AS patients (Figure 4(a)). We visualized these DEGs after classifying them according to their biological significance (Figure 4(b)). Eight candidate genes (WTAP, YTHDC1, CBLL1, HNRNPA2B1, METTL14, RBMX, ALKBH5, and IGFBP1) were selected based on the RF model with a score of greater than 2.
Figure 3.
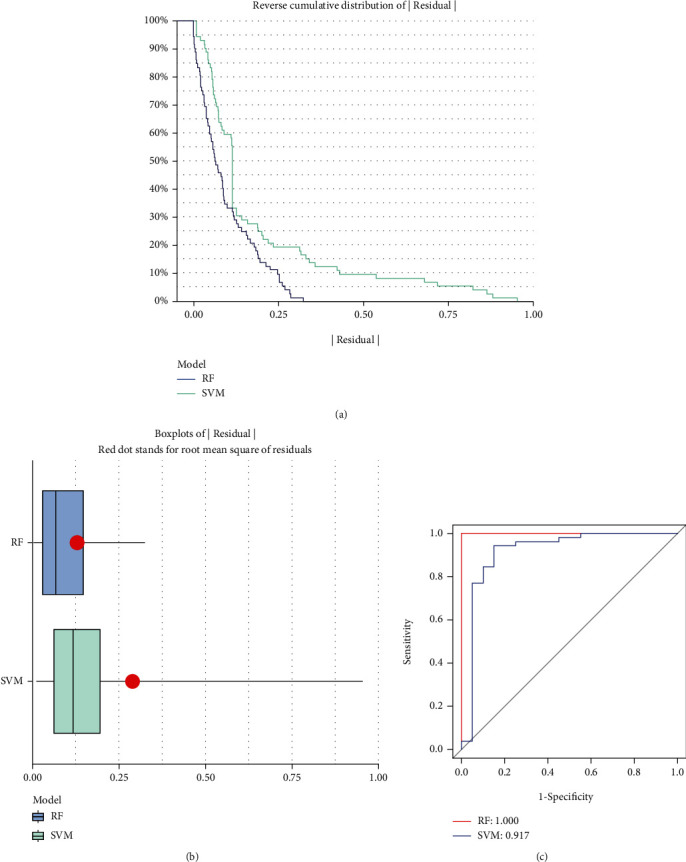
Establishment of random forest model and support vector machine model. (a) The RF and support vector machine (SVM) residual distributions are plotted using the reverse cumulative distribution of residuals. (b) The residual distribution of the RF and SVM models is depicted using boxplots. (c) ROC curves demonstrate the accuracy of the RF model and the SVM model.
Figure 4.
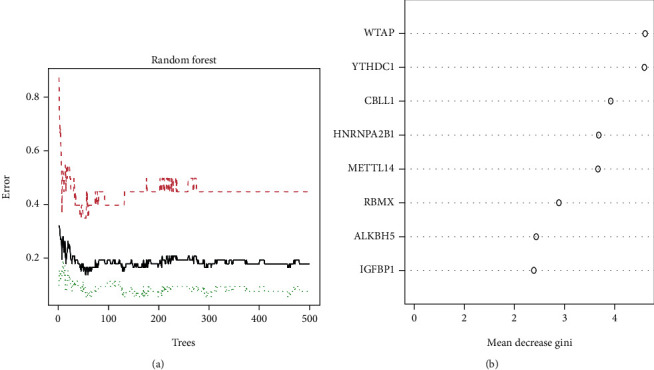
Random Forest (RF) Model construction. (a) The RF model is established among the 21 m6A regulators. (b) The importance of the eight RNA N6-methyladenosine regulators based on the RF model.
3.4. Establishment of the Nomogram Model
The “rms” in R package was used to establish a nomogram model based on the eight candidate m6A regulators for the purpose of forecasting the prevalence of AS patients (Figure 5(a)). It can be found from the calibration curves (Figure 5(b)) that the predictability of the nomogram model was accurate. The DCA curve showed that the red line (model line) remained above the gray line from 0 to 1, revealing that nomogram-based selections may benefit AS patients (Figure 5(c)). Furthermore, the clinical impact curve also indicated that the nomogram model had a significant predictive ability (Figure 5(d)). Additionally, ROC curve illustrated that our m6A regulators model got a better diagnostic power compared to other gene models (Figure 6).
Figure 5.
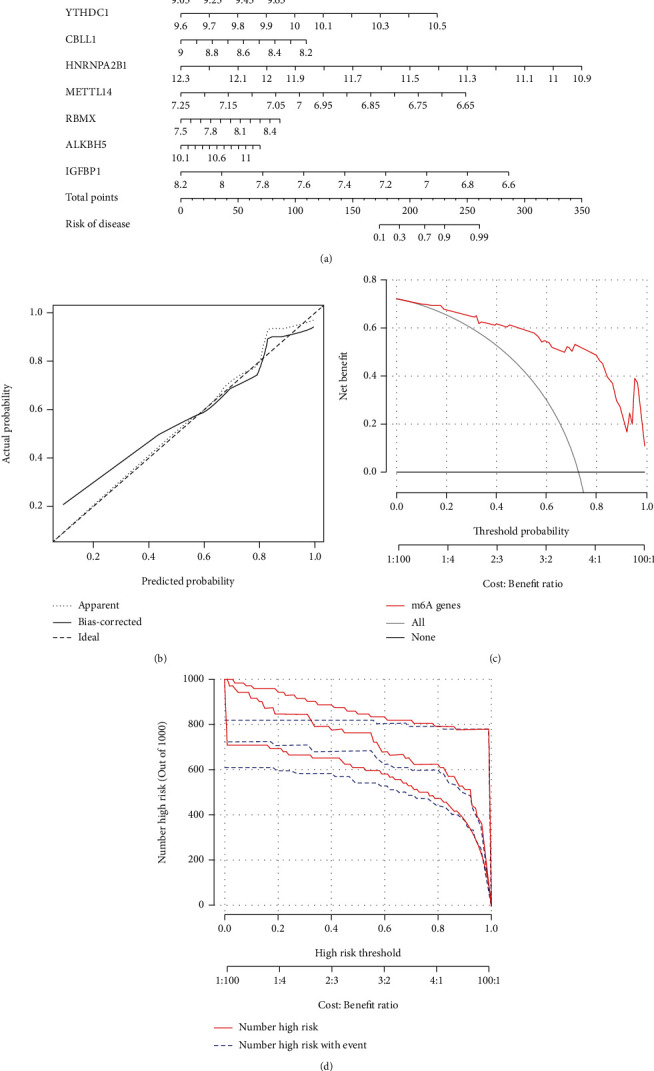
Establishment of the nomogram model. (a) Construction of the nomogram model based on the five candidate RNA N6-methyladenosine regulators. (b) Predictive ability of the nomogram model as revealed by the calibration curve. (c) Decisions based on the nomogram model may benefit AS patients. (d) Clinical impact of the nomogram model as assessed by the clinical impact curve.
Figure 6.
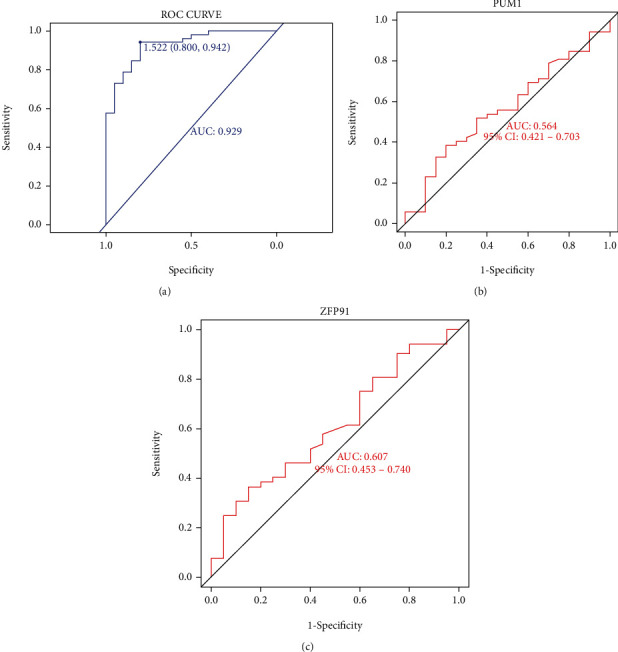
Validation of nomogram model in the diagnostic value. (a) ROC curve analysis of nomogram model. (b) ROC curve analysis of gene PUM1 model. (c) ROC curve analysis of gene ZFP91 model.
3.5. Significant m6A Pattern Recognition Regulators for Two Distinct m6A Patterns
The consensus clustering method was used to identify distinct m6A patterns with eight significant candidate m6A regulators. We identified two m6A patterns using the R tool “Consensus Cluster Plus” (cluster A and cluster B) (Figures 7(a)–7(d)). The histogram and heat map were then generated to illustrate the differential expression of the eight distinct m6A regulators between the two clusters (Figure 7(e)). YTHDC1, HNRNPA2B1, and IGFBP1 all had significantly higher expression levels in cluster A than those in cluster B. There were no significant differences in WTAP, METTL14, CBLL1, RBMX, or ALKBH5 between cluster A and cluster B (Figure 7(f)). PCA clearly revealed that eight significant m6A regulators could distinguish the two m6A patterns (Figure 7(g)).
Figure 7.
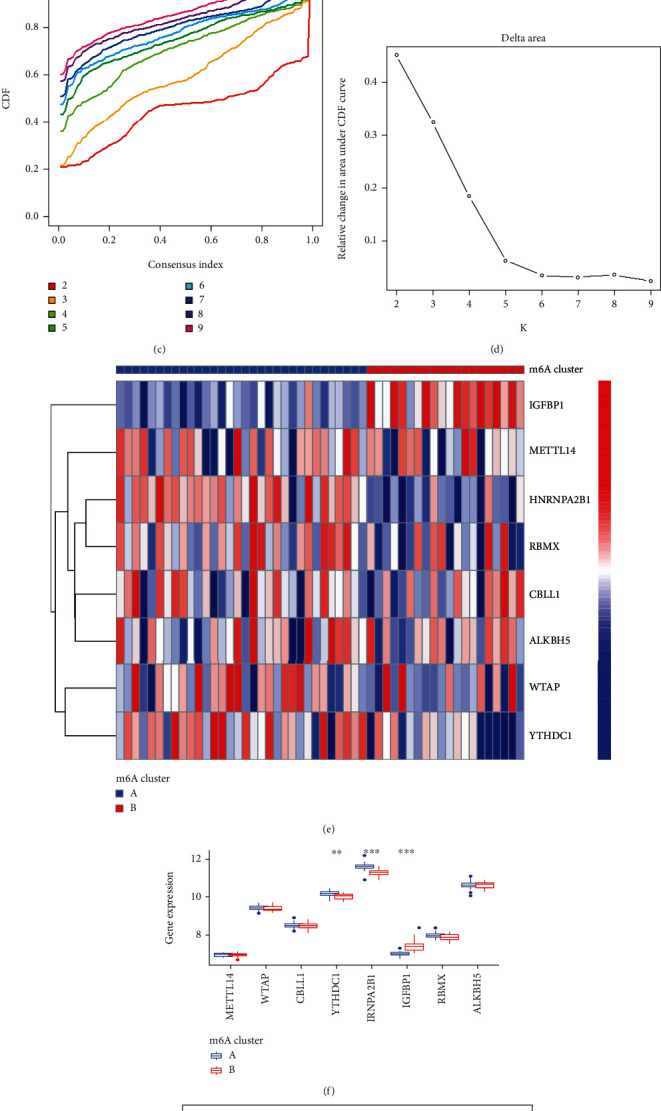
Consensus clustering of the 8 distinct RNA N6-methyladenosine (m6A) regulators in AS patients. (a) The consensus clustering matrix at k = 2. (b) The consensus clustering matrix at k = 3. (c) CDF curve for k = 2 to 9. (d) The relative variation of the area under the CDF curve that k is from 2 to 9. (e) Expression heat map of the 8 significant m6A regulators in cluster A and cluster B. (f) Differential expression histogram of the 8 significant m6A regulators in cluster A and cluster B. (g) Principal component analysis on the expression profiles of the 8 significant m6A regulators that shows a remarkable difference in transcriptomes between the two m6A patterns ∗p < 0.05, ∗∗p < 0.01, and ∗∗∗p < 0.001.
3.6. Classification of Subtypes Based on the DEGs and Evaluation of the m6A Gene Signature
In addition, we used the “Limma” package in R to analyze two m6A patterns. A total of 104 m6A-related DEGs were selected. To further explore the m6A patterns, AS patients were divided into different genomic subtypes based on the 104 m6A-related DEGs by using the “Consensus Cluster Plus”. Consistent with the m6A patterns, the gene patterns were also divided into two clusters (gene cluster A and gene cluster B) (Figures 8(a)–8(d)). A heat map is used in Figure 8(e) based on the expression of 104 DEGs in two gene patterns. Moreover, we tried to explore the expression differences of 21 m6A regulators between the two gene patterns, our research results revealed that CBLL1, YTHDC1, HNRNPA2B1, and RBMX had higher expression levels in gene cluster A, while IGFNP1 had a higher expression level in gene cluster B (Figure 8(f)). To quantify the m6A patterns, PCA algorithms were utilized to calculate the m6A score for each sample. Subsequently, we compared the m6A score between the two distinct m6A gene clusters and the m6A clusters. It can be seen from the results that the m6A score in cluster A or gene cluster A was higher than that in cluster B or gene cluster B (Figures 8(g) and 8(h)).
Figure 8.
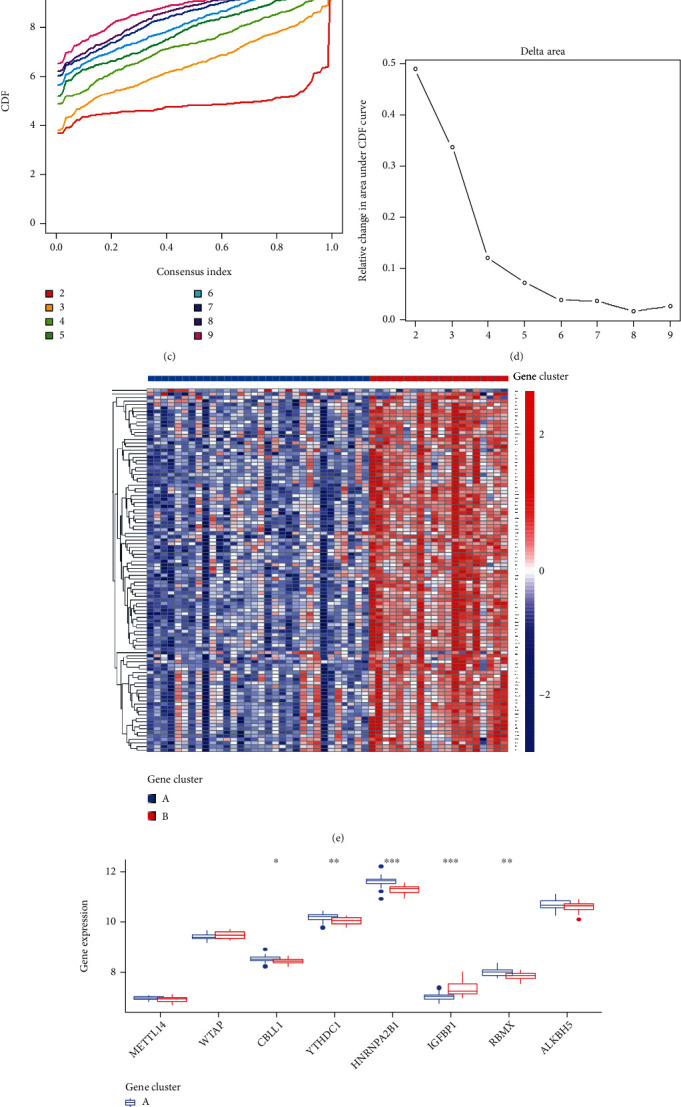
Consensus clustering of the 104 RNA N6-methyladenosine (m6A)-related DEGs in AS patients. (a) The consensus clustering matrix at k = 2. (b) The consensus clustering matrix at k = 3. (c) CDF curve for k = 2 to 9. (d) The relative variation of the area under the CDF curve that k is from 2 to 9. (e) Expression heat map of the 104 m6A-related DEGs in gene cluster A and gene cluster B. (f) Differential expression histogram of the 8 significant m6A regulators in gene cluster A and gene cluster B. (g) Differences in m6A score between cluster A and cluster B. (h) Differences in m6A score between gene cluster A and gene cluster B. ∗p < 0.05, ∗∗p < 0.01, and ∗∗∗p < 0.001.
3.7. Analyses of Immune Characterization and Functional Enrichment
We performed the GO and KEGG analyses to understand the possible mechanism of these DEGs in AS. GO analysis suggested that DEGs mainly concentrated in the processes of heme metabolic, porphyrin containing compound metabolic, tetrapyrrole metabolic, hydrogen peroxide metabolic, hydrogen peroxide catabolic, the modification of mitochondrial matrix, mitochondrial inner membrane and hemoglobin complex, the activity of ubiquitin-protein transferase, ubiquitin-protein ligase, and oxidoreductase (Figure 9(a)). Moreover, KEGG analysis demonstrated that DEGs mainly concentrated in porphyr in metabolism, longevity regulating pathway, glycine, serine and threonine metabolism, mTOR signaling pathway, as well as p53 signaling pathway (Figure 9(b)). In addition, ssGSEA was applied to calculate the abundance of immune cells in AS and to evaluate the correlation between the eight distinct m6A regulators and immune cells. The result of the heat map displayed the correlation between the eight distinct m6A regulators and immune cells (Figure 10(a)). We could conclude that HNRNPA2B1 had positive correlations with numerous immune cells. Then, the two groups (high HNRNPA2B1 expression and low HNRNPA2B1 expression) were used to evaluate the differential immune cell infiltration (Figure 10(b)). The results indicated that patients with high HNRNPA2B1 expression had increased immune cell infiltration compared to those with low HNRNPA2B1 expression. Furthermore, we tried to evaluate the correlation between m6A clusters and differential immune cell infiltration (Figure 10(c)). The results showed that the two significant m6A patterns were consistent with activated CD4 T cell immunity, activated CD8 T cell immunity, and MDSC immunity. Cluster A was linked to activated CD4 T cell immunity and activated CD8 T cell immunity, while cluster B had a correlation with the immunity of MDSC that has been linked to immunosuppressive functions, which indicated that cluster A might be related to AS. In addition, we explored the relationship between gene clusters and differential immune cell infiltration, and the result was consistent with the correlation between m6A cluster A and differential immune cell infiltration (Figure 11(a)). The Sankey diagram shows the changes in m6A cluster, gene cluster, and m6A score (Figure 11(b)).
Figure 9.
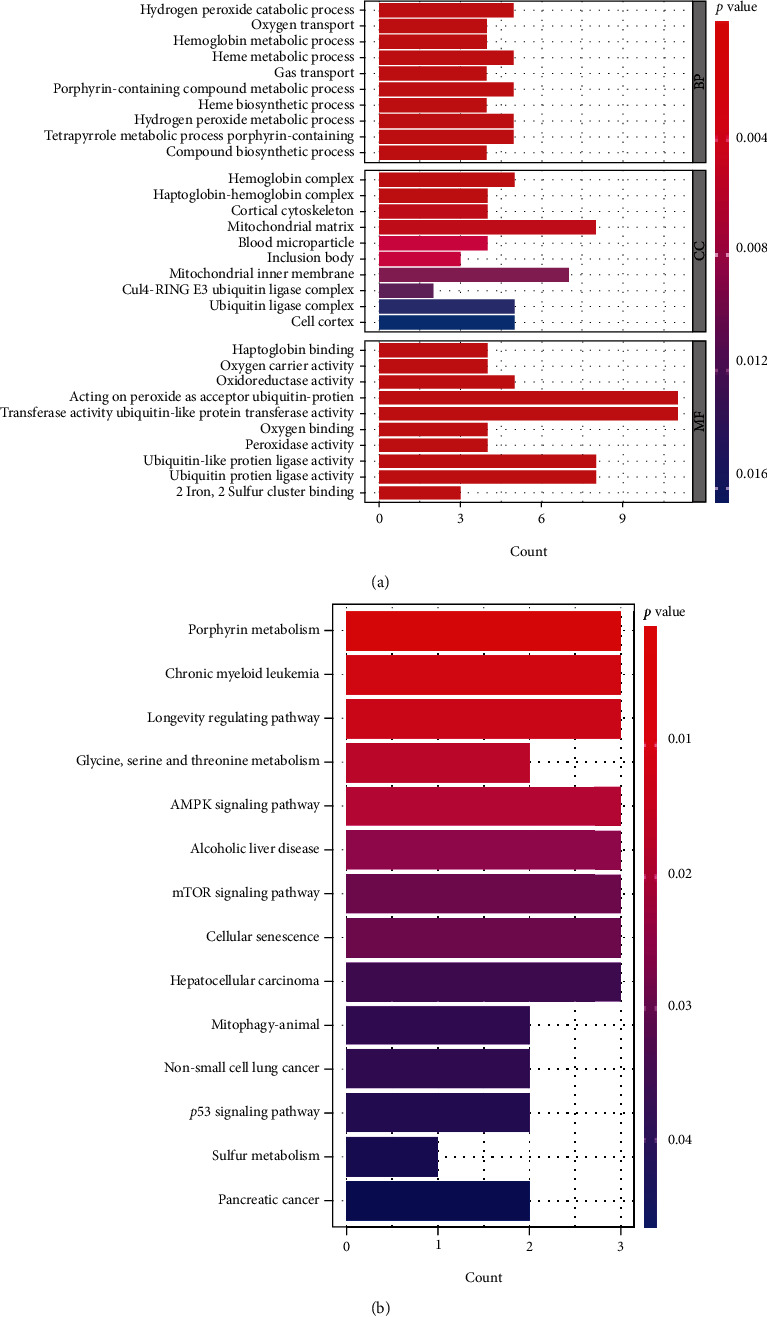
GO and KEGG analyses of 104 DEGs. (a) Barplot displayed the potential mechanism underlying the effect of the 104 m6A-related Differentially Expressed Genes (DEGs) on the occurrence and development of AS. (b) The significant KEGG pathways of these m6A-related genes and DEGs.
Figure 10.
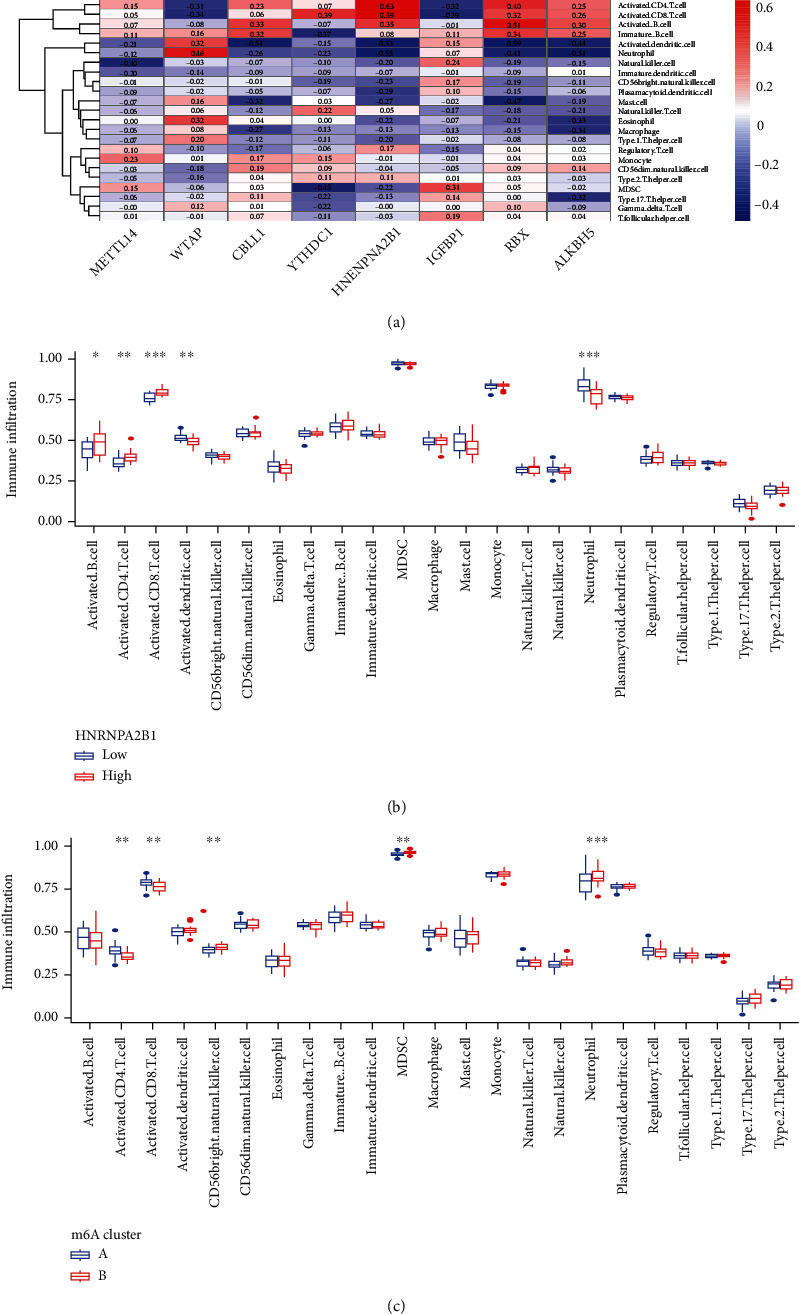
Single sample gene set enrichment analysis. (a) Correlation between infiltrating immune cells and the 8 significant RNA N6-methyladenosine regulators. (b) Differences in the abundance of infiltrating immune cells between high and low HNRNPA2B1 expression groups. (c) Differential immune cell infiltration between m6A cluster A and m6A cluster B. ∗p < 0.05, ∗∗p < 0.01, and ∗∗∗p < 0.001.
Figure 11.
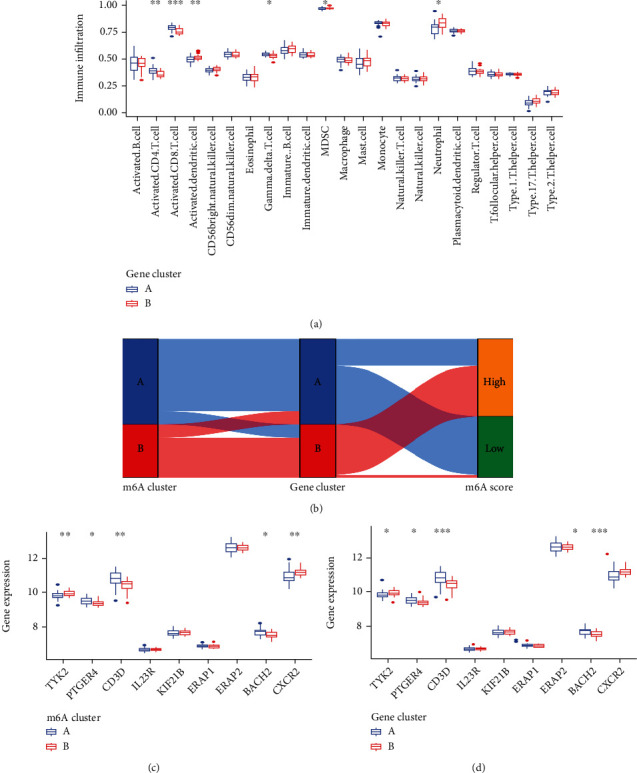
Role of RNA N6-methyladenosine (m6A) patterns in distinguishing AS. (a) Differential immune cell infiltration between gene cluster A and gene cluster B. (b) Sankey diagram showing the relationship between m6A patterns, m6A gene patterns, and m6A scores. (c) Differential expression levels of TYK2, PTGER4, CD3D, IL23R, KIF21B, ERAP1, ERAP2, BACH2, and CXCR2 between cluster A and cluster B. (d) Differential expression levels of TYK2, PTGER4, CD3D, IL23R, KIF21B, ERAP1, ERAP2, BACH2, and CXCR2 between gene cluster A and gene cluster B. ∗p < 0.05, ∗∗p < 0.01, and ∗∗∗p < 0.001.
3.8. Role of m6A Patterns in Distinguishing AS
We explored the correlation between m6A patterns and risk genes in order to obtain a better understanding of the association between m6A patterns and AS (Figures 11(c) and 11(d)). We noticed that the expression levels of CD3D, PTGER4, and BACH2 were significantly higher in cluster A or gene cluster A than those in cluster B or gene cluster B, indicating that cluster A or gene cluster A may be strongly associated with AS.
4. Discussion
AS is a complex and potentially debilitating disease with an insidious onset, which would progress to radiation sacroiliitis in several years. According to the research papers published in recent years, m6A regulators reportedly play an important role in biological processes. However, the role of m6A regulators in AS remains unknown.
Through differential expression analyses, we identified eight significant m6A regulators among 21 m6A regulators in AS patients and non-AS patients. Eight candidate m6A regulators (WTAP, YTHDC1, CBLL1, HNRNPA2B1, METTL14, RBMX, ALKBH5, and IGFBP1) were extracted from the RF model to predict the occurrence of AS. Following that, we made a nomogram based on the eight candidate m6A regulators, and we used the DCA curve to see how the nomogram model benefited the AS patients.
m6A is a methylated modification generated by methylating the sixth position N of adenine on messenger RNA (mRNA) using a methyltransferase complex (MTC) [28, 29]. WTAP is a nuclear protein that functions as the partner of Wilms' tumor 1 (WT1) [30]. WTAP deletion has been verified to be embryonically fatal [31], indicating its critical biological role in vertebrate development. Meanwhile, as an important part of the MTC, WTAP can promote the formation of m6A [32]. Within the cytoplasm, YTHDF1 promotes the initiation of translation and the decay of m6A-dependent mRNA. Within the nucleus, it binds to m6A-modified RNAs and facilitates splice site selection [33]. CBLL1 is an evolutionarily conserved E3 ubiquitin ligase containing a RING-finger domain, and extensive studies have demonstrated that CBLL1 plays an important role in tumorigenesis [34]. HNRNPA2B1 regulates Wnt signaling transcriptional activity by regulating the stability of TCF7L2 mRNA, and it is related to tumor growth [24, 35]. Mass spectrometry has shown that METTL14 works to make m6A methylation, and it can form a stable heterodimer. METTL14 is a key RNA-binding scaffold that plays a crucial role in recognition of substrate RNAs [36]. RBMX was initially identified as a component of the spliceosome and is involved in alternative splicing. RBMX has been rediscovered in recent years to participate in DNA damage repair, sister chromatid cohesion, and the assembly of higher-order ribonucleoprotein complexes [37–40]. Human AlkB homolog H5 (ALKBH5) could demethylate long noncoding RNAs, promote cancer cell self-renewal, or regulate autophagy in malignancies, playing a fundamental role in noncancerous reproductive system illnesses in humans [41]. Insulin-like growth factor binding protein-1 (IGFBP-1) is a member of the insulin-like growth factor (IGF) system. IGFBP-1's biological effects in cancer have been discovered to be reliant on its phosphorylation status, as well as on IGF-dependent and -independent pathways [42]. Increasing studies have proved that the eight m6A regulators have a correlation with the occurrence of cancer. However, no reports are available on the relationship between the eight candidates m6A regulators and AS. We hope that the selected eight distinct m6A regulators can provide a direction for future clinical research.
Furthermore, two clusters were divided based on the eight distinct m6A regulators. Compared with cluster B, ALKBH5 and FTO showed higher expression levels in cluster A in our study. Then PCA was established to distinguish the m6A patterns. Additionally, 104 DEGs were obtained based on the two m6A clusters, GO terms, and KEGG pathway analysis. This study revealed that 104 m6A-related DEGs mainly concentrated in the processes of heme metabolic, porphyrin containing compound metabolic, tetrapyrrole metabolic, hydrogen peroxide metabolic, hydrogen peroxide catabolic, the modification of mitochondrial matrix, mitochondrial inner membrane and hemoglobin complex, the activity of ubiquitin-protein transferase, ubiquitin-protein ligase, and oxidoreductase. Moreover, KEGG analysis demonstrated that DEGs mainly concentrated in porphyrin metabolism, longevity regulating pathway, glycine, serine and threonine metabolism, mTOR signaling pathway, as well as p53 signaling pathway. Besides, we further divided the AS patients into two genomic subtypes (gene cluster A and gene cluster B) based on the 104 DEGs. Then, the m6A score for each sample was calculated by using PCA algorithms, and comparisons were made between the significant m6A gene clusters and m6A clusters. The results showed that the m6A score in cluster A or gene cluster A was higher than that in cluster B or gene cluster B.
AS is a chronic inflammatory disease of unknown etiology in which the innate immune system plays a dominant role and is characterized by abnormal activation of innate immune cells. When considering the ssGSEA analysis, we also discovered that the two significant m6A patterns were consistent with activated CD4 T cell immunity, activated CD8 T cell immunity, and MDSC immunity. The immunity of MDSC, on the other hand, has been linked to immunosuppressive functions [43]. In the previous studies, several risk genes (TYK2, BACH2, IL6R, IL7R, IL12B, IL27, NKX2, and PTGER4) play a vital role in the development of AS. Cluster A was found to be more associated with activated CD4 T cell immunity, activated CD8 T cell immunity, and lower MDSC immune infiltration, compared with cluster B, which implied that cluster A may be related to AS.
In short, we used the consensus clustering method to discover two m6A patterns (cluster A and cluster B) based on the eight significant m6A regulators and to identify two gene patterns (gene cluster A and gene cluster B) based on the 104 DEGs. Cluster A and gene cluster A were found to be enriched in activated CD4 T cell immunity, activated CD8 T cell immunity, and MDSC immunity by ssGSEA, implying that cluster A and gene cluster A may be associated with AS. Then m6Ascore was calculated based on the m6A modification, and the Sankey diagram was used to attribute changes among m6A clusters, m6A gene clusters, and m6A score.
Currently, there are few articles on the relationship between m6A regulators and AS, therefore, our findings have provided novel ideas for identifying different AS phenotypes and promoting personalized diagnosis in the future. The aim of our study is to find out more about the role of m6A regulators in AS. However, there are still some limitations in our study. For instance, our model is not validated in an independent data set due to a lack of datasets with m6A regulators in the public database. Another problem is that our clinical data is relatively incomplete. Moreover, the sample data we utilized for our study are obtained retrospectively, so all analyses are conducted on public databases. Inevitably, the research outcomes might have been partial as a result of the inherent case selection bias. To confirm our results, larger prospective studies as well as in vitro and vivo experiments are needed.
5. Conclusion
To conclude, we build in our research a nomogram model that accurately predicts the occurrence of AS by using eight distinct m6A regulators. Additionally, we find two significant m6A patterns and two gene clusters based on eight important m6A regulators and DEGs, and our research findings show that cluster A and gene cluster A may be associated with AS. Our work offers a foundation for further research on various AS phenotypes, providing more insight into the future diagnosis and treatment of AS.
Acknowledgments
This study was supported by the National Natural Science Foundation of China (Grant No. 82171372), Medical Scientific Research Foundation of Guangdong Province of China (No. A2019217), and Science and Technology Project of Jiangmen City (2021YL03002). We thank the authors who provided the GEO public datasets and Hao-shuai Yang for his help in our article.
Abbreviations
- AS:
Ankylosing spondylitis
- GEO:
Gene Expression Omnibus
- HLA:
Human Leukocyte Antigen
- ROC:
Receiver operating characteristic curve
- AUC:
Area under control
- GO:
Gene ontology
- KEGG:
Kyoto encyclopedia of genes and genomes
- PCA:
Principal components analysis
- DCA:
Decision curve analysis
- RF:
Random forest
- SVM:
Support vector machine
- SPA:
Spondyloarthropathies
- DEG:
Differentially expressed genes
- ssGSEA:
Single sample gene set enrichment analysis
- m6A:
N6-methyladenosine
Data Availability
Data generated or used in this study are available from the corresponding author upon reasonable request.
Conflicts of Interest
The authors declare that there is no conflict of interest regarding the publication of this paper.
Authors' Contributions
Cheng Zhong and Jia-hua Liang contributed equally to this work. Da-xiang Jin and Yu-ming Li are both assigned in study supervision. All authors read and approved the final manuscript.
References
- 1.Sieper J., Poddubnyy D. Axial spondyloarthritis. Lancet . 2017;390(10089):73–84. doi: 10.1016/S0140-6736(16)31591-4. [DOI] [PubMed] [Google Scholar]
- 2.Wang R., Ward M. M. Epidemiology of axial spondyloarthritis: an update. Current Opinion in Rheumatology . 2018;30(2):137–143. doi: 10.1097/BOR.0000000000000475. [DOI] [PMC free article] [PubMed] [Google Scholar]
- 3.Ebrahimiadib N., Berijani S., Ghahari M., Pahlaviani F. G. Ankylosing spondylitis. Journal of Ophthalmic & Vision Research . 2021;16(3):462–469. doi: 10.18502/jovr.v16i3.9440. [DOI] [PMC free article] [PubMed] [Google Scholar]
- 4.Goodman S. M., Springer B., Guyatt G., et al. 2017 American College of Rheumatology/American association of hip and knee surgeons guideline for the perioperative management of antirheumatic medication in patients with rheumatic diseases undergoing elective total hip or total knee arthroplasty. Arthritis & Rhematology . 2017;69(8):1538–1551. doi: 10.1002/art.40149. [DOI] [PubMed] [Google Scholar]
- 5.Colbert R. A. Classification of juvenile spondyloarthritis: enthesitis-related arthritis and beyond. Nature Reviews Rheumatology . 2010;6(8):477–485. doi: 10.1038/nrrheum.2010.103. [DOI] [PMC free article] [PubMed] [Google Scholar]
- 6.Taurog J. D., Chhabra A., Colbert R. A. Ankylosing spondylitis and axial spondyloarthritis. The New England Journal of Medicine . 2016;374(26):2563–2574. doi: 10.1056/NEJMra1406182. [DOI] [PubMed] [Google Scholar]
- 7.Golder V., Schachna L. Ankylosing spondylitis: an update. Australian Family Physician . 2013;42(11):780–784. [PubMed] [Google Scholar]
- 8.Khan M. A. An overview of clinical spectrum and heterogeneity of spondyloarthropathies. Rheumatic Diseases Clinics of North America . 1992;18(1):1–10. [PubMed] [Google Scholar]
- 9.Brown M. A., Wordsworth B. P., Reveille J. D. Genetics of ankylosing spondylitis. Clinical and Experimental Rheumatology . 2002;20(6 Suppl 28):S43–S49. [PubMed] [Google Scholar]
- 10.Reveille J. D. Genetics of spondyloarthritis—beyond the MHC. Nature Reviews Rheumatology . 2012;8(5):296–304. doi: 10.1038/nrrheum.2012.41. [DOI] [PubMed] [Google Scholar]
- 11.Reveille J. D., Ball E. J., Khan M. A. Hla-B27 and genetic predisposing factors in spondyloarthropathies. Current Opinion in Rheumatology . 2001;13(4):265–272. doi: 10.1097/00002281-200107000-00004. [DOI] [PubMed] [Google Scholar]
- 12.Zhang Z., Dai D., Yu K., et al. Association of Hla-B27 and Erap1 with ankylosing spondylitis susceptibility in Beijing Han Chinese. Tissue Antigens . 2014;83(5):324–329. doi: 10.1111/tan.12334. [DOI] [PubMed] [Google Scholar]
- 13.Yang C., Dong Z., Ling Z., Chen Y. The crucial mechanism and therapeutic implication of RNA methylation in bone pathophysiology. Ageing Research Reviews . 2022;79, article 101641 doi: 10.1016/j.arr.2022.101641. [DOI] [PubMed] [Google Scholar]
- 14.Gracey E., Hromadová D., Lim M., et al. Tyk2 inhibition reduces type 3 immunity and modifies disease progression in murine spondyloarthritis. The Journal of Clinical Investigation . 2020;130(4):1863–1878. doi: 10.1172/JCI126567. [DOI] [PMC free article] [PubMed] [Google Scholar]
- 15.Dendrou C. A., Cortes A., Shipman L., et al. Resolving Tyk2 locus genotype-to-phenotype differences in autoimmunity. Science Translational Medicine . 2016;8(363):p. 363ra149. doi: 10.1126/scitranslmed.aag1974. [DOI] [PMC free article] [PubMed] [Google Scholar]
- 16.Snelgrove T., Lim S., Greenwood C., et al. Association of toll-like receptor 4 variants and ankylosing spondylitis: a case-control study. The Journal of Rheumatology . 2007;34(2):368–370. [PubMed] [Google Scholar]
- 17.Vecellio M., Cohen C. J., Roberts A. R., Wordsworth P. B., Kenna T. J. Runx3 and T-Bet in immunopathogenesis of ankylosing spondylitis-novel targets for therapy? Frontiers in Immunology . 2019;9:p. 3132. doi: 10.3389/fimmu.2018.0313. [DOI] [PMC free article] [PubMed] [Google Scholar]
- 18.Smith J. A., Colbert R. A. Review: the interleukin-23/interleukin-17 axis in spondyloarthritis pathogenesis: Th17 and beyond. Arthritis & Rhematology . 2014;66(2):231–241. doi: 10.1002/art.38291. [DOI] [PMC free article] [PubMed] [Google Scholar]
- 19.Reed M. D., Dharmage S., Boers A., Martin B. J., Buchanan R. R., Schachna L. Ankylosing spondylitis: an Australian experience. Internal Medicine Journal . 2008;38(5):321–327. doi: 10.1111/j.1445-5994.2007.01471.x. [DOI] [PubMed] [Google Scholar]
- 20.Lee M., Kim B., Kim V. N. Emerging roles of RNA modification: m6A and u-tail. Cell . 2014;158(5):980–987. doi: 10.1016/j.cell.2014.08.005. [DOI] [PubMed] [Google Scholar]
- 21.Jonkhout N., Tran J., Smith M. A., Schonrock N., Mattick J. S., Novoa E. M. The Rna modification landscape in human disease. RNA . 2017;23(12):1754–1769. doi: 10.1261/rna.063503.117. [DOI] [PMC free article] [PubMed] [Google Scholar]
- 22.Shulman Z., Stern-Ginossar N. The RNA modification _N_ 6-methyladenosine as a novel regulator of the immune system. Nature Immunology . 2020;21(5):501–512. doi: 10.1038/s41590-020-0650-4. [DOI] [PubMed] [Google Scholar]
- 23.Luo J., Xu T., Sun K. N6-Methyladenosine RNA modification in inflammation: roles, mechanisms, and applications. Frontiers in Cell and Development Biology . 2021;9, article 670711 doi: 10.3389/fcell.2021.670711. [DOI] [PMC free article] [PubMed] [Google Scholar]
- 24.Jiang X., Liu B., Nie Z., et al. The role of M6a modification in the biological functions and diseases. Signal Transduction and Targeted Therapy . 2021;6(1):p. 74. doi: 10.1038/s41392-020-00450-x. [DOI] [PMC free article] [PubMed] [Google Scholar]
- 25.Dai B., Sun F., Cai X., Li C., Liu H., Shang Y. Significance of Rna N6-methyladenosine regulators in the diagnosis and subtype classification of childhood asthma using the Gene Expression Omnibus Database. Frontiers in Genetics . 2021;12, article 634162 doi: 10.3389/fgene.2021.634162. [DOI] [PMC free article] [PubMed] [Google Scholar]
- 26.Sotiriou C., Wirapati P., Loi S., et al. Gene expression profiling in breast cancer: understanding the molecular basis of histologic grade to improve prognosis. Journal of the National Cancer Institute . 2006;98(4):262–272. doi: 10.1093/jnci/djj052. [DOI] [PubMed] [Google Scholar]
- 27.Zeng D., Li M., Zhou R., et al. Tumor microenvironment characterization in gastric cancer identifies prognostic and immunotherapeutically relevant gene signatures. Cancer Immunology Research . 2019;7(5):737–750. doi: 10.1158/2326-6066.CIR-18-0436. [DOI] [PubMed] [Google Scholar]
- 28.Fu Y., Dominissini D., Rechavi G., He C. Gene expression regulation mediated through reversible M6a Rna methylation. Nature Reviews. Genetics . 2014;15(5):293–306. doi: 10.1038/nrg3724. [DOI] [PubMed] [Google Scholar]
- 29.Deng X., Su R., Feng X., Wei M., Chen J. Role of _N_ 6-methyladenosine modification in cancer. Current Opinion in Genetics & Development . 2018;48:1–7. doi: 10.1016/j.gde.2017.10.005. [DOI] [PMC free article] [PubMed] [Google Scholar]
- 30.Little N. A., Hastie N. D., Davies R. C. Identification of Wtap, a novel Wilms’ tumour 1-associating protein. Human Molecular Genetics . 2000;9(15):2231–2239. doi: 10.1093/oxfordjournals.hmg.a018914. [DOI] [PubMed] [Google Scholar]
- 31.Horiuchi K., Umetani M., Minami T., et al. Wilms’ tumor 1-associating protein regulates G2/M transition through stabilization of cyclin A2 Mrna. Proceedings of the National Academy of Sciences of the United States of America . 2006;103(46):17278–17283. doi: 10.1073/pnas.0608357103. [DOI] [PMC free article] [PubMed] [Google Scholar]
- 32.Zhang S. Y., Zhang S. W., Liu L., Meng J., Huang Y. M6a-driver: identifying context-specific Mrna M6a methylation-driven gene interaction networks. PLoS Computational Biology . 2016;12(12, article e1005287) doi: 10.1371/journal.pcbi.1005287. [DOI] [PMC free article] [PubMed] [Google Scholar]
- 33.Roundtree I. A., Luo G. Z., Zhang Z., et al. Ythdc1 mediates nuclear export of N6-methyladenosine methylated Mrnas. Elife . 2017;6 doi: 10.7554/eLife.31311. [DOI] [PMC free article] [PubMed] [Google Scholar]
- 34.Hui L., Zhang S., Wudu M., et al. Cbll1 is highly expressed in non-small cell lung cancer and promotes cell proliferation and invasion. Thorac Cancer . 2019;10(6):1479–1488. doi: 10.1111/1759-7714.13097. [DOI] [PMC free article] [PubMed] [Google Scholar]
- 35.Liu H., Li D., Sun L., et al. Interaction of Lncrna Mir100hg with Hnrnpa2b1 facilitates m6A-dependent stabilization of Tcf7l2 Mrna and colorectal cancer progression. Molecular Cancer . 2022;21(1):p. 74. doi: 10.1186/s12943-022-01555-3. [DOI] [PMC free article] [PubMed] [Google Scholar]
- 36.Zhou H., Yin K., Zhang Y., Tian J., Wang S. The Rna M6a writer Mettl14 in cancers: roles, structures, and applications. Biochimica Et Biophysica Acta. Reviews on Cancer . 2021;1876(2, article 188609) doi: 10.1016/j.bbcan.2021.188609. [DOI] [PubMed] [Google Scholar]
- 37.Adamson B., Smogorzewska A., Sigoillot F. D., King R. W., Elledge S. J. A genome-wide homologous recombination screen identifies the Rna-binding protein Rbmx as a component of the DNA-damage response. Nature Cell Biology . 2012;14(3):318–328. doi: 10.1038/ncb2426. [DOI] [PMC free article] [PubMed] [Google Scholar]
- 38.Matsunaga S., Takata H., Morimoto A., et al. Rbmx: a regulator for maintenance and centromeric protection of sister chromatid cohesion. Cell Reports . 2012;1(4):299–308. doi: 10.1016/j.celrep.2012.02.005. [DOI] [PubMed] [Google Scholar]
- 39.Munschauer M., Nguyen C. T., Sirokman K., et al. The NORAD lncRNA assembles a topoisomerase complex critical for genome stability. Nature . 2018;561(7721):132–136. doi: 10.1038/s41586-018-0453-z. [DOI] [PubMed] [Google Scholar]
- 40.Zheng T., Zhou H., Li X., et al. Rbmx is required for activation of Atr on repetitive Dnas to maintain genome stability. Cell Death and Differentiation . 2020;27(11):3162–3176. doi: 10.1038/s41418-020-0570-8. [DOI] [PMC free article] [PubMed] [Google Scholar]
- 41.Wang J., Wang J., Gu Q., et al. The biological function of M6a demethylase Alkbh5 and its role in human disease. Cancer Cell International . 2020;20(1):p. 347. doi: 10.1186/s12935-020-01450-1. [DOI] [PMC free article] [PubMed] [Google Scholar]
- 42.Lin Y. W., Weng X. F., Huang B. L., Guo H. P., Xu Y. W., Peng Y. H. Igfbp-1 in cancer: expression, molecular mechanisms, and potential clinical implications. American Journal of Translational Research . 2021;13(3):813–832. [PMC free article] [PubMed] [Google Scholar]
- 43.Solito S., Marigo I., Pinton L., Damuzzo V., Mandruzzato S., Bronte V. Myeloid-derived suppressor cell heterogeneity in human cancers. Annals of the New York Academy of Sciences . 2014;1319(1):47–65. doi: 10.1111/nyas.12469. [DOI] [PubMed] [Google Scholar]
Associated Data
This section collects any data citations, data availability statements, or supplementary materials included in this article.
Data Availability Statement
Data generated or used in this study are available from the corresponding author upon reasonable request.


