

Abstract
In recent days, Cognitive Cyber-Physical System (CCPS) has gained significant interest among interdisciplinary researchers which integrates machine learning (ML) and artificial intelligence (AI) techniques. This era is witnessing a rapid transformation in digital technology and AI where brain-inspired computing-based solutions will play a vital role in industrial informatics. The application of CCPS with brain-inspired computing in Industry 4.0 will create a significant impact on industrial evolution. Though the CCPSs in industrial environment offer several merits, security remains a challenging design issue. The rise of artificial intelligence AI techniques helps to address cybersecurity issues related to CCPS in industry 4.0 environment. With this motivation, this paper presents a new AI-enabled multimodal fusion-based intrusion detection system (AIMMF-IDS) for CCPS in industry 4.0 environment. The proposed model initially performs the data pre-processing technique in two ways namely data conversion and data normalization. In addition, improved fish swarm optimization based feature selection (IFSO-FS) technique is used for the appropriate selection of features. The IFSO technique is derived by the use of Levy Flight (LF) concept into the searching mechanism of the conventional FSO algorithm to avoid the local optima problem. Since the single modality is not adequate to accomplish enhanced detection performance, in this paper, a weighted voting based ensemble model is employed for the multimodal fusion process using recurrent neural network (RNN), bi-directional long short term memory (Bi-LSTM), and deep belief network (DBN), depicts the novelty of the work. The simulation analysis of the presented model highlighted the improved performance over the recent state of art techniques interms of different measures.
Keywords: Artificial intelligence, Industry 4.0. cognitive cyber physical system, Cognitive computing, Security, Intrusion detection system
Introduction
In recent times, Cognitive Cyber Physical Systems (CCPS) are observing in rapid conversion as a digital technology which combines physical component and computing devices for enabling the AI based resolutions. CCPS is incorporating ML or AI by neuroscience in achieving smart systems. It plays a major part in industrial informatics. The CCPS application in the industrial revolution Industry 4.0 has created smart factories in industrial growth. Other applications such as medical systems, smart households, robotic systems, and autonomous driving systems utilize data analytics, cloud computing, connected devices, AI for automating the additional processes. This enabling technology has sufficient capacity for providing Information transparency, Interoperability, decentralized decision, and Technical assistance. Figure 1 depicts the process of intrusion detection in CPS (Luo et al. 2021).
Fig. 1.

Intrusion detection in CPS
Competitive business platforms, mass globalization, and customization are making “conventional” industries for adopting novel business modules and shifts toward Industry 4.0 (Aiello et al. 2020; Oztemel and Gursev 2020). Industry 4.0 technology could be considered as the novel revolution in manufacturing that aim is to attain a maximal output and efficiency using minimal resource usage. Industry 4.0 technology has carried a novel manufacturing trend in industry that intended at efficient resource usage for maximal output. “Digital manufacturing”/ “Smart manufacturing” could be considered as the essence of Industry 4.0 that permits industry to execute flexible manufacturing processes through IoT, mass customization (Machado et al. 2020). It can be assumed that Industry 4.0 technology would assist in improving the economic and social sustainability of the organization. Industry 4.0 technology has a significant ability for sustainable value creation through social, economic, and environmental dimensions of sustainability by enhancing resource performance (Sousa Jabbour et al. 2018).
Need AI based intrusion detection in CCPS
Artificial intelligence (AI) is now altering their society and economy, and the improved AI decision making has activated that discussed on the possible problems and should create AI decision making more transparent (Radanliev et al. 2020). Though, using self-building technologies, present technological developments are possible. Cognitive frameworks demonstrating truly intelligent human like efficiency, which contains ‘personality, motivation, emotion, etc.,’ are also potential (Sun 2020). These internet enabled industries are the main targets of Cyber Security (CS) threat, and it is one of the major problems that should be addressed. Regarding this I4.0, CS performs a major part in preserving organizational competitiveness. Consider the complexity of current CPS, problems of assuring the safety and security of these schemes are at higher significance. The possible threats could be interrelated to a cyber, physical, or both dimensions of CPS and it needs complex methods for mitigation and identification of safety and security susceptibilities.
Intrusion Detection (ID) is one of the significant applications for maximizing integrity in CPS. For preventing these attacks, Intrusion Detection System (IDS) is effectively employed. The basic ID was introduced by Anderson in 1980. Succeeded by, huge researches have been established on IDS. The IDS methods are classified into two main groups as Anomaly and Misuse predictions. Firstly, features of familiar attacks are employed for predicting misuse. In this regard, the inspected data are interrelated to the database, and it is stated as intrusion. Misuse detectors produce minimal FP; however, this class of detectors is embedded by huge constraints. Some of the prediction methods are based on clustering methods. In recent times, AI approaches have been widely employed in anomaly predictions. The anomaly detection methods are defined as wavelet, NN, and GA. Prior studies on IDS consider anomaly prediction and misuse detection. Usually, misuse and anomaly prediction methods are implanted by major merits and demerits. Prior IDS are employed to identify the misuse or anomaly attacks. Simultaneous misuse and anomaly IDS have been introduced for solving the constraints.
Paper contribution
This paper presents a new AI-enabled multimodal fusion-based intrusion detection system (AIMMF-IDS) for CCPS in industry 4.0 environment. The AIMMF-IDS technique involves different processes namely pre-processing, feature selection, and fusion based classification. Besides, improved fish swarm optimization based feature selection (IFSO-FS) technique is used for the appropriate selection of features. The IFSO technique is derived by the use of Levy Flight (LF) concept into the searching mechanism of the conventional FSO algorithm to avoid the local optima problem. Finally, a weighted voting based ensemble model is employed for the multimodal fusion process using recurrent neural network (RNN), bidirectional long short term memory (Bi-LSTM), and deep belief network (DBN). For evaluating the enhanced outcomes of the AIMMF-IDS model, extensive experiments are performed and the results are investigated interms of several measures.
Paper organization
The upcoming sections of the paper are planned as follows. Section 2 elaborates the prior IDS models in CCPS. Next, Sect. 3 outlines the design of AIMMF-IDS model and Sect. 4 validates its performance. Lastly, Sect. 5 draws the conclusion.
Literature review
Moustafa et al. (2018) address these problems by suggesting a novel threat intelligence system that designs the dynamic interaction of industry 4.0 component with physical and network schemes. The smart data management modules handle heterogeneous data sources, most basic needs for communicating with an Industry 4.0 scheme. It contains data to and from actuators, sensors, and network traffic. The projected threat intelligence method is implemented on the basis of beta mixture hidden Markov models (MHMMs) to discover anomalous actions over physical and network schemes. Jiang (2018) proposed the 8C framework by including 3C facet to the 5C framework. The 3C facet contains customer, content, and coalition. The projected 8C framework is a useful principle for building cyber physical scheme for smart factories. They show an instance of developing and designing, based on the projected 8C framework, a smart factory cyber physical scheme includes an Industrial IoT gateway and a smart factory data centre run in the cloud platform.
de Araujo-Filho et al. (2020) proposed FID GAN, a new fog based, unsupervised IDS for CPS utilizing GAN. The IDS is projected for a fog framework that carries computational resources nearer to the end nodes and hence gives to meet lower latency needs. For attaining high detection rates, the projected framework calculates a recreation loss on the basis of recreation of data instance mapping to the latent space. Thakur et al. (2021) presented a module that extracts beneficial features from the provided features and later utilizes DL method for classifying the intrusions. It should be notice that primary data points could not be considered as sampled from a similar distribution, rather from 2 distinct distributions—one is common to every network intrusions, and another is certain to the field. Jagtap and Subramaniyaswamy (2021) proposed a smart multi level IDS for detecting data abnormalities in process control network packets. The projected method contains (i) Bloom filter based payload level detections, (ii) partition based Kohonen mapping to learn abnormal data pattern by deep version of Kohonen NN improved by PCA and separating feature of Hypergraph, and (iii) BLOSOM a hybrid anomaly detection module.
Li et al. (2020) proposed a new federated DL system, called DeepFed, for detecting cyber threats towards industrial CPS. In specific, they initially designed a novel DL based IDS for industrial CPS, using a CNN and gated recurrent unit. Next, they established a federated learning architecture, permitting multiple industrial CPSs for collectively structure a complete IDS in a privacy preserving manner. In Khalili et al. (2018), a State based IDS (SIDS) is presented for detecting every 3 anomalies. To do this, first SIDS manually extract the usual behaviour of CPS. Later, it monitor present CPS behaviour and detect intrusion by directly searching the data of field layer. A small scale then real CPS (a mixer procedure) is given for illustrating the SIDS tasks.
In (Althobaiti et al. 2021), an effective cognitive computing dependent IDS model is derived to accomplish security in industrial CPS. The presented model derives a new binary bacterial foraging optimization (BBFO) technique for the optimal selection of features. Moreover, the gated recurrent unit (GRU) based intrusion detection model is derived for industrial CPS platform. In (Li et al. 2017), a new distributed host-based collaborative technique has been presented and conjunctive rule based majority voting approach is derived to identify the false measurement data injected by compromised phasor measurement unit (PMU) in a collaborative way. Besides, a new reputation model with adaptive reputation updating model is derived for evaluating the total running condition of the PMUs. Kwon et al. (2020) designed an IDS for an IEEE 1815.1 power system by the use of CPS. A bidirectional recurrent neural network is used to identify the existence of anomalies and a verification process take place under several aspects.
Design of AIMMF-IDS model
This study has developed a new AIMMF-IDS model to detect intrusions in the industry 4.0 environment. The working process of the AIMMF-IDS model involves different stages of operations. At the first stage, the input data is pre-processed in two levels namely data conversion and data normalization. Next, at the second stage, the IFSO-FS technique gets executed to choose an optimal set of features. Finally, in the third stage, the multimodal fusion process is involved to determine the intrusion in the network. The detailed working of each stage is offered in the next subsections.
Stage 1: data pre-processing
In this stage, the data is pre-processed in two levels namely data conversion and data normalization. During the data conversion process, the input data in.xls format is converted into.csv format. Besides, data normalization is performed using the min–max approach, where the maximum as well as minimum values are considered from the available data. It intends to the normalization of samples to a lower value of 0 and higher value of 1. It can be represented using Eq. (1).
| 1 |
Stage 2: IFSO based feature selection process
At this stage, the IFSO algorithm is primarily designed and is employed for the selection of features from the preprocessed data. The fish live in groups without a leader, though, it has self-organized and capability for accepting data regarding the atmosphere using a sense organ. Later, the fish perform a stimulating reaction with the control of tail and fin for finding the regions that have a higher focus of feed. This condition stimulated Li in 2002 for proposing FSA (Li 2002). Depending upon the projected FSA, technically FSA is made by 2 major elements. They are functions and parameters that are interrelated to the behavior of fish and nearby factors. The parameter includes the size of fish motion (Step), the visual distance of fish individual (Visual), the crowd factor of fish and distance among the 2 fish represents the and , whereas and . denotes an individual state in fish population and indicates feed focus value/objective functions. Visual and Step performed a major part amongst the 4 parameters. The greater the value of parameters, FSA move quicker to a global optimal since the fish could examine largest space near them and move largest step in all the iterations.
At the same time, with the determination of smaller value of both parameters, the local search procedure is highly accurate and stable. The three behavior of fish includes Swarm, Search and Follow are transformed as fundamental functions in FSA. When the fish identifies an area using a higher concentration of food, it would directly move towards that area. After one fish find out more food, another fish would share with it. In FSA adaption, when there is another situation has a high attention of feed compare to present situation, the fish would move towards it. Swarm performance, fish tends to swarm obviously for avoiding the risk and assurance the presence of colony. The visual and step values have huge impact on the fish behavior. For instance, once the size of Visual is narrow, the swarm and search behaviors are controlled (Dabba et al. 2020). The fish tend to seek higher feed focus in the Visual. Later, the swarm performance would determine whether it moves towards or not. Greater the values of Visual and Step, a quicker global optimum was attained. This idea inspires the researcher for employing FSA to resolve various optimization problems in many study fields. Lately, FSA has implemented aggressively in classification, FS, and prediction. The condition vector of fish swarm is given by
| 2 |
whereas, denotes the fish and the visual positions are denoted by
| 3 |
whereas, denotes the fish position in Visual. The aforementioned operations (1), (2) have functioned as follows:
| 4 |
While indicates the state of fish in Visual.
| 5 |
whereas, denotes the following fish in Visual. To aforementioned formulas, Eq. (2) signifies the condition of fish, and Eq. (3) denotes the fish place in Visual. Equation (4) indicates how Eqs. (2) and (3) working together, and it illustrates the coward factor in FSA. Equation (5) displays the following fish is defined using the distance among the 2 fishes and the value of Step. Later the fish’s behavior represents the function in FSA would be managed as shown in Eqs. (6) to (10).
| 6 |
where Search Functions represent search behaviour. If then (7) is performed. Then, denotes the present food concentration and indicates the following food concentration.
| 7 |
Otherwise, Perform (6) by arbitrarily choose a state and examine the outcome with the help of (7). When it doesn’t fulfill even afterward number, ( Search Function) afterward it move a step arbitrarily that makes it flee from the local extreme values by (8).
| 8 |
| 9 |
whereas, Swarm Functions represent swarm behaviour. Perform (9) when it fulfilled the entire states. The present state of point is ( Visual), otherwise execute Search Function:
- ; denotes the central food concentration
whereas, Follow Functions represent follow behaviour. Perform (10) when fulfilled the entire states, otherwise execute Search Function: The present state of point is Visual), , and . Follow behavior, Search and swarm behavior are denoted in Eqs. (6), (9), and (10) correspondingly. They would be implemented after the interrelated states are satisfied. Or else Eqs. (7) and (8) are performed. The procedure repeats till the conditions are satisfied by repeating the Eq. (6). The procedure would be continued till the optimum point attained. If the conditions are fulfilled, the present optimum value depends upon the outcome attained would be upgraded. Lastly, when the end criteria are satisfied, the last results are recorded. Figure 2 displays the flowchart of FSO about Eqs. (2) to (10).10
Fig. 2.
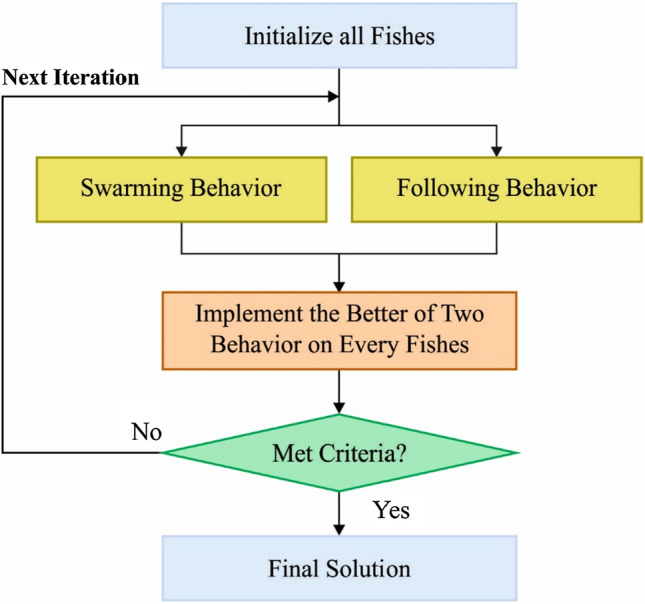
Flowchart of FSO algorithm
In order to avoid trapping into local optimal, the FSA is combined with the LF concept in the searching process and designed the IFSA. Here, a key concept of mapping how FS problem to the optimization problem and be resolved by executing IFSA. In optimization problem, predefined amount of variables is a mandatory procedure. Variables in optimization are equivalent to FS features. Different from the optimization problem, the amount of features isn’t set in a subset. The execution of IFSA in FS could be separated into 4 major performances; initiation, evaluation of the fitness, augmentation step of fish swarm, and output of the optimum feature subsets. The initiation of feature subset of all the fish consists of 2 major phases (Peng et al. 2018). Firstly, depiction of fish and next distance and center of fishes. In the depiction of place, all the fish positions have similar character is located in a feature subsets. Later the distance and amount of fishes are determined. Now, it involves Eqs. (2) and (3) that works perfectly along with Eqs. (4) and (5).
Evaluation of fitness involves the Evaluation fitness value of attribute subclass of all the fish. In IFSA, the FF represents the feed focus and factors of selected fish performance. In augmentation step of fish swarm, the performance function is examined. This function acts as subclass assessment and subclass that satisfied the condition would be permitted as the optimum subclass. This assessment acts as ending criteria for selecting an optimal set of features. Equations (6), (9), and (10) are the ending objective to be attained by fulfilling their condition for executing Eqs. (7) and (8).
Stage 3: multimodal fusion process
Once the IFSO algorithm completes the feature selection process, an optimum subset of features was chosen and are fed into the DL models. In this work, a multimodal fusion of three DL models such as RNN, BiLSTM, and DBN models takes place using the weighted voting based ensemble technique. An overview of these DL models is elaborated in the succeeding sections. Figure 3 demonstrates the architecture of DL models namely RNN, LSTM, and DBM models.
Fig. 3.

Structure of DL models a RNN b LSTM and c DBN
Training RNN for capturing long term dependency is complex because of the effects of diminishing gradients, thus the commonly utilized modification of RNN unit is the LSTM which gives the “constant error carousel” and doesn’t prevent free gradient flow. One of the popular LSTM framework has: output gate, input gate, and forget gate as well as a recurrent cell. LSTM cell is generally ordered in a chain, with the output of prior LSTM linked to the input of succeeding LSTM. A current generalization of LSTM framework is provided using gated recurrent units (GRU) presented. GRU is related to an LSTM cell; GRU contains separate “update gate” rather than single forget and input gates, doesn’t differentiate cell and hidden states, and often reveals the whole hidden state, without a special gate for it. A significant alteration of the fundamental RNN framework is bi-direction RNNs, where the previous and upcoming contexts are presented on all time steps. An RNN is NN framework which comprises cyclic connection that allows it for learning the temporal dynamics of consecutive data. A hidden layer in an RNN comprises multiple nodes (Murad and Pyun 2017). Every node contain a function to generate the present hidden state ht and output yt with the help of its present input xt and prior hidden state ht−1 based on the succeeding formula:
| 11 |
| 12 |
whereas Wh, Uh, and Wy denotes the weight for hidden to hidden recurrent connections, input to hidden connections, and hidden to output connections, correspondingly. bh and by denotes the bias term for the and hidden output states, correspondingly. In addition, it has an activation function related to every node. This is an elementwise nonlinearity function, generally selected from many present functions, like hyperbolic tangent, sigmoid, or ReLU.
Now, the Bi-LSTM was projected to predict the data sequence and execute the detection of abnormality. Generally, cyberattack exists in a time of relating time sequence data that provides the data on time is employed for predicting the abnormality (Jia et al. 2017). Bi-LSTM is very useful for learning the series with patterns of unknown length. As well, the stacked recurrent hidden layers in NN are for confining the structures of a time sequence. Therefore, another method is to employ RNN as established. For developing a gradient reducing problem as the LSTM utilize a memory cell state for transmitting the data. A cell state is appropriate to compute the data that isn’t utilized for a long period of time duration. Henceforth, an LSTM has to Forget, Update and Reset gates. In addition, few main components of LSTM are described as follows.
Constant error carousel (CEC): An essential component utilizes repeated connection as well unit weight. Later, recurrent link indicates a feedback loop and a time step 1. The CEC’s activations are an inner state which is functioned as a memory e.g. data.
Input Gate: A multiplicative unit defends data kept in CEC from an irregular input.
Output Gate: A multiplicative unit defend other units from interruption using the content kept in CEC.
Now, the input and output gate manages the access for controlling CEC. In training stage, the input gate is identified and allows novel data inside the CEC. When the input gate is zero, then the data isn’t linked. Similarly, the output gate is studied and permits the data to be attained from CEC. In addition, when the gates are closed, the data is stuck in the memory cell. Later, it allows the error signal to flow many times without considering reducing gradients. The LSTM exceeds the RNN when learning extended dependency. It is an unimportant data series. The LSTM state isn’t organized when the input stream is separated physically and altered to proper sequence. Particularly, LSTM learns to reset the memory cell as the series is finished and get a novel series. This problem is solved with the help of LSTM using forget gates. Also, the Bi-LSTM is an enhanced module of LSTM where two LSTM methods have been employed to the input data. Formerly, an LSTM is utilized in the input series. Later, the inverse form of forwarding layer was given to the LSTM method. In the application of LSTM, the maximalized learning of long term dependency improves the model's efficiency.
For gaining precise intrusion detection, DBN technique was employed for knowing the important features of traffic flow details. In fact, DBN belonging to the Deep Neural Network (DNN) with several hidden layers and huge amount of hidden units in all layers. Traditionally, DBN is similar to Restricted Boltzmann Machine (RBM) technique that is made up of output layer. Furthermore, DBN employs strong, greedy unsupervised learning techniques to training RMB and supervised fine tuning system for changing the scheme by labelled data. The RBM contains hidden layer, visible layer and connected with undirected weights (Yu and Liu 2020). For stacking RBMs in DBN, hidden layer of RBM is consider as visible layer of forthcoming RBM. The varibale set of RMB as , where denotes the weight amongst and. and are determined as bias of layers. The RBM defines equivalent energy is represented by:
| 13 |
and the joint likelihood distribution of and is defined as,
| 14 |
whereas marginal likelihood distribution of is shown by,
| 15 |
To gain an optimal value for single data vector , gradient of probability estimation is evaluated based on the employed function,
| 16 |
whereas denotes the expectation by the distribution of particular subscript. Because of the lack of connections amongst units in same layer, is simply attained by evaluating the conditional likelihood distributions and denoted by
| 17 |
The activation function is denoted as sigmoid function. In the event of , Contrastive Divergence (CD) learning module is applied by reconstruction for reducing the variation of two Kullback–Leibler divergences (KL). Firstly, CD learning is efficient in real world application and limit the processing cost than Gibbs sampling method. Thus, weights in DBN layer undergo training through unlabeled data by fast and greedy unsupervised method. In the event of prediction, supervised layer is involved in DBN for changing the learned features with the help of labeled data in the application of up-down fine tuning technique. Now, the Fully Connected (FC) layer act as a top layer, and sigmoid activation function was utilized.
Weighted voting based ensemble model
At the weighted voting based ensemble model, the DL models are integrated and the maximum outcome is chosen by weighted voting technique. The voting technique is trained with every individual vector and the respective tenfold cross‐validation accu. is then assessed as the fitness function (Zhang et al. 2014). Provided the number of classes as and base classification models for voting, the predictive class of weighted voting for each instance, can be defined by
| 18 |
where is the binary variable. When the th base classification model categorizes the instance into the th class, then ; else, is the weight of the th base classification model in an ensemble. Afterward, the accu. can be represented by
| 19 |
Performance validation
The experimental validation of the proposed AIMMF-IDS technique take place using the NSL-KDD 2015 (http://www.unb.ca/research/iscx/dataset/iscx-NSL-KDD-dataset.html) and CICIDS 2017 (https://www.unb.ca/cic/datasets/ids-2017.html). Table 1 depicts the dataset description. Besides, the feature selection and intrusion detection performance of the AIMMF-IDS technique are investigated under several dimensions. The parameter setting of the AIMMF-IDS model is given as follows: mini batch size: 200, dropout: 0.5, number of hidden layers:3, number of hidden units: 1024, and activation function: softmax.
Table 1.
Dataset details
| Dataset | No. of instances | Attribute count | Class count | Normal/anomaly |
|---|---|---|---|---|
| NSLKDD 2015 | 125,973 | 41 | 2 | 67,343/58630 |
| CICIDS 2017 | 2,830,743 | 80 | 2 | 2,273,097/557646 |
A brief FS results analysis of the IFSO-FS model with other FS models takes place in Table 2 and Fig. 4. On investigating the BC analysis of the IFSO-FS technique on the applied NSL-KDD-2015 dataset, the IFSO-FS approach has provided enhanced outcome with the lower BC of 0.06372 whereas the GSO-FS, GOA-FS, and SSO-FS techniques have resulted in reduced performance with the BC of 0.08461, 0.13498, and 0.14667 respectively.
Table 2.
Best cost analysis of IFSO-FS model
| Techniques | BC | No. of chosen features |
|---|---|---|
| NSL KDD 2015 dataset | ||
| IFSO-FS | 0.06372 | 17 |
| GSO-FS | 0.08461 | 19 |
| GOA-FS | 0.13498 | 25 |
| SSO-FS | 0.14667 | 29 |
| CICIDS-2017 dataset | ||
| IFSO-FS | 0.05341 | 47 |
| GSO-FS | 0.09486 | 56 |
| GOA-FS | 0.12543 | 61 |
| SSO-FS | 0.13557 | 64 |
Fig. 4.

BC analysis of IFSO-FS model
On examining the BC analysis of the IFSO-FS approach on the applied CICIDS-2017 dataset, the IFSO-FS manner accomplished increased result with the minimum BC of 0.05341 whereas the GSO-FS, GOA-FS, and SSO-FS techniques have resulted in decreased performance with the BC of 0.09486, 0.12543, and 0.13557 correspondingly.
Table 3 and Fig. 5 depict the intrusion detection performance of the AIMMF-IDS technique on the test NSL-KDD-2015 dataset under distinct folds. The results showcased that the AIMMF-IDS technique has gained maximum detection performance under all the folds. For instance, with fold-1, the AIMMF-IDS technique has obtained a prec. of 98.28%, reca. of 98.57%, accu. of 99.09%, F-measure of 98.92%, and kappa of 97.30%. Eventually, with fold-3, the AIMMF-IDS manner has gained a prec. of 99.47%, reca. of 99.55%, accu. of 99.67%, F-measure of 99.38%, and kappa of 96.48%. Moreover, with fold-5, the AIMMF-IDS method has attained a prec. of 99.70%, reca. of 99.64%, accu. of 99.70%, F-measure of 99.20%, and kappa of 98.23%. Meanwhile, with fold-7, the AIMMF-IDS technique has achieved a prec. of 99.37%, reca. of 99.51%, accu. of 99.94%, F-measure of 99.05%, and kappa of 99.15%. Lastly, with fold-10, the AIMMF-IDS approach has reached a prec. of 99.63%, reca. of 99.08%, accu. of 99.52%, F-measure of 98.39%, and kappa of 99.49%.
Table 3.
Comparative study of AIMMF-IDS method with respect to distinct measures on NSL-KDD-2015 dataset
| Folds | Prec | Reca | Accu | F-measure | Kappa |
|---|---|---|---|---|---|
| Fold 1 | 98.28 | 98.57 | 99.09 | 98.92 | 97.30 |
| Fold 2 | 99.66 | 97.99 | 99.76 | 99.72 | 96.37 |
| Fold 3 | 99.47 | 99.55 | 99.67 | 99.38 | 96.48 |
| Fold 4 | 99.56 | 98.77 | 99.10 | 98.08 | 97.48 |
| Fold 5 | 99.70 | 99.54 | 98.08 | 98.57 | 99.68 |
| Fold 6 | 99.27 | 99.64 | 99.70 | 99.20 | 98.23 |
| Fold 7 | 99.37 | 99.51 | 99.94 | 99.05 | 99.15 |
| Fold 8 | 99.84 | 98.27 | 99.43 | 98.51 | 98.57 |
| Fold 9 | 99.78 | 99.75 | 99.34 | 99.95 | 99.26 |
| Fold 10 | 99.63 | 99.08 | 99.52 | 98.39 | 99.49 |
| Average | 99.46 | 99.07 | 99.36 | 98.98 | 98.20 |
Fig. 5.

Result analysis of AIMMF-IDS model on NSL-KDD-2015 dataset
Table 4 and Fig. 6 portray the intrusion detection performance of the AIMMF-IDS method on the test CICIDS-2017 dataset under various folds. The results demonstrated that the AIMMF-IDS manner has attained maximal detection performance under all the folds. For sample, with fold-1, the AIMMF-IDS manner has resulted to a prec. of 98.94%, reca. of 96.86%, accu. of 96.36%, F-measure of 95.74%, and kappa of 97.65%. Moreover, with fold-3, the AIMMF-IDS technique has achieved a prec. of 99.67%, reca. of 95.50%, accu. of 98.25%, F-measure of 93.72%, and kappa of 96.49%. Also, with fold-5, the AIMMF-IDS algorithm has gained a prec. of 98.04%, reca. of 96.41%, accu. of 93.81%, F-measure of 94.52%, and kappa of 96.97%. In the meantime, with fold-7, the AIMMF-IDS method has attained a prec. of 97.69%, reca. of 97.30%, accu. of 99.51%, F-measure of 99.05%, and kappa of 95.72%. Finally, with fold-10, the AIMMF-IDS methodology has gained a prec. of 99.52%, reca. of 99.63%, accu. of 99.08%, F-measure of 96.07%, and kappa of 95.49%.
Table 4.
Result analysis of proposed AIMMF-IDS method with respect to distinct measures on CICIDS-2017 dataset
| Folds | Prec | Reca | Accu | F-measure | Kappa |
|---|---|---|---|---|---|
| Fold 1 | 98.94 | 96.86 | 96.36 | 95.74 | 97.65 |
| Fold 2 | 98.47 | 95.95 | 98.46 | 94.53 | 96.95 |
| Fold 3 | 99.67 | 95.50 | 98.25 | 93.72 | 96.49 |
| Fold 4 | 97.60 | 96.86 | 94.23 | 94.53 | 96.98 |
| Fold 5 | 98.04 | 96.41 | 93.81 | 94.52 | 96.97 |
| Fold 6 | 96.47 | 93.90 | 99.46 | 96.50 | 95.76 |
| Fold 7 | 97.69 | 97.30 | 99.51 | 99.05 | 95.72 |
| Fold 8 | 99.43 | 95.70 | 98.45 | 95.93 | 96.94 |
| Fold 9 | 97.62 | 97.33 | 98.61 | 97.30 | 96.73 |
| Fold 10 | 99.52 | 99.63 | 99.08 | 96.07 | 95.49 |
| Average | 98.35 | 96.54 | 97.62 | 95.79 | 96.57 |
Fig. 6.

Result analysis of AIMMF-IDS model on CICIDS-2017 dataset
In order to point out the supreme result analysis of the AIMMF-IDS technique, an extensive results analysis is offered in Table 5. From the obtained results, it is obvious that the AK-NN, DT, and DPC-DBN models have resulted in ineffective performances over the other techniques. Besides, the AdaBoost, Random Forest, and SVM models have accomplished slightly boosted outcomes. Followed by, the PT-DSAE, RNN, LSTM, and DBN models have demonstrated reasonable detection performance. However, the proposed AIMMF-IDS technique has surpassed the other techniques with a higher prec. of 99.46%, reca. of 99.07%, F-measure of 98.98%, and accu. of 99.36%.
Table 5.
Comparison study of proposed AIMMF-IDS model with respect to different measures
| Methods | Prec | Reca | F-measure | Accu |
|---|---|---|---|---|
| AIMMF-IDS | 99.46 | 99.07 | 98.98 | 99.36 |
| DBN | 98.67 | 98.83 | 98.97 | 98.74 |
| LSTM | 98.45 | 98.57 | 98.91 | 98.63 |
| RNN | 98.23 | 98.68 | 98.75 | 98.52 |
| PT-DSAE | 97.91 | 98.65 | 98.60 | 98.49 |
| DPC-DBN | 95.12 | 94.99 | 95.08 | 94.98 |
| AK-NN | 92.19 | 93.76 | 92.92 | 91.99 |
| Decision tree | 96.59 | 92.84 | 95.42 | 93.65 |
| Adaboost | 97.42 | 93.21 | 95.68 | 95.87 |
| Random forest | 97.56 | 93.84 | 95.92 | 95.98 |
A detailed training as well as testing time validation of the AIMMF-IDS technique takes place in Table 6 and Fig. 7 (Aljehane 2021; Li et al. 2018; Diro and Chilamkurti 2018; Yang et al. 2019; Djenouri et al. 2019; Nguyen et al. 2021; Porkodi et al. 2020). From the obtained values, it is demonstrated that the SVM and RF models have required maximum training and testing times. Next to that, slightly reduced training and testing times are needed by the AK-NN, DT, and Adaboost techniques. Afterward, the LSTM, RNN, PT-DSAE, and DBN models have obtained reasonable training and testing times. But the proposed AIMMF-IDS technique has shown effectual outcome with the least training and testing time of 0.922 m and 0.417 m correspondingly.
Table 6.
Performance of proposed AIMMF-IDS with recent techniques for applied dataset with respect to training and testing time
| Methods | Training time (m) | Testing time (m) |
|---|---|---|
| AIMMF-IDS | 0.922 | 0.417 |
| DBN | 1.024 | 0.571 |
| LSTM | 1.128 | 0.566 |
| RNN | 1.148 | 0.589 |
| PT-DSAE | 1.177 | 0.596 |
| DPC-DBN | 1.210 | 0.620 |
| AK-NN | 1.317 | 0.698 |
| Decision tree | 1.344 | 0.717 |
| Adaboost | 1.389 | 0.749 |
| Random forest | 1.433 | 0.786 |
| SVM | 1.448 | 0.847 |
Fig. 7.
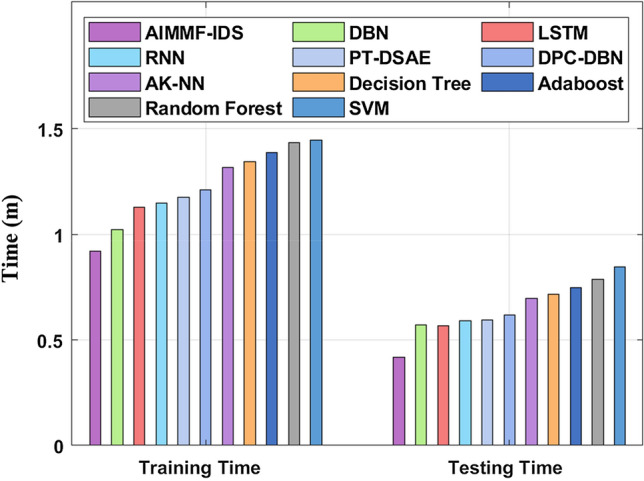
Comparative analysis of AIMMF-IDS model interms of training and testing time
From the above mentioned results and discussion, it can be concluded that the AIMMF-IDS technique is an effective IDS tool for CCPS in Industry 4.0 environment. The improved performance of the AIMMF-IDS technique is due to the use of IFSA-FS technique and multimodal fusion based classification process. The application of IFSA-FS technique helps to eradicate unwanted features, reduce computation complexity, and enhances outcome.
Conclusion
This study has developed a novel AIMMF-IDS technique for identifying intrusions in the industry 4.0 environment. Primarily, the input data is pre-processed in two levels namely data conversion and data normalization. Then, the IFSA technique is derived using the incorporation of LF concept into the FSA technique for eradicating the local optima problem and is then applied for the optimum selection of features. Finally, a multimodal fusion of three DL models such as RNN, BiLSTM, and DBN models takes place using the weighted voting based ensemble technique. For evaluating the enhanced outcomes of the AIMMF-IDS model, extensive experiments are performed and the results are investigated interms of several measures. The simulation outcome reported the enhanced detection performance of the AIMMF-IIDS model over the recently developed IDS. In future, the AIMMF-IDS technique can be deployed in the big data environment to handle the massive generation of networking data. Moreover, outlier detection and feature reduction approaches can be employed to boost intrusion detection performance.
Acknowledgements
The authors extend their appreciation to the Deanship of Scientific Research at King Khalid University for funding this work under grant number (RGP2/209/42).
Declarations
Conflict of interest
The authors declare that they have no conflict of interest. The manuscript was written through contributions of all authors. All authors have given approval to the final version of the manuscript.
Data availability
Data sharing not applicable to this article as no datasets were generated or analyzed during the current study.
Footnotes
Publisher's Note
Springer Nature remains neutral with regard to jurisdictional claims in published maps and institutional affiliations.
References
- Aiello G, Giallanza A, Vacante S, Fasoli S, Mascarella G. Propulsion monitoring system for digitized ship management: preliminary results from a case study. Proc Manuf. 2020;42:16–23. [Google Scholar]
- Aljehane NO. A secure intrusion detection system in cyberphysical systems using a parameter-tuned deep-stacked autoencoder. CMC-Comput Mater Cont. 2021;68(3):3915–3929. [Google Scholar]
- Althobaiti MM, Kumar KPM, Gupta D, Kumar S, Mansour RF. An intelligent cognitive computing based intrusion detection for industrial cyber-physical systems. Measurement. 2021;186:110145. [Google Scholar]
- Dabba A, Tari A, Zouache D. Multiobjective artificial fish swarm algorithm for multiple sequence alignment. INFOR Inform Syst Oper Res. 2020;58(1):38–59. [Google Scholar]
- de Araujo-Filho PF, Kaddoum G, Campelo DR, Santos AG, Macêdo D, Zanchettin C. Intrusion detection for cyber–physical systems using generative adversarial networks in fog environment. IEEE Internet Things J. 2020;8(8):6247–6256. [Google Scholar]
- De Sousa Jabbour ABL, Jabbour CJC, Foropon C, Filho MG. When titans meet—can industry 4.0 revolutionise the environmentally-sustainable manufacturing wave? The role of critical success factors. Technol Forecast Soc Change. 2018;132:18–25. [Google Scholar]
- Diro AA, Chilamkurti N. Distributed attack detection scheme using deep learning approach for internet of things. Futur Gener Comput Syst. 2018;82(761–768):43. [Google Scholar]
- Djenouri Y, Belhadi A, Lin JCW, et al. Adapted k-nearest neighbors for detecting anomalies on spatio–temporal traffic flow. IEEE Access. 2019;7:10015–10027. [Google Scholar]
- http://www.unb.ca/research/iscx/dataset/iscx-NSL-KDD-dataset.html
- https://www.unb.ca/cic/datasets/ids-2017.html
- Jagtap SS, Subramaniyaswamy V. A hypergraph based Kohonen map for detecting intrusions over cyber–physical systems traffic. Fut Gen Comput Syst. 2021;119:84–109. [Google Scholar]
- Jia Y, Wu J, Xu M (2017) Traffic flow prediction with rainfall impact using a deep learning method. J Adv Transp 2017.
- Jiang JR. An improved cyber-physical systems architecture for Industry 4.0 smart factories. Adv Mech Eng. 2018;10(6):1687814018784192. [Google Scholar]
- Khalili A, Sami A, Khozaei A, Pouresmaeeli S. SIDS: State-based intrusion detection for stage-based cyber physical systems. Int J Crit Infrastruct Protect. 2018;22:113–124. [Google Scholar]
- Kwon S, Yoo H, Shon T. IEEE 1815.1-based power system security with bidirectional RNN-based network anomalous attack detection for cyber-physical system. IEEE Access. 2020;8:77572–77586. [Google Scholar]
- Li X-L. An optimizing method based on autonomous animats: fish-swarm algorithm. Syst Eng Theory Pract. 2002;22(11):32–38. [Google Scholar]
- Li B, Lu R, Wang W, Choo KKR. Distributed host-based collaborative detection for false data injection attacks in smart grid cyber-physical system. J Parallel Distrib Comput. 2017;103:32–41. [Google Scholar]
- Li J, Zhao Z, Li R, et al. AI-based two-stage intrusion detection for software defined IoT networks. IEEE Internet Things J. 2018;6(2):2093–2102. [Google Scholar]
- Li B, Wu Y, Song J, Lu R, Li T, Zhao L. DeepFed: federated deep learning for intrusion detection in industrial cyber–physical systems. IEEE Trans Ind Inform. 2020;17(8):5615–5624. [Google Scholar]
- Luo Y, Xiao Y, Cheng L, Peng G, Yao D. Deep learning-based anomaly detection in cyber-physical systems: progress and opportunities. ACM Comput Surv (CSUR) 2021;54(5):1–36. [Google Scholar]
- Machado CG, Winroth MP, Ribeiro da Silva EHD. Sustainable manufacturing in industry 4.0: an emerging research agenda. Int J Prod Res. 2020;58:1462–1484. [Google Scholar]
- Moustafa N, Adi E, Turnbull B, Hu J. A new threat intelligence scheme for safeguarding industry 4.0 systems. IEEE Access. 2018;6:32910–32924. [Google Scholar]
- Murad A, Pyun JY. Deep recurrent neural networks for human activity recognition. Sensors. 2017;17(11):2556. doi: 10.3390/s17112556. [DOI] [PMC free article] [PubMed] [Google Scholar]
- Nguyen GN, Viet NHL, Elhoseny M, Shankar K, Gupta BB, El-Latif AAA. Secure blockchain enabled Cyber–physical systems in healthcare using deep belief network with ResNet model. J Parall Distrib Comput. 2021;153:150–160. [Google Scholar]
- Oztemel E, Gursev S. Literature review of industry 4.0 and related technologies. J Intell Manuf. 2020;31:127–182. [Google Scholar]
- Peng Z, Dong K, Yin H, Bai Y (2018) Modification of fish swarm algorithm based on levy flight and firefly behavior. Comput Intell Neurosci 2018. [DOI] [PMC free article] [PubMed]
- Porkodi V, et al. Resource provisioning for cyber–physical–social system in cloud-fog-edge computing using optimal flower pollination algorithm. IEEE Access. 2020;8:105311–105319. [Google Scholar]
- Radanliev P, De Roure D, Van Kleek M, Santos O, Ani U (2020) Artificial intelligence in cyber physical systems. AI Soc 1–14. [DOI] [PMC free article] [PubMed]
- Sun R. Potential of full human–machine symbiosis through truly intelligent cognitive systems. AI Soc. 2020;35(1):17–28. [Google Scholar]
- Thakur S, Chakraborty A, De R, Kumar N, Sarkar R. Intrusion detection in cyber-physical systems using a generic and domain specific deep autoencoder model. Comput Elect Eng. 2021;91:107044. [Google Scholar]
- Yang Y, Zheng K, Wu C, et al. Building an effective intrusion detection system using the modified density peak clustering algorithm and deep belief networks. Appl Sci. 2019;9(2):238. [Google Scholar]
- Yu J, Liu G. Knowledge-based deep belief network for machining roughness prediction and knowledge discovery. Comput Ind Stry. 2020;121:103262. [Google Scholar]
- Zhang Y, Zhang H, Cai J, Yang B (2014) A weighted voting classifier based on differential evolution. In: Abstract and applied analysis, vol 2014. Hindawi.
Associated Data
This section collects any data citations, data availability statements, or supplementary materials included in this article.
Data Availability Statement
Data sharing not applicable to this article as no datasets were generated or analyzed during the current study.