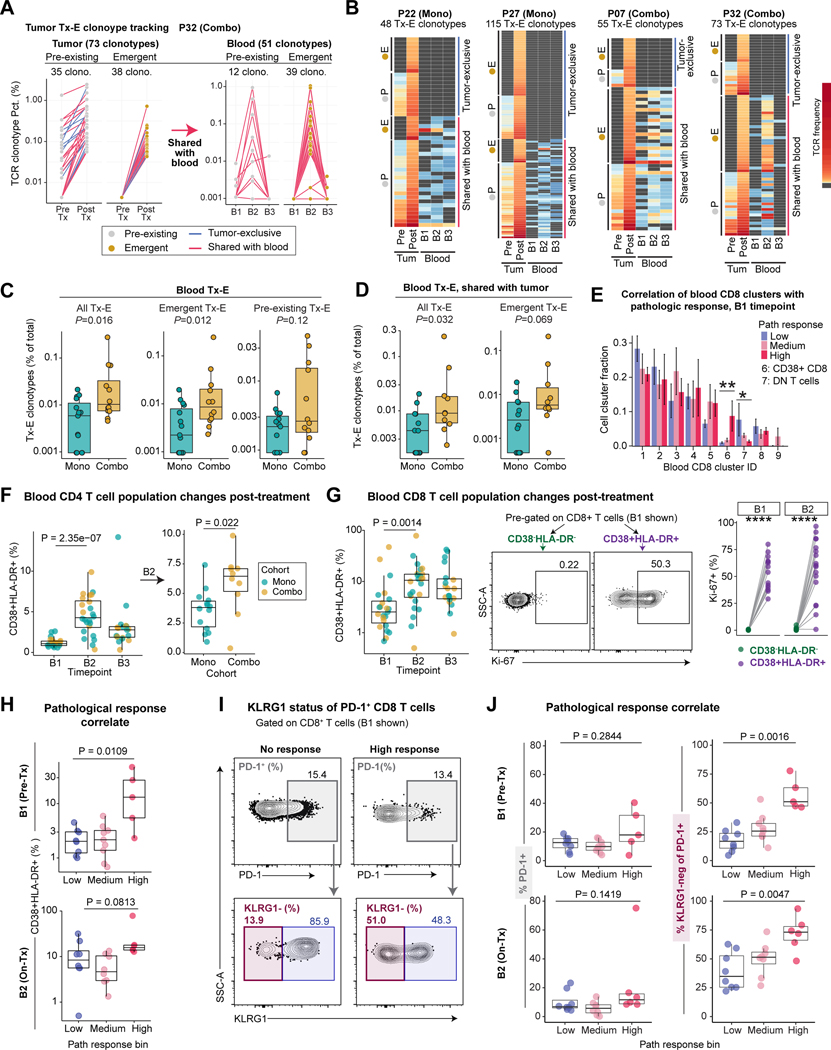
Figure 7: Activation state of circulating T cells as biomarkers of tumor pathological response.
A) Frequencies of tumor Tx-E TCR clonotypes and their associated frequencies in the blood for a patient with an exceptional cellular response (P32).
B) Frequencies of tumor Tx-E TCR clonotypes and their associated frequencies in the blood. Data for four patients with notable Tx-E TCR abundance are shown. Each row represents one tumor Tx-E clonotype grouped as indicated; grey cell means TCR was not detected for given sample.
C) Frequency of blood Tx-E TCR clonotypes plotted as percentage of total blood clonotypes within treatment cohorts. Shown are all Tx-E TCRs (left) or split into emergent (middle) and pre-existing (right) TCRs. Each dot represents an individual patient (n=15 mono patients, n=12 combo patients; two-sided Wilcoxon rank-sum test).
D) Frequency of total or emergent blood Tx-E clonotypes shared with tumor, plotted as percentage of total blood clonotypes. Each point represents an individual patient for whom frequencies could be calculated (n= 12 mono, n=10 combo; two-sided Wilcox test).
E) Correlation of blood CD8 T cell cluster fraction with tumor pathological response at B1 . Difference between low and high pathological response groups was determined (n = 7 for high response, n = 9 for low response, two-sided Wilcoxon rank-sum test, *p<0.05, **p<0.01).
F) Kinetic changes in blood CD4 T cells. Left, frequency of CD4+ CD38+ HLA-DR+ cells, pre-gated on live/CD3+/CD4+ cells shown across timepoints (n=23 B1, n=24 B2, n=19 B3). Right, frequency of CD4+ CD38+ HLA-DR+ cells at B2 comparing cohorts (n= 14 B2 Mono, n = 10 B2 Combo; two-sided unpaired Wilcoxon rank-sum test).
G) Kinetic changes of blood CD8 T cells. Left, Frequency of CD8+ CD38+ HLA-DR+ cells, pre-gated on live/CD3+/CD8+ cells, shown for each patient across timepoints and colored by treatment (n=23 B1, n=24 B2, n=19 B3, two-sided Wilcoxon rank-sum test). Right, quantification of Ki-67+ frequency (%) among CD38+ HLA-DR+ and CD38- HLA-DR- cells for samples with ≥ 100 cells per population (n = 14 B1, n = 17 B2, paired two-sided Wilcoxon rank-sum test, ****p<0.0001).
H) Correlation of pathological response with frequency of CD8+ CD38+ HLA-DR+ T cells in pre-Tx and on-Tx blood samples (B1: n= 8 low, n = 9 medium, n= 5 high; B2: n= 8 low, n= 8 medium, n = 6 high; two-sided Wilcoxon rank-sum test).
I-J) Correlation of pathological response with KLRG1 status of PD-1+ CD8 T cells.
I: Representative flow cytometry plots identifying PD-1+ CD8 T cells (top) and KLRG1 expression by PD-1+ cells (bottom) from low and high pathological response patients at B1 timepoint.
J: Frequency of PD-1+ cells (left) and PD-1+ KLRG1- cells (right) at B1 and B2 timepoints; at B2 on-treatment timepoint, PD-1 was detected with anti-IgG4 (bound nivolumab) (B1: n= 8 low, n = 9 medium, n= 5 high; B2: n= 8 low, n= 8 medium, n = 6 high; two-sided Wilcoxon rank-sum test).

