

Abstract
Synaptic transmission via neurochemical release is the fundamental process that integrates and relays encoded information in the brain to regulate physiological function, cognition, and emotion. To unravel the biochemical, biophysical, and computational mechanisms of signal processing, one needs to precisely measure the neurochemical release dynamics with molecular and cell-type specificity and high resolution. Here we reviewed the development of analytical, electrochemical, and fluorescence imaging approaches to detect neurotransmitter and neuromodulator release. We discussed the advantages and practicality in implementation of each technology for ease-of-use, flexibility for multimodal studies, and challenges for future optimization. We hope this review will provide a versatile guide for tool engineering and applications for recording neurochemical release.
Introduction
Neuronal communication in the mammalian nervous system is governed by local and global changes in brain chemistry. Dysfunction in the complex spatiotemporal regulation of brain chemistry is associated with neurological diseases (Sarter et al., 2007). A comprehensive understanding of chemical dynamics in the diseased and healthy brain would greatly facilitate the discovery of targeted treatments that are safe and effective.
The tools available to neurobiologists to monitor chemical dynamics in the brain should have desired properties in terms of molecular specificity, sensitivity, and resolution to reveal the emergent properties of release. (Fig. 1). For example, high chemical selectivity and specificity is needed to identify and monitor specific chemical species within the brain’s complex chemical environment. A tool that can monitor a wide variety of spatial scales is ideal to gain cellular and subcellular resolution on neurotransmitter release and spillover as well as population dynamics. Also, these tools should have temporal resolution that allows for the measurement of the diverse timescales at play in chemical transmission. Considering the limitations of diffusion and geometry in the extracellular space (Pál, 2018), tools with an appropriate dynamic range that permit a low limit of detection and do not saturate at high concentrations would be necessary. Finally, these tools should be minimally invasive and permit chronic recording in a variety of brain regions.
Fig. 1:
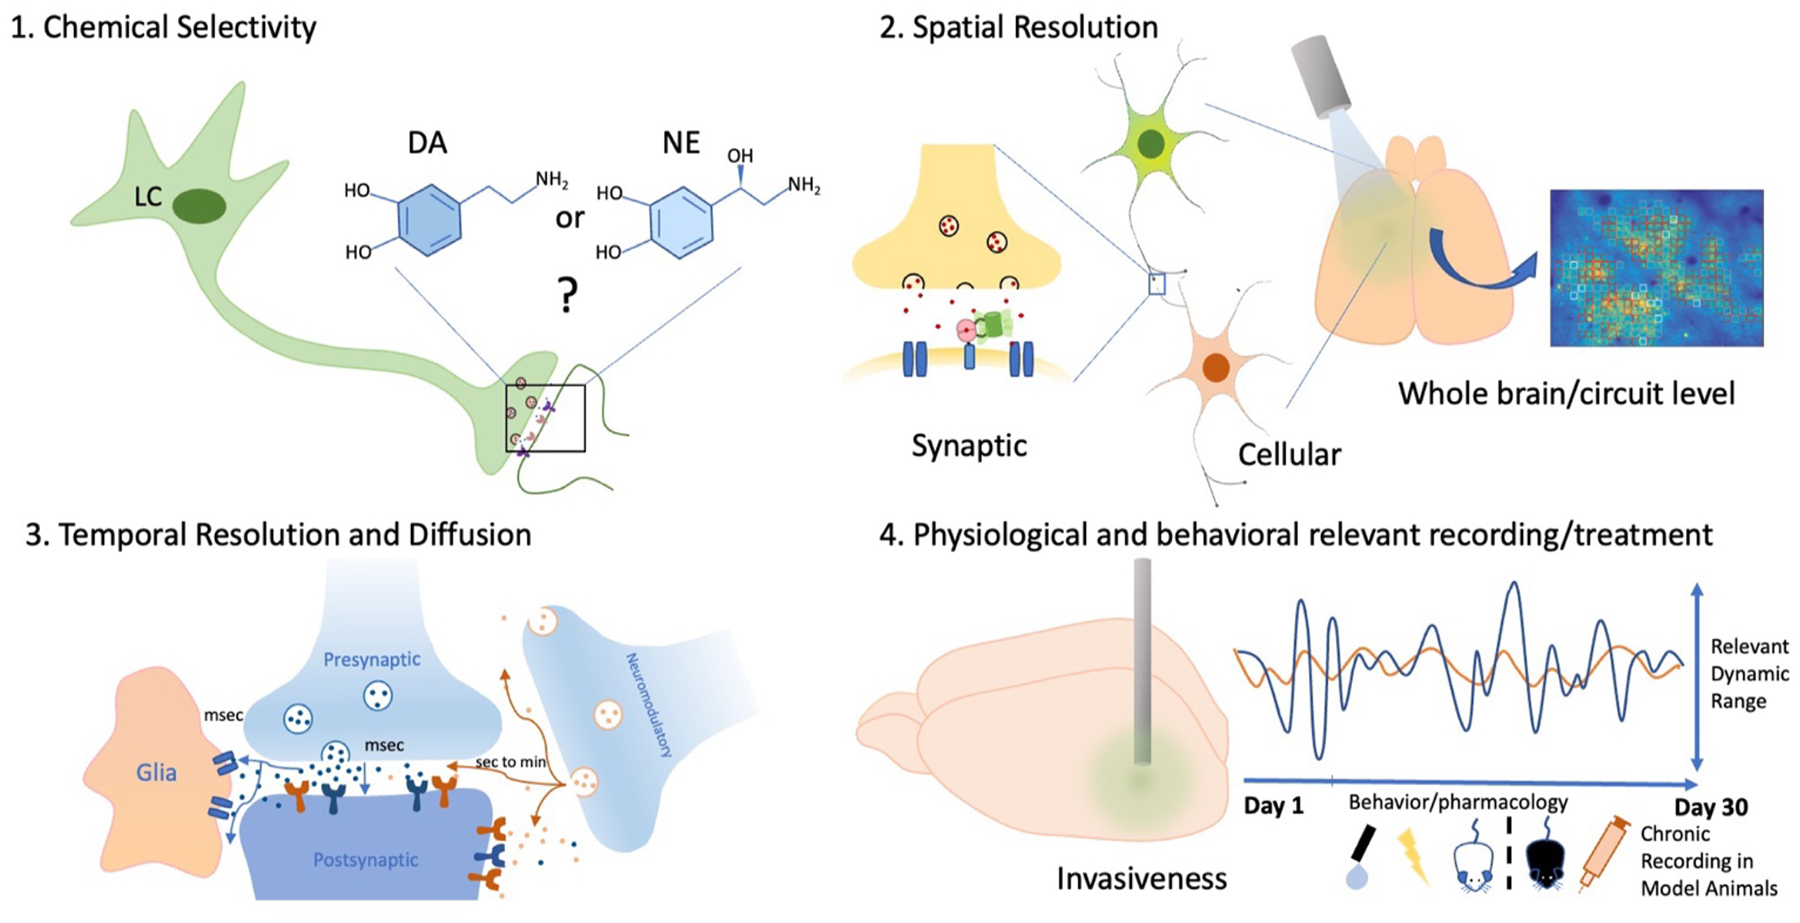
Schematic summarizing important considerations for evaluating tools for neurochemical detection. The ideal tool has high chemical selectivity and resolution that can capture the diverse temporal and spatial scales of neural activity. Heatmap of cortical dopamine activity adapted from Patriarchi and colleagues (Patriarchi et al., 2018).
Technology breakthrough in analytical chemistry, protein engineering, and optics has led to the development of a toolkit of sensors and probes for real-time monitoring of neurochemical release dynamics. Microdialysis involves implanting a probe that contains a semi-permeable membrane over which dialysate is collected from the brain interstitial space and chemically analyzed. Electrochemical detection via fast-scan cyclic voltammetry (FSCV) is another significant advance in neurochemical monitoring that allows for sensitive detection of electroactive compounds with high temporal resolution. The development of fluorescent genetically-encoded or non-genetically encoded indicators in the past few decades have been an important advance for measuring brain chemistry. Highly optimized genetically encoded indicators such as calcium indicators (i.e.GCaMP and X-CaMPs family), small molecule dyes, synthetic nanosensors, and protein-based neuromodulator sensors have been widely used as non-invasive methods for measuring neural activity.
1. Analytic methods
1.1. Basic Principles and Advantages of microdialysis
Microdialysis is one of the most widely used methods for monitoring neurochemicals in vivo. The concept of using dialysis to collect analytes from interstitial fluid in the brain was first reported as early as 1966, where Bito et al. inserted dialysis bags into the cortices of dogs to collect amino acids present in brain interstitial fluid (Bito et al., 1966). Since this initial study, the development of dialysis probes for the active perfusion and collection of dialysate has laid the ground work for modern-day microdialysis (Ungerstedt and Pycock, 1974). Microdialysis probes consist of a shaft housing inlet and outlet tubes that deliver fluids to and from a semi-permeable membrane (Fig. 2). The inlet tube is connected to a perfusion system that delivers perfusion fluid of physiological solute concentrations through the probe, commonly artificial cerebrospinal fluid (aCSF) or Ringer’s solution, matching the electrolyte concentration of the brain interstitial fluid (Chen et al., 1997; Zapata et al., 2009). The perfusion fluid then flows through a semi-permeable membrane of defined molecular weight cut-off across which extracellular analytes can diffuse. The dialysate then flows through the outlet tube where fractions are collected for post hoc chemical analysis. Chemical analysis of the dialysate is often done by electrochemical detection, mass spectrometry (MS), high-performance liquid chromatography (HPLC), or enzymatic detection (Jin et al., 2008; Zestos and Kennedy, 2017).
Figure 2:
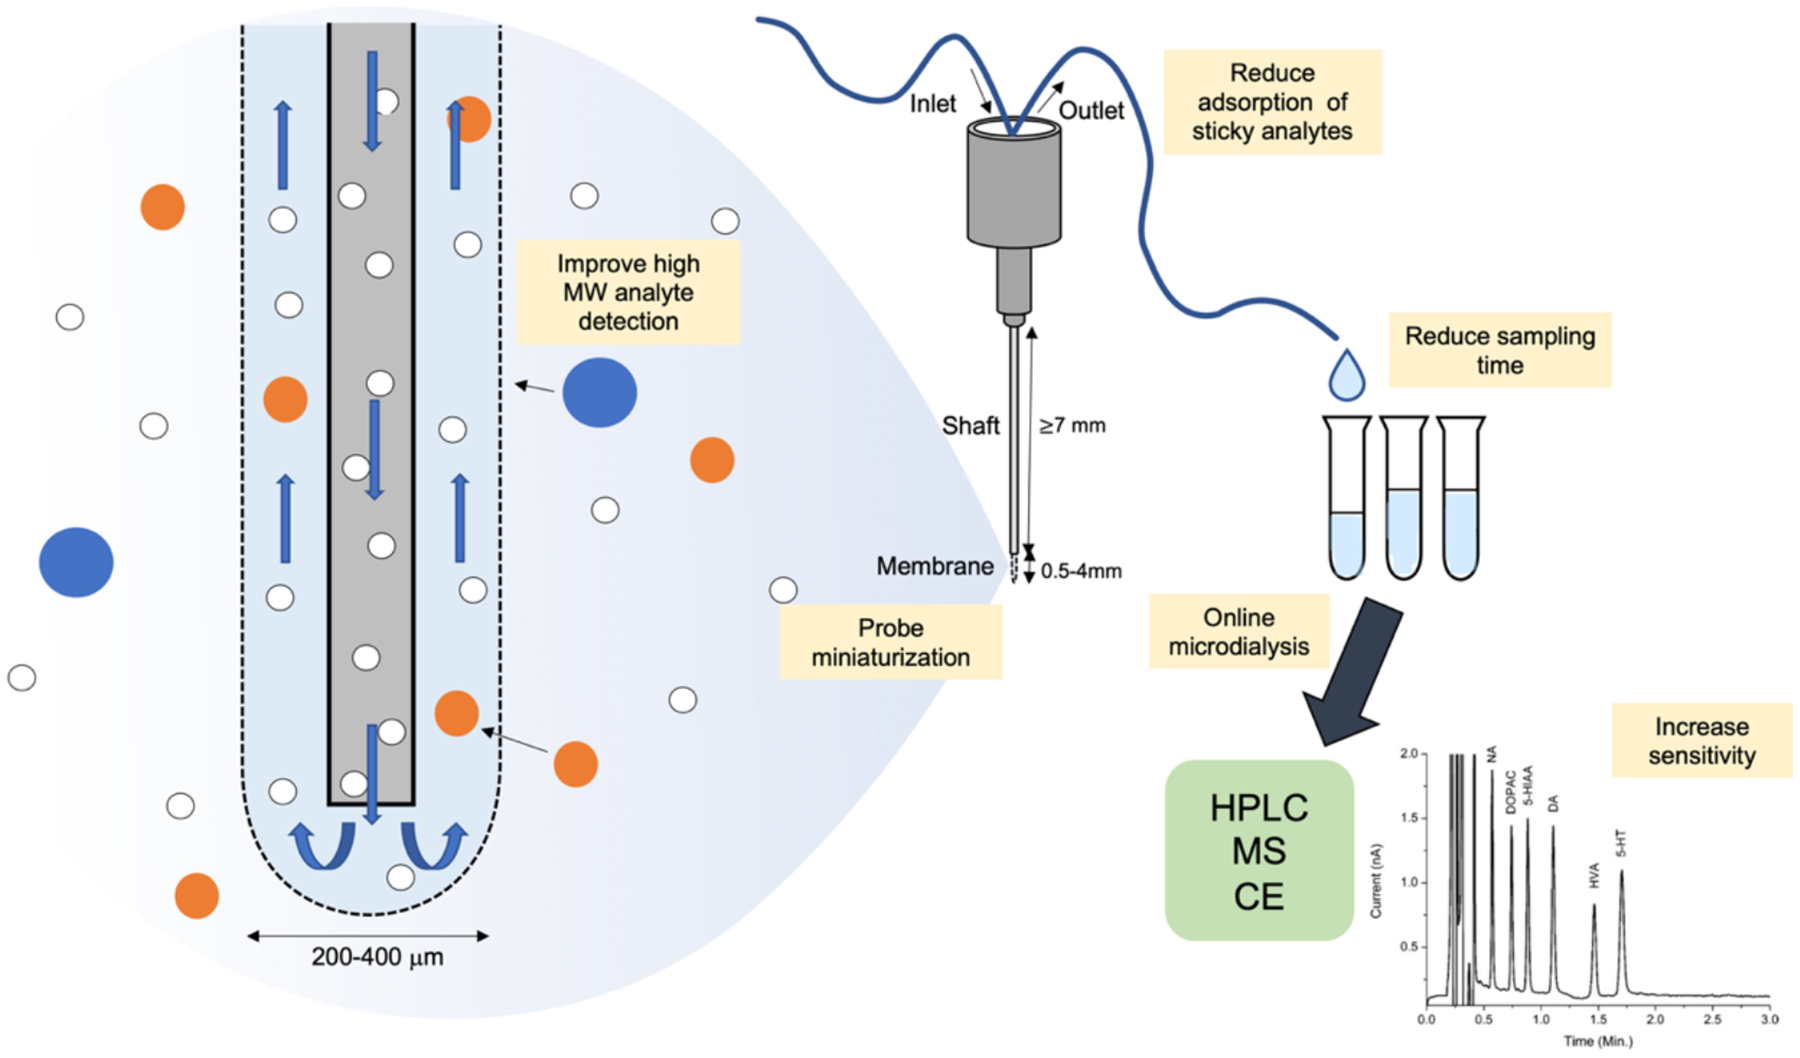
Schematic of microdialysis membrane and workflow. Yellow boxes highlight areas of recent advancements and future directions in probe engineering, sampling, and chemical analysis. HPLC trace adapted from Reinhoud and colleagues (Reinhoud et al., 2013).
A critical advantage of microdialysis over the other techniques discussed in this review is its ability to monitor many different analytes simultaneously with picomolar range sensitivity in vivo (Ballini et al., 2008; Reinhoud et al., 2013; Yang et al., 2013). The collected samples can be analyzed using HPLC or mass spectrometry, and up to 70 different neurochemical compounds can be detected in a single dialysate sample (Wong et al., 2016). As a direct sampling method, it permits the measurement of basal concentrations of brain analytes in addition to dynamic changes in neurochemical levels. The collection of analytes by microdialysis is governed by passive diffusion (Fick’s first law) of extracellular solutes through the dialysis membrane. At standard flow rates (0.3 to 3uL/min), microdialysis probes do not achieve absolute equilibrium with the interstitial fluid. Therefore, 100% recovery of solutes from the brain is rarely achieved, and calibration is needed to relate experimental dialysate concentrations to absolute extracellular concentrations. Many factors contribute to a microdialysis system’s efficiency of recovery (or relative recovery) for a particular analyte of interest, including flow rate, membrane surface area, analyte diffusion coefficients, and diffusion (penetration) distance (Bungay et al., 1990; Chefer et al., 2009). However, improving many of these dialysate collection parameters come with trade-offs in spatiotemporal resolution and invasiveness (brief discussion below). Probe membranes generally have molecular weight cutoffs of 20 to 60 kilodaltons (kDa) (Nandi and Lunte, 2009), making microdialysis a well-established method for monitoring virtually any low molecular weight analyte, such as amino acids or biogenic monoamines in the extracellular space, with high sensitivity.
Microdialysis permits multimodal studies combining neural activity recording and manipulation with sample collection and neurochemical detection. Retrodialysis is used in neuropharmacological studies, where adding a pharmacological compound into the perfusate allows for simultaneous steady-state drug delivery to the tissue and sample collection from the extracellular fluid (Höcht et al., 2007). A single probe can further be used for microdialysis in conjunction with other neural recording techniques such as single cell recording or EEG (Ludvig et al., 1994; Obrenovitch et al., 1993). Quiroz and colleagues demonstrated the utility of a novel optogenetic-microdialysis probe to optically stimulate and measure glutamate and dopamine release in the posteromedial nuclear accumbens shell (Quiroz et al., 2016). Al-Hasani and colleagues have also developed an opto-dialysis probe to measure optically evoked, picomolar release of dynorphin and enkephalins in the nucleus accumbens shell in awake, freely moving mice (Al-Hasani et al., 2018). The work that has been done to allow for multimodal recording of brain activity with these new probes have further modernized the use of microdialysis to answer emerging questions in neuroscience.
1.2. Limitations and optimization
Despite its many advantages, traditional microdialysis methods suffer from low temporal and spatial resolution. While the release and uptake kinetics of many major neurotransmitters occur on the subsecond timescale, the temporal resolution of detecting small molecule neuromodulators using microdialysis is limited to the seconds to minutes timescale compared to the subsecond resolution of FSCV or fluorescence imaging. It is therefore not surprising that microdialysis is not well-suited for detecting fast changes in neurotransmitter concentration, such as during synaptic transmission. The temporal resolution of microdialysis comes hand-in-hand with the chemical sensitivity of the system. For analytes with low physiological concentrations, such as neuropeptides, concentrations in dialysate drops markedly due to fractional recovery rates and the dilution of analyte in perfusate that naturally occurs during microdialysis. Furthermore, large molecular weight analytes like neuropeptides yield lower relative recovery rates than those of smaller analytes (Plock and Kloft, 2005). Increased sampling times are needed for detection of high molecular weight neurochemicals, or those present in the picomolar to nanomolar range of concentrations, lending to a reduction of temporal resolution to the minutes timescale.
Work has been done to improve the temporal resolution of neurotransmitter detection using microdialysis by improving chemical sensitivity (Reinhoud et al., 2013; Zhang et al., 2012). Cyclodextrins and antibodies to capture neuropeptides have been used to reduce sampling time for neuropeptide detection (Fletcher and Stenken, 2008). Schmerberg and Li used antibody-coated magnetic nanoparticles to reduce the time needed (and obviate the need for preconcentration) to detect 31 neuropeptides after a 30 min sample collection in the Jonah crab (Schmerberg and Li, 2013). Given the release kinetics of neuropeptides, more work is needed to improve the temporal resolution of neuropeptide detection with microdialysis. Sensitivity and temporal resolution for detecting neuropeptides suffers further due to its nature to “stick” to probe and sample tube surfaces. Therefore, work to reduce the adsorption of neuropeptides has been done to aid in improved recovery and thus sensitivity (Maes et al., 2014; Zhou et al., 2015).
In addition, dialysate analysis can occur offline after all samples are collected, or online, where dialysate is immediately directed for separation and analytical processing, allowing for “real-time” readout of neurochemical levels. Online microdialysis minimizes the possibility for sample loss or degradation after collection that may happen during offline microdialysis (Nandi and Lunte, 2009). The temporal resolution of online microdialysis is thus limited by the time needed not only for sample collection, but also chemical analysis. In the past decade, much work has been done to improve the temporal resolution of online microdialysis to sub-minute resolution (Ngo et al., 2017; Schultz and Kennedy, 2008; Song et al., 2012; Yang et al., 2013). Traditional microdialysis results in temporal averaging of concentration data due to the “binning” of dialysate into collected fractions (Ngernsutivorakul et al., 2018a). A strategy developed to combat this collects samples in nanoliter sized droplets using segmented-flow microfluidics before chemical analysis, resulting in further improvements in temporal resolution from minutes to seconds (Ngernsutivorakul et al., 2018a; Song et al., 2012).
As mentioned previously, the surface area of the probe membrane can affect the relative recovery of the probe. Although having a larger surface area can lead to improved recovery and thus potentially improved chemical sensitivity, increased probe size decreases spatial resolution. Commercial microdialysis probes can range from 200 μm in diameter and 0.5 to 4 mm long for commercially available probes to smaller microfabricated push-pull probes that are around 70 μm thick and 85 μm wide at the tip (Kennedy, 2013). Traditional probe diameters of 200 to 400 μm do not lend themselves to cellular or subcellular resolution. Additionally, a large probe size increases tissue damage leading to ischemia, gliosis, and cell death at the insertion site (Jaquins-Gerstl and Michael, 2009). Recent efforts to miniaturize microdialysis probes have resulted in improved spatial resolution and reduced tissue damage (Lee et al., 2016; Ngernsutivorakul et al., 2018a, 2018b). Low flow rates also results in higher relative recovery and lower invasiveness by reduced non-specific depletion of solutes; however, at a cost to temporal resolution (Chefer et al., 2009). As an alternative to microdialysis, membrane-free low-flow push-pull perfusion used with liquid chromatography-tandem mass spectrometry has been developed to yield higher relative recovery of proteins and other larger molecules with higher spatial resolution (Raman et al., 2020). Further work is needed to improve the analyte recovery, as well as spatial and temporal resolution achieved by microdialysis. However, its flexibility for multiplexed chemical detection, ability to quantify basal concentrations, and adaptability to neuropharmacological studies lends to its popularity as a widely used tool for neurochemical detection.
2. Electrochemical detection with Fast Scan Cyclic Voltammetry
2.1. Basic Principles and Advantages
Electrochemical detection of neurochemicals with fast scan cyclic voltammetry (FSCV) is an important technique for monitoring the dynamics of many important neurochemicals with high temporal resolution and sensitivity. Voltammetry is an analytical method by which current at an electrode is measured in response to variations in applied potential. In cyclic voltammetry, a sweep up and down a range of potentials results in currents produced by the reduction and oxidation of analytes adsorbed to the electrode surface (Fig. 3). Analyte identity is commonly determined by matching traces with the characteristic voltammogram shape and redox potentials for a given analyte. Carbon fiber microelectrodes are commonly used in FSCV due to their low cost and wide potential window. The ability to easily microfabricate miniaturized carbon microelectrodes to reduce its spatial footprint compared to commercial microdialysis probes is another benefit. Carbon fiber electrodes are typically 5–10 μm in diameter and 50–200 μm long, thus permitting higher spatial resolution compared to that of commercial microdialysis probes (Kennedy, 2013; Rodeberg et al., 2017).
Figure 3:
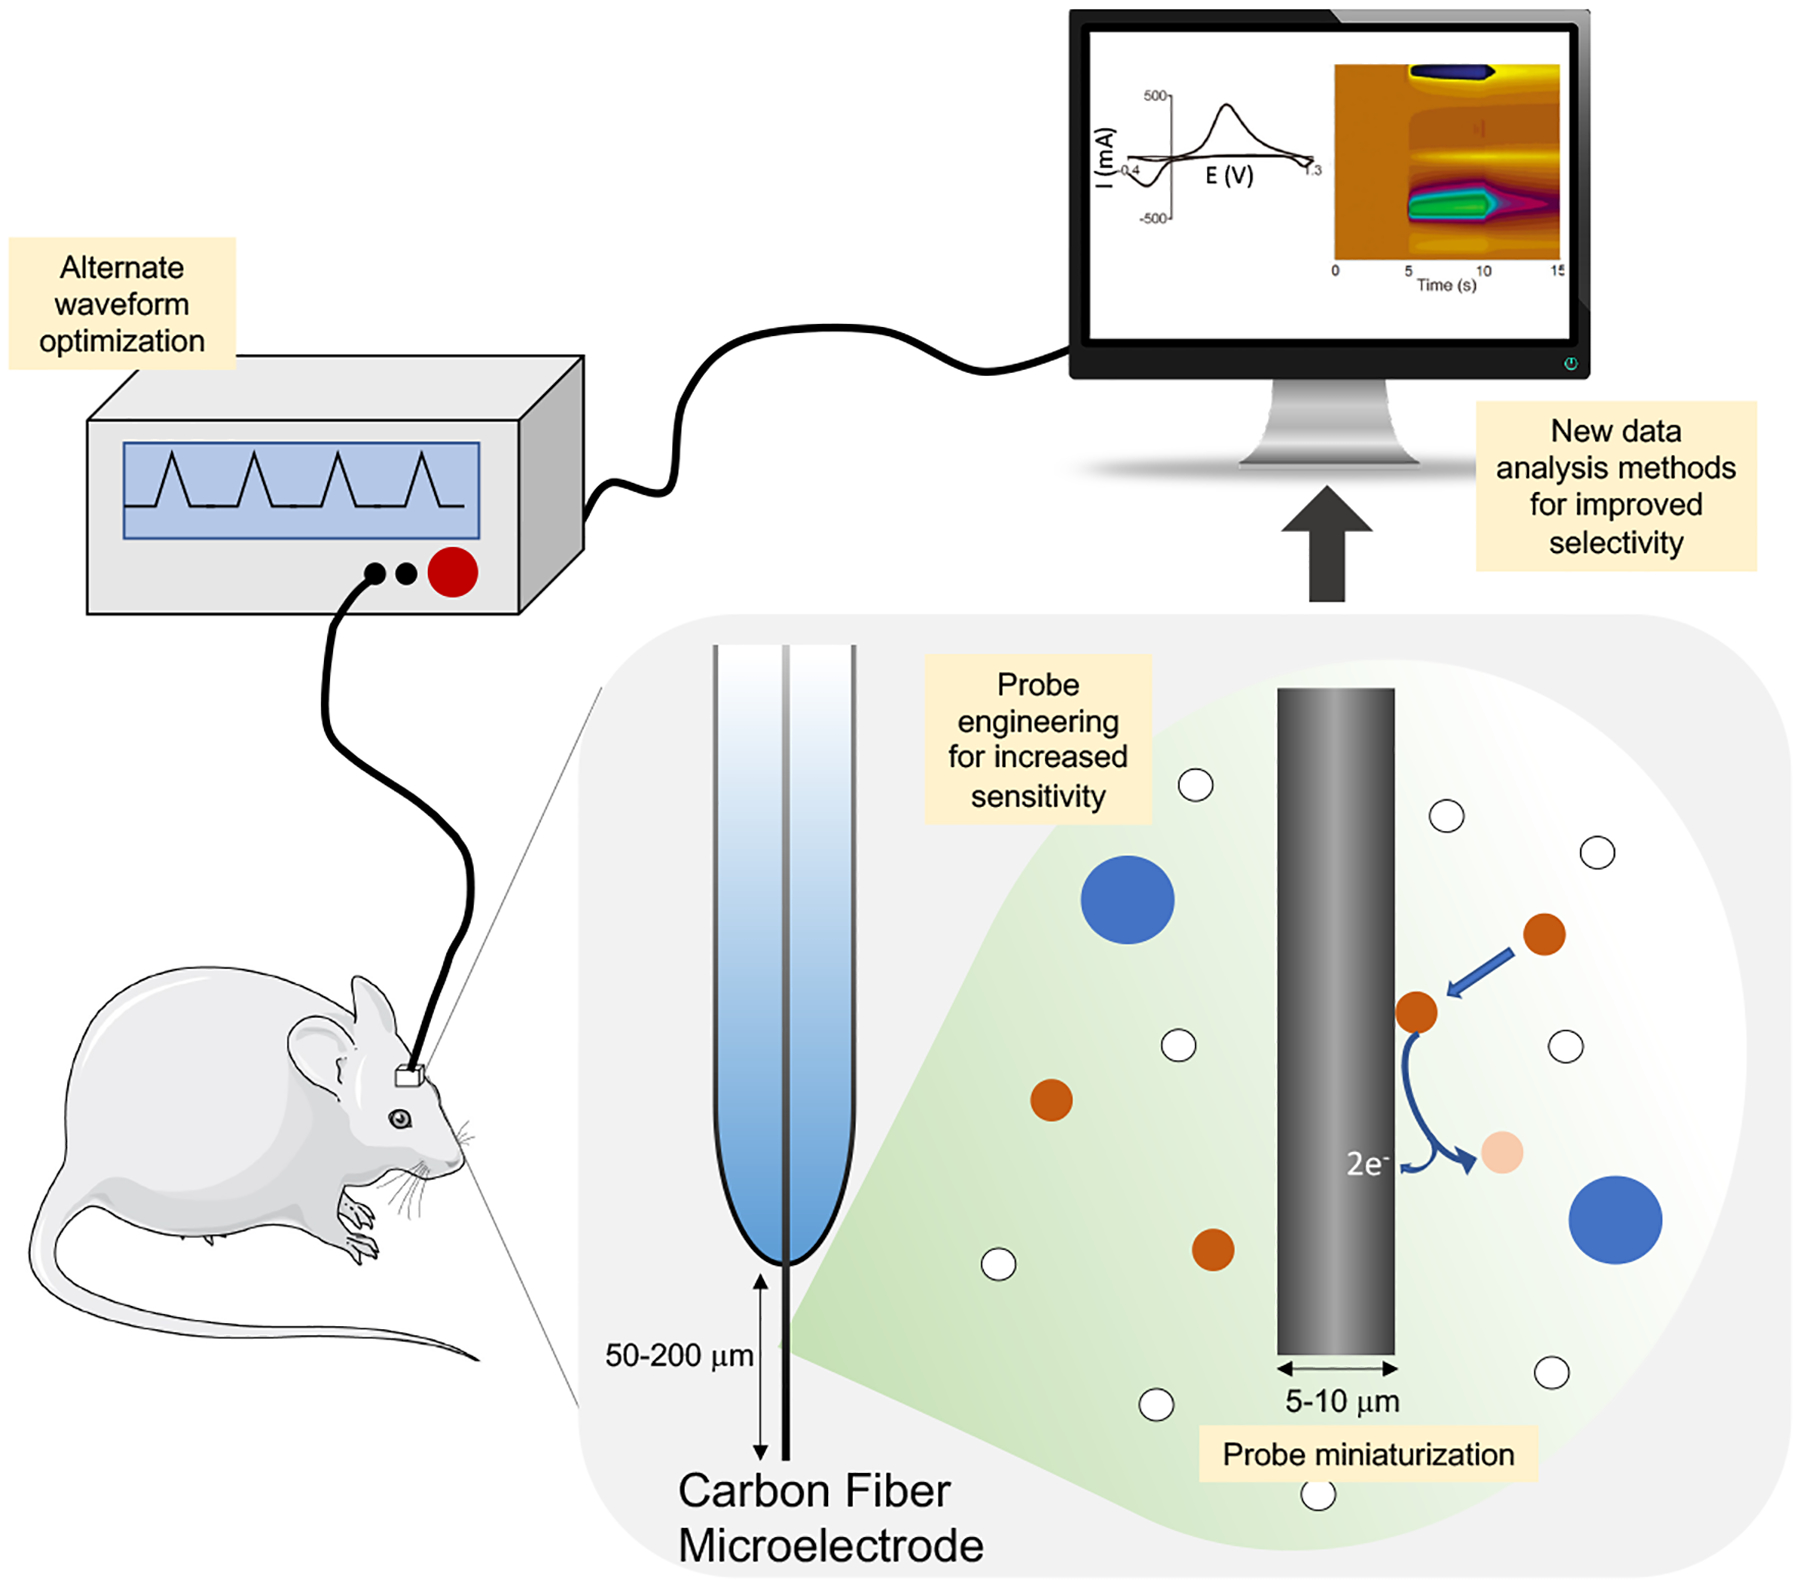
Schematic of general setup for fast scan cyclic voltammetry (FSCV). Yellow boxes highlight areas of development to address challenges in FSCV for in vivo neurochemical detection. Cyclic voltammogram and color plot adapted from (Venton and Cao, 2020).
To achieve millisecond “real-time” temporal resolution, FSCV utilizes fast scanning rates on the order of hundreds of volts per second. FSCV was first reported by Millar and colleagues in 1985, where they used a scan rate of 300 V/s to monitor dopamine release and uptake in the rat striatum (Millar et al., 1985). Since then, FSCV has been frequently used to measure dopamine and other catecholamines in the brains of awake and behaving animals. FSCV is able to monitor phasic dopamine signaling with high sensitivity at a limit of detection in vitro of 8 nM (Heien et al., 2005, 2004). In conjunction with carbon-fiber microsensors, FSCV has even been used to monitor dopamine release in human Parkinson’s patients during a decision making behavioral task (Kishida et al., 2016). In addition to dopamine, FSCV has also been applied to detect serotonin in model animals as well as in human patients (Hashemi et al., 2009; Heien et al., 2004; Moran et al., 2018). FSCV can also detect other brain analytes such as other catecholamines, dopamine metabolites, adenosine, guanosine, histamine, and oxygen (Cryan and Ross, 2019; Heien et al., 2004; Park et al., 2018; Samaranayake et al., 2015; Wang and Venton, 2017).
Recent advances in electrode engineering have also pushed improvements in temporal resolution and sensitivity. For example, the use of carbon nanotube fiber microelectrodes increased the temporal resolution from the approximately 100 ms of standard FSCV for dopamine detection to 2 ms (Zestos and Venton, 2018). Taylor and colleagues observed a marked increase in dopamine sensitivity as a result of applying a PEDOT graphene oxide coating on microfiber electrodes (Taylor et al., 2017). Carbon nanotube yarn microelectrodes allows for better analyte adsorption, resulting in increased sensitivity (Mendoza et al., 2020; Zestos and Venton, 2018). Dopamine trapping with cavity carbon nanopipette electrodes have allowed for signal amplification without large reductions in temporal resolution and high spatial resolution (Yang et al., 2019).
Furthermore, FSCV permits multimodal studies where neurochemical monitoring can be coupled with electrical stimulation and electrophysiological measurements. To determine the relationship between local electrical activity and changes in neurochemical concentrations, probes for simultaneous FSCV and electrophysiological recording have been developed (Hobbs et al., 2017; Owesson-White et al., 2016). Advances in voltammogram analysis, alternate waveform development (other than the traditional triangle waveform, discussion below), and specialized probes have allowed for simultaneous, multiplexed detection of different neurochemicals (Hersey et al., 2021; Rafi and Zestos, 2021a; Wang and Venton, 2017).
2.2. Challenges and optimizations
One of the major limitations of FSCV is poor molecular specificity. The identity of a chemical is determined by the shape of the resultant oxidation curve and redox peak locations. Applying the traditional triangle waveform for detecting dopamine yields similar voltammograms for dopamine and norepinephrine, making it difficult to distinguish between changes in the two analytes (Heien et al., 2003). There is also similarity in the voltammograms of dopamine metabolites DOPAC to 3-MT and L-DOPA, as well as similar redox potentials between serotonin and dopamine or its metabolite 5-hydoxyindole acetic acid (5-HIAA) (Hashemi et al., 2009; Heien et al., 2004; Moran et al., 2018).
There are several strategies that have been developed to improve chemical selectivity. Principal components regression is the main method for FSCV data analysis, which is used to identify distinct features of voltammograms and compare them against training sets of voltammograms of known analyte identity and concentration (Puthongkham and Venton, 2020). Several groups have developed supervised machine learning approaches to discriminate between changes in serotonin and dopamine concentrations from their FSCV recordings (Bang et al., 2020; Moran et al., 2018). Electrode coatings to reduce the accumulation of metabolites and redox side products can also increase chemical selectivity by preventing analytes with similar redox profiles from adsorbing to the electrode surface. For example, Nafion coated electrodes have been used to prevent fouling of carbon fiber electrodes by 5-HIAA whose similarities to serotonin would reduce recording specificity and fidelity (Hashemi et al., 2009). Developments in using alternative waveforms other than the traditional triangle waveform has been an inexpensive and easily implemented method to get around chemical selectivity issues (Puthongkham and Venton, 2020; Rafi and Zestos, 2021b). For example, using a square wave or staircase waveform can increase the sensitivity and selectivity for detecting dopamine to differentiate from other catecholamines (Park et al., 2018). Notably, the development of the “sawhorse” waveform has been used to increase the selectivity of adenosine detection, and has been optimized to be used to detect neuropeptides leu and met-enkephalins with FSCV (Calhoun et al., 2019; Ross and Venton, 2014).
Another limitation of FSCV is that it can only directly measure electroactive neurochemicals, limiting the range of chemicals that can be probed. However, functionalization of electrodes has allowed for improvements in the breadth of chemicals that can be detected via FSCV. For example, carbon fiber microelectrodes have been enzyme-modified to contain convert glucose or L-lactate into the electroactive species H2O2 that can be detected by FSCV (Forderhase et al., 2020; Lugo-Morales et al., 2013; Smith et al., 2017).
FSCV requires the implantation of a large probe that is prone to biofouling, which can reduce the fidelity of chronic recordings in freely moving animals. An additional challenge is that the faradaic current resulting from the redox of analytes on the electrode is extracted upon subtraction of the background current, which can be problematic for chronic recording in brain regions where fluctuations in the background charging current itself is likely to occur. Several factors can result in fluctuations in the background current, including pH changes in the local environment and biofouling of the electrode due to non-specific adsorption of redox by-products and metabolites to the electrode. Inflammation at the site of implantation can result in immune cell encapsulation of microsensors, effectively increasing the impedance of the electrode and also causing shifts in background current (Kozai et al., 2015; Seaton et al., 2020). These factors reduce the sensitivity of FSCV over repeated electrode use (Bennet et al., 2016; Kozai et al., 2015; Takmakov et al., 2010).
Several groups have been working on developing alternative electrode coatings and materials to curb electrode fouling, thus improving compatibility with chronic recording. Bennet and colleagues developed a diamond-based electrode for chronic FSCV in deep brain stimulation devices for implantation in patients (Bennet et al., 2016). Polymeric coatings for electrodes have been engineered to prevent nonspecific molecule adsorption to electrodes (T. Feng et al., 2019; Liu et al., 2017; Puthongkham et al., 2019). Advances in FSCV protocols have also been pursued to improve electrode sensitivity in chronic recordings. Seaton and colleagues developed a three electrode system to combat increases in impedance over prolonged electrode usage (Seaton et al., 2020). Waveforms to prevent fouling and renew the electrode surface between scans have been used to prevent by-product accumulation and increase sensitivity (Cooper and Venton, 2009; Takmakov et al., 2010).
An alternative electrochemical method of detection that yields higher temporal resolution than FSCV is constant-potential amperometry. Rather than applying voltage sweeps, constant-potential amperometry holds an electrode at an oxidizing potential to measure the resulting current, thereby providing real-time measurements. However, because of low chemical resolution, it requires chemical separation methods and preprocessing to gain chemical information, making it difficult to implement in vivo (Bucher and Wightman, 2015). Meanwhile, both FSCV and microdialysis enables detection of a vast array of analytes with high chemical resolution. Microdialysis enables quantification of analytes independent of their electrochemical activity but has limitations for detecting larger analytes. While microdialysis has high chemical resolution and sensitivity towards many analytes, it has limited temporal resolution. In contrast, FSCV has high temporal resolution (<100 ms) and sensitivity, but limited chemical selectively that many recent efforts have been made to ameliorate. Advances in probe engineering have resulted in reduced FSCV probe sizes and reductions in biofouling. Future work will only further improve the applicability of both FSCV and microdialysis for sensitive chronic recording applications.
3. Fluorescence imaging of neurotransmitter and neuromodulator release:
Synaptic transmission is a complex event that can be better accessed optically. Fluorescence imaging with advanced microscopy and an array of synthetic and genetically encoded sensors have become broadly utilized technology in modern neuroscience due to their accessibility, high molecular and cell-type specificity, and high spatiotemporal resolution. Here, we focus on discussing fluorescence sensors that can permit direct measurement of neurotransmitters and neuromodulators in real-time.
3.1. Non-genetically encoded neurochemical probes
Chemical dyes and nanomaterials are rich resources for developing new fluorescence probes. Fluorescent false neurotransmitters (FFN) are synthetic fluorescent neurotransmitter analogs that can trace the accumulation and release of dopamine, norepinephrine, and serotonin with single synapse resolution (Dunn et al., 2018; Henke et al., 2018; Post and Sulzer, 2021). FFNs undergo vesicular loading and release with native neurotransmitters by binding to specific neurotransmitter transporters, such as VMAT2, DAT, NET, and SERT (Gubernator et al., 2009; Henke et al., 2018). FFNs can be especially valuable for analysis of the heterogeneity of presynaptic sites. For example, FFN200 is a VMAT2 substrate that can specifically label dopaminergic neurons (apart from serotonergic neurons) in the striatum, and can report silent dopaminergic vesicle clusters when used in conjunction with endocytic marker FM1-43 (Pereira et al., 2016). By tuning the pH sensitivity of FFNs, changes in fluorescence of these small molecules can report exocytosis and thus neurotransmitter release (Dunn et al., 2018; Rodriguez et al., 2013). FFNs are well suited for imaging neurotransmitter dynamics at the scale of individual synapses in dissociated neuronal culture and in brain slice, and have been used to image cortical norepinephrine dynamics in vivo (Dunn et al., 2018). It can also be used for high-throughput pharmacology bioassays to identify new inhibitors for monoamine transporters (Bernstein et al., 2012).
Near infrared sensors based on carbon nanotubes are engineered by sonicating single wall carbon nanotubes with oligonucleotides and can be evolved to specifically bind to analytes of interest (Jeong et al., 2019; Yang et al., 2021). Near-IR catecholamine sensors (nIRCatS) detect local dopamine release in striatal slices elicited by electrical stimuli (Beyene et al., 2019; Yang et al., 2021). Near-infrared 5-HT probes (nIRHT) can detect exogenous 5-HT in acute brain slices (Jeong et al., 2019). The near-IR spectrum provides flexibility for simultaneous imaging with other dyes and sensors, as well as optogenetic tools in the visible spectrum. Additionally, the nanosensors are compatible with both genetically tractable and intractable organisms, making them easy to use and potentially compatible for human applications. Some other advantages nIRCats offer over genetically-encoded fluorescent indicators are they: 1) do not need viruses to express the sensor, 2) do not need time for cells to express the sensors, and 3) do not photobleach and are photo-stable (O’Connell et al., 2002; Yang et al., 2021). However, these sensors are not able to distinguish between dopamine and norepinephrine, and thus further optimization is needed to improve chemical specificity. In addition, application in vivo has yet to be seen.
Though chemical probes allow for sensitive detection of synaptic neurochemical dynamics and a broad range of potential applications in model animals and potential compatibility in humans, they do not offer information about cell-type specificity and may thus require post hoc immunostaining or parallel utilization of genetic labeling tools for increased specificity (Pereira et al., 2016).
3.2. Genetically Encoded Fluorescent Indicators for Neurotransmitters and Neuromodulators
In the past decade, the development and refinement of fluorescent genetically encoded calcium and voltage indicators (Abdelfattah et al., 2019; Baird et al., 1999; Carandini et al., 2015; Chen et al., 2013; Dana et al., 2019; Miyawaki et al., 1997; Nakai et al., 2001; Piatkevich et al., 2019; Tian et al., 2009; Villette et al., 2019; Yang et al., 2018; Zhao et al., 2011) has advanced capabilities in sensor design, optimization, characterization, and validation, as well as improved our understanding of how to apply these tools in behaving animals. This know-how paved the way for the development of genetically encoded indicators (GEIs) for neurotransmitters, neuromodulators, and neuropeptides (Table 1).
Table 1:
Summary of significant genetically encoded indicators for monitoring neurotransmitters. Kd values listed are determined in (a) purified protein, expressed in (b) HEK293T, or (c) in dissociated neuronal culture. (e) Only off-target analytes that elicit the same type of response as the target analyte were listed, i.e. for single FP sensors, listed off-target analytes that also cause an increase in fluorescence upon sensor binding.
| Sensor | Target analyte | PBP or GPCR | Single FP or FRET pair | Kd (uM) | Off-target analytes e | Other spectral variants/FP | Further iterations (with improved affinity, kinetics, or dynamic range) |
|---|---|---|---|---|---|---|---|
| FLIPE-600n (Okumoto et al., 2005) | Glutamate | PBP | ECFP, Venus | 0.63 a | Aspartate, Glutamine, Asparagine | FLIPE-10u, FLIPE-100u, FLIPE-1m (Okumoto et al., 2005) FLI81PE-1u (Deuschle et al., 2005) | |
| superGluSnFr (Hires et al., 2008a) | Glutamate | PBP | ECFP, Citrine | 2.5 c | Aspartate, Glutamine | ||
| iGluSnFr (Marvin et al., 2013) | Glutamate | PBP | cpGFP | 4.9 c | Aspartate | SF-Venus-iGluSnFr / cpVenus (Marvin et al., 2018) R-iGluSnFr / cpmApple (Wu et al., 2018) | SF-iGluSnFr A184S, SF-iGluSnFr S72A (Marvin et al., 2018) iGluu, iGluf (Helassa et al., 2018) |
| iGABASnFr (Marvin et al., 2019) | GABA | PBP | cpSFGFP | 30 c | Alanine, Glycine, Histidine | ||
| GlyFS (Zhang et al., 2018) | Glycine | PBP | ECFP, Venus | 21.4 a | Leucine, Valine, Threonine | ||
| dLight1.1 (Patriarchi et al., 2018) | Dopamine | GPCR | cpGFP | 0.33 b | Norepinephrine, Epinephrine | YdLight1 / cpGFP, RdLight1 / cpmApple (Patriarchi et al., 2020) | dLight1.2, dLight1.3, dLight1.4 |
| GRABDA (Sun et al., 2018) | Dopamine | GPCR | cpGFP | 0.13 b (GRABDAlm) 0.01 b (GRABDA1h) | Norepinephrine | rGRABDA1m, rGRABDA1h / cpmApple (Sun et al., 2020) | GRABDA2m, GRABDA2h (Sun et al., 2020) |
| iSeroSnFr (Unger et al., 2020) | Serotonin | PBP | cpGFP | 0.39 b | Dopamine, Tryptamine | ||
| psychLight (Dong et al., 2021) | Serotonin | GPCR | cpGFP | 0.0263 b | 5-HT2AR agonists | ||
| GRAB5-HT (Wan et al., 2021) | Serotonin | GPCR | cpGFP | 0.022 c | No significant response | ||
| GRABNE (J. Feng et al., 2019) | Norepinephrine | GPCR | cpGFP | 1.9 c (GRABNE1m) 0.093 c (GRABNE1h) | Dopamine, Epinephrine, α2AR agonists | ||
| GAch2.0 (Jing et al., 2018) | Acetylcholine | GPCR | cpGFP | 2 c | No significant response | GAch3.0 (Jing et al., 2020) | |
| iAchSnFr (Borden et al., 2020) | Acetylcholine | PBP | cpSFGFP | 0.4 c | Choline, Serotonin, Nicotine, Oxotremorine | Y-iAchSnFr / cpVenus | |
| iNicSnFr (Shivange et al., 2019) | Nicotine | PBP | cpSFGFP | 19 a (iNicSnFr3a) | Acetylcholine, Choline, Varenicline |
The basic design principle of fluorescent biosensors for neurochemical detection is to couple ligand-induced conformational changes of a ligand binding domain to the fluorescent intensity changes of the reporter domain, thus providing an optical readout of chemical transients. The reporter element typically employs either a single fluorescent protein (FP) or a FRET pair of donor and acceptor FPs. Upon ligand binding, conformational change in the recognition element leads to changes in fluorescence intensity of a single FP or FRET between two FPs. Genetically encoded indicators for glutamate, the predominant excitatory neurotransmitter in the brain, are one of the earliest developed for imaging in the brain. FLIPE is the first engineered glutamate sensor with an affinity (measured by Kd) of 600 nM, by fusing FRET pairs with bacterial glutamate periplasmic binding protein (PBP) YbeJ/GltI (Okumoto et al., 2005). GltI was chosen as the molecular recognition domain of the sensor for its “venus flytrap”-like conformational change in response to glutamate binding, where two lobes of the protein come together. FRET pairs ECFP and Venus (YFP) were attached on opposing sides of a lobe of GltI so that upon glutamate binding, GltI closure causes their movement away from each other and a reduction in FRET efficiency (Fig. 4A). In 2008, the FRET sensor superGluSnFr improved on existing FRET glutamate sensors with increased response magnitude (changes in FRET efficiency upon glutamate binding) and operation at a more physiological range of glutamate concentrations in neuronal culture (Hires et al., 2008a).
Figure 4:
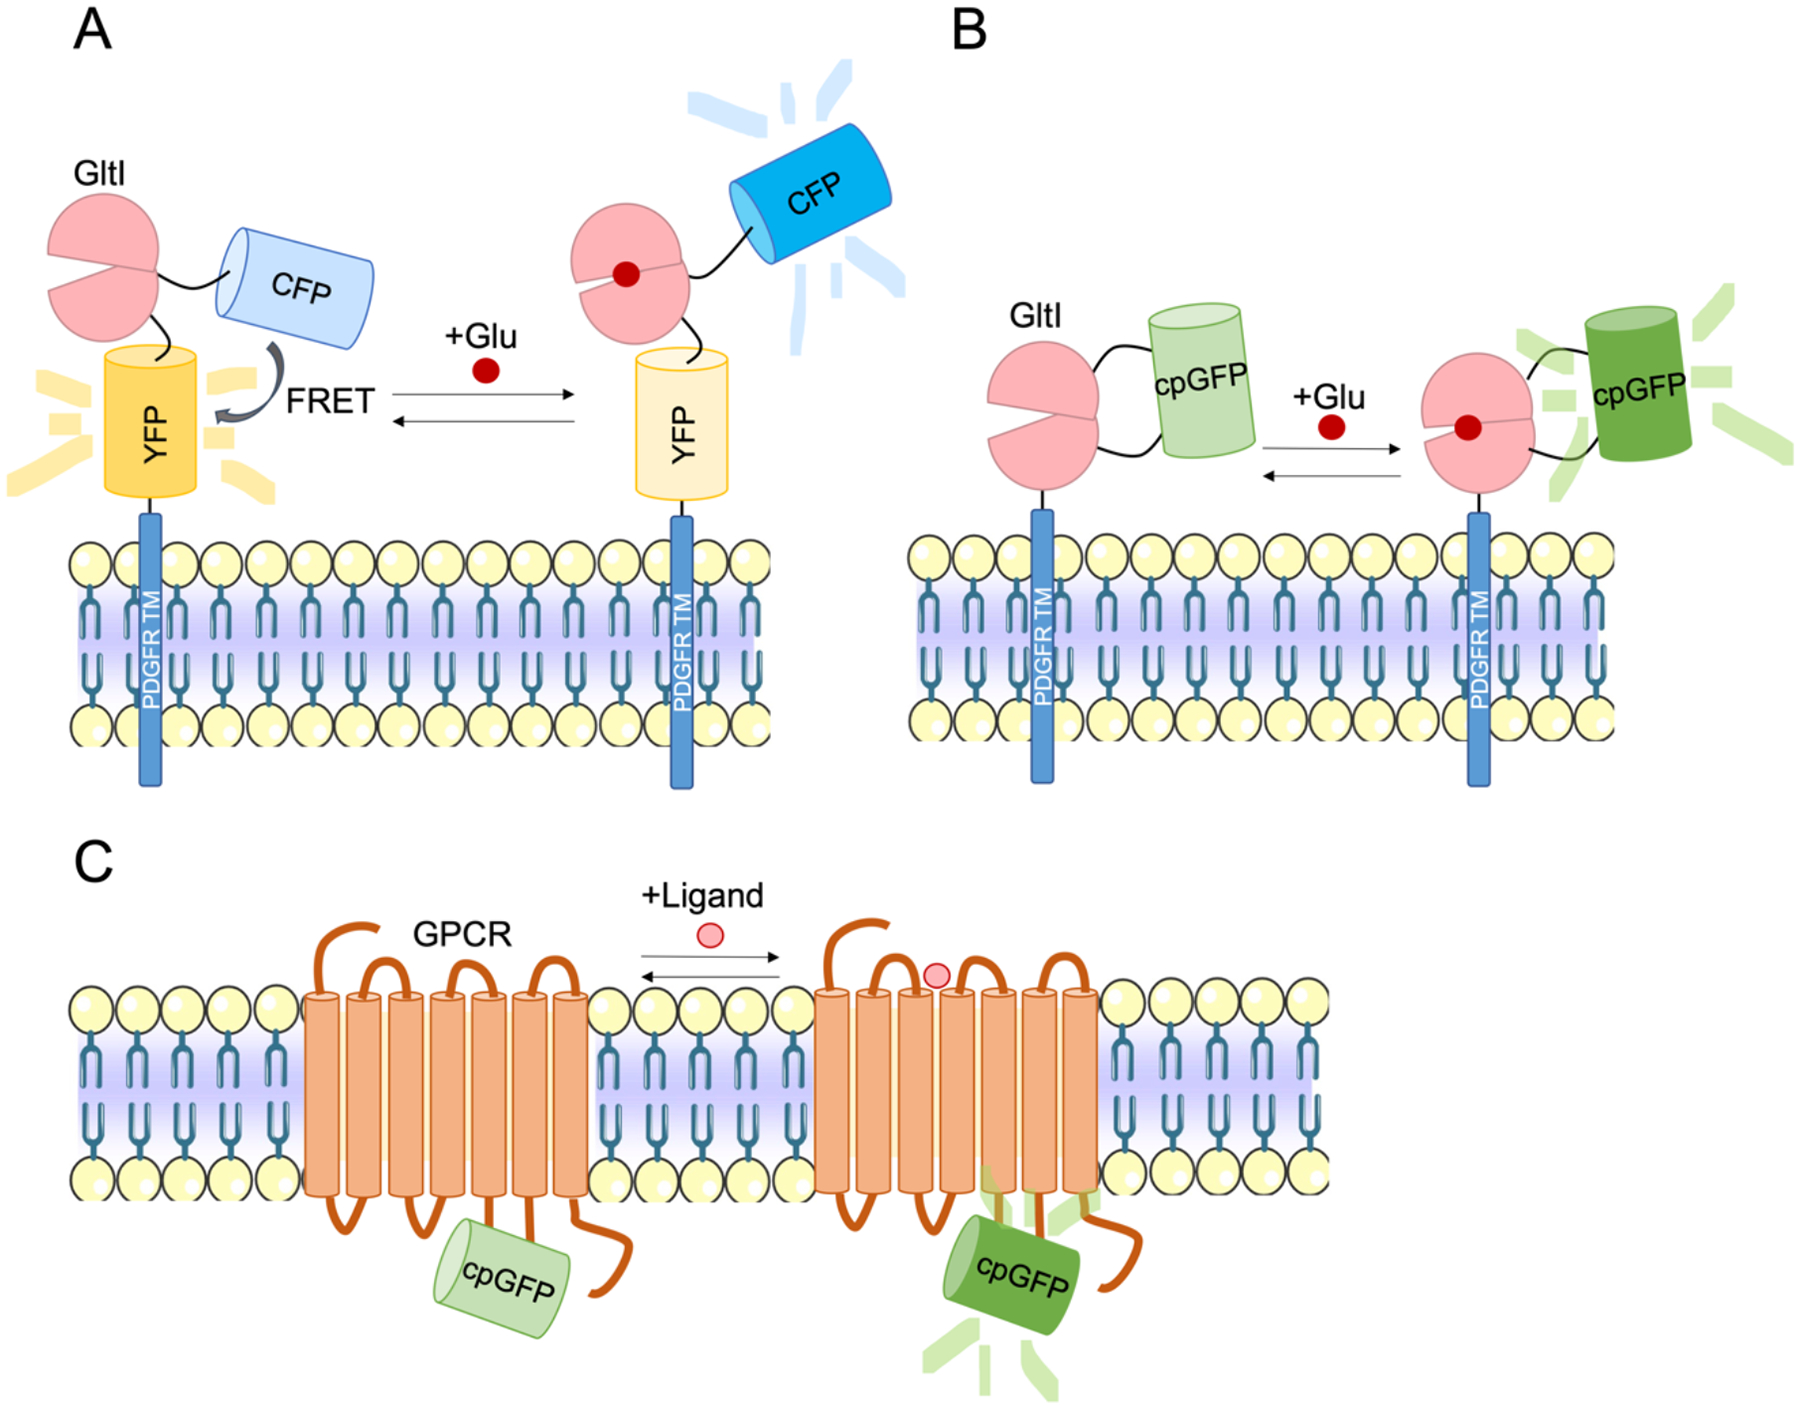
(A) Schematic of action of FRET glutamate sensor FLIPE (Okumoto et al., 2005). FLIPE consists of FRET pairs CFP and YFP (Venus) that reduces in FRET efficiency upon glutamate binding to GltI. (B) Schematic of iGluSnFr, which increases in fluorescence upon glutamate binding (Marvin et al., 2013). (C) Schematic of a generalized GPCR sensor that contains a GPCR with cpGFP fused to IL3. Ligand binding induces a conformational change in the GPCR that results in an increased in fluorescence.
Single FP sensors, utilizing the development of circularly permuted FPs (like those used in the widely used calcium indicators GCaMP), offers many advantages compared to FRET sensors. Thus far, the applicability of FRET sensors for imaging neurotransmitter release is limited to use in brain slice or in dissociated neuronal culture, primarily due to the limited dynamic range of these ratiometric measurements (Hires et al., 2008a; Okumoto et al., 2005). Single FP based indicators offer several appealing advantages for in vivo application, such as superior sensitivity, enhanced photostability, broader dynamic ranges and faster kinetics compared to FRET-based indicators. Tables comparing the properties of existing single FP and FRET neurotransmitter sensors have been generated in prior reviews (Bi et al., 2021; Leopold et al., 2019). They are relatively small, and are thus relatively easier to be targeted to sub-cellular locations, such as spines and axon terminals. The preserved spectrum bandwidth of single-FP indicators can allow for multiplexed imaging or use alongside optogenetic effectors such as channelrhodopsin. iGluSnFr is the first single FP glutamate sensor, consisting of circularly permuted GFP (cpGFP) fused to YbeJ/GltI, the PBP utilized in early FRET glutamate indicators (Fig. 4B) (Marvin et al., 2013). iGluSnFr was engineered by rational design to determine the insertion location of cpGFP into GltI near the hinge region of the protein that facilitates domain opening and closing (venus flytrap-like motion). Marvin et al. also performed site-saturated mutagenesis and high-throughput screening of the linker regions that connect cpGFP to GltI to achieve a high dynamic range sensor that they validated in neuronal culture, brain slice, and in vivo in fish, mice, and C. elegans (Marvin et al., 2013). Recent engineering efforts have led to the improvement of the brightness and affinity of iGluSnFr and expand available color variants (SF-iGluSnFr) (Marvin et al., 2018). Helassa and colleagues have also pursued improvements to the affinity and kinetics (iGluf, iGluu) of iGluSnFr to enable imaging of high-frequency release in hippocampal slice (Helassa et al., 2018).
Microbial PBPs form a large protein superfamily that bind numerous classes of small molecules and peptides. Ligand binding in PBPs induces a large venus flytrap-like conformational change, which is highly conserved. These unique features have been used to develop a toolkit of highly sensitive sensors for other neurochemicals, including GABA(iGABASnFr), ATP (iATPSnFR), acetylcholine (iAchSnFR) and nicotine (iNicSnFr) (Borden et al., 2020; Lobas et al., 2019; Marvin et al., 2019; Shivange et al., 2019). However, there are several analytes for which bacterial PBPs do not exist. We recently developed the PBP-based sensor iSeroSnFr for serotonin, which does not naturally have any known associated PBPs. We used machine learning guided evolution of an existing PBP-based sensor, iAchSnFr (Borden et al., 2020), to redesign its binding pocket to report serotonin release at physiological concentrations (Unger et al., 2020). We utilized iSeroSnFr to detect serotonin in cultured neurons, brain slice, and for detecting behaviorally triggered serotonin release in mice using fiber photometry (Unger et al., 2020).
As an alternative to PBP-based sensors, recently, sensors for monoamine neurotransmitters have been developed by fusing eukaryotic G-protein-coupled receptors (GPCRs) with fluorescent reporters. As the endogenous receptors of neurochemicals, GPCRs have the evolved affinity and specificity relevant to binding of neurochemicals released at physiological ranges. The first generation of GPCR-sensors were FRET-based and were mostly applied in cultured neurons to study receptor kinetics (Hoffmann et al., 2005; Jensen et al., 2009; Maier-Peuschel et al., 2010; Vilardaga et al., 2003). However, use of these sensors in vivo has been limited due to low dynamic range and sensitivity (Leopold et al., 2019; Bi et al., 2021). The iTango biosensor was developed to amplify the signal produced by ligand binding to induce gene expression via β-arrestin signaling, labeling cells that have undergone GPCR activation (Barnea et al., 2008; Smith et al., 2017). However, the poor temporal resolution of an hour or more for signal amplification and expression and the irreversible nature of this system necessitated GEIs that can capture the fast dynamics of neurochemical release. To overcome these barriers, single-FP based GPCR sensors have been recently developed.
GPCRs have seven transmembrane (TM) alpha helices, where the largest conformational change upon activation is thought to occur for TM domains 5 to 7 (Latorraca et al., 2017). Thus far, cpFPs have been inserted in the intracellular loop 3 (IL3) domain of GPCRs, which bridges TM5 and TM6, to detect this conformational change upon ligand binding (Fig. 4C). Using this versatile strategy, our lab developed the Light sensor family, consisting of dopamine, norepinephrine and serotonin sensors by inserting cpGFP into human GPCRs, including DRD1, 2, or 4, β2AR and 5-HT2A receptors (Dong et al., 2021; Patriarchi et al., 2018). Through linker screening by site-directed mutagenesis we engineered high affinity, fast indicators that were amenable to recording dopamine release in several brain regions in vivo and ex vivo (Patriarchi et al., 2018). We also engineered other red-shifted color variants of dLight1 for multiplexed neurochemical detection (Patriarchi et al., 2020). Parallel work in dopamine GEI engineering has been carried out with the engineering of the GRAB-DA sensors using DRD2 as the scaffold (Sun et al., 2020, 2018). Jing and colleagues developed the GACh family of sensors by inserting cpGFP in a chimeric muscarinic acetylcholine receptor (M3R) with an IL3 domain derived from β2AR (Jing et al., 2018). Similar to the Light series, GRAB sensors have also been expanded to norepinephrine, serotonin, and adenosine, and implemented in culture, slice, and in behaving rodents (Feng et al., 2019; Wan et al., 2021; Wu et al., 2020).
Challenges for Neurochemical Monitoring with genetically encoded indicators
3.2.1. Mesoscopic and microscopic view of neurotransmitter and neuromodulator release
A major advantage of neurochemical monitoring using genetically-encoded sensors is that it permits long-term recording where the same cells can be revisited and imaged over the timescale of days to months (Chen et al., 2012). The transgene that encodes the fluorescent indicator is typically delivered via targeted or systemic injection of adeno-associated virus (AAV) and its derivatives (e.g. AAV-PHP.eB), followed by a few weeks of expression before imaging. In addition, genetic tools like Cre/loxP, Flp/FRT, and the Gal4/UAS system can be combined with sensors to permit cell-type specific expression. Subcellular targeting of GEIs allow for specific localization of sensors to cellular compartments of interest, such as the soma, cytosol, or the pre or post-synapse. For example, we have tethered iSeroSnFr to full length neuroligin for post-synaptic targeting and synaptic release measurements of serotonin (Unger et al., 2020). Using one-photon and multiphoton (2p and 3p) imaging and the miniaturization of these microscopes, cells can be imaged through a thinned skull or cranial window in head-fixed or freely-moving animals (Zong et al., 2017). However, due to light scattering in deeper brain regions, a maximum of about >1 mm from the surface of the brain can be imaged with multiphoton microscopy. Fluorescence microendoscopy and fiber photometry, on the other hand, are compatible with protein-based sensors and can be used to record release in deeper brain regions.
The spatial resolution is determined, in part, by the resolution of the optical system utilized for imaging. However, precise localization of analyte concentration changes below the theoretical resolution of the optical system is possible. Dürst and colleagues used fast spiral scanning of iGluSnFr to localize points of presynaptic glutamate release (vesicle fusion) within single boutons in slice cultures (Dürst et al., 2019). Farsi and colleagues demonstrated that single quantal vesicular release can be detected by iGluSnFr in hippocampal boutons in neuronal culture (Farsi et al., 2021). In combination with other tools such as cell type-specific optogenetic or chemogenetic actuators, these sensors allow us to gain an understanding of circuit-specific mechanisms with unprecedented spatial resolution, which is difficult to achieve with microdialysis or FSCV.
Besides recording local release, it is also critical to understand large-scale neuronal activity in disease or behavior. Widefield imaging of glutamate dynamics through an intact skull with iGluSnFr has been used to observe meso-scale cortical glutamate dynamics in rodents (Hefendehl et al., 2016; Xie et al., 2016). For example, McGirr and colleagues performed longitudinal widefield iGluSnFr imaging in mice to elucidate the effects of ketamine in a social defeat behavioral paradigm (McGirr et al., 2017). Fast volumetric calcium imaging with cellular resolution has become possible through innovations in multiphoton microscopy, setting the stage for future potential applications for imaging neurotransmitter GEIs. For example, Weisenburger et al. recorded the activity of over 10,000 GCaMP expressing neurons with their volumetric hybrid 2p-3p calcium imaging setup (Weisenburger et al., 2019). Optoacoustic imaging has allowed for fast whole-brain imaging of calcium dynamics in GCaMP expressing mice with moderate 150 μm resolution (Gottschalk et al., 2019). Creating brighter sensors with new spectral variants may aid in the translation of these new high resolution volumetric calcium imaging modalities to neurotransmitter or neuromodulator sensors in the near future. In contrast, microdialysis and FSCV are single point recording techniques that do not permit ensemble recordings with high resolution or specificity.
3.2.2. Optimizing the intrinsic properties of sensors
Synaptic release and uptake occur on the millisecond timescale whereas spillover and volume transmission occur at longer time scales, necessitating sensors with kinetics at various physiological time scales. Most single-FP GEIs for imaging neuromodulators have subsecond on- and off-rates (Sabatini and Tian, 2020). As previously mentioned, ultrafast variants of iGluSnFr (τon of 460 μs, τoff 2.6 ms μs for iGluu) have been engineered to image the fast dynamics of high frequency (100 Hz) glutamate release in organotypic slice culture (Helassa et al., 2018). A limitation to further improving sensor kinetics is the nature of fluorescence generation using cpFPs after ligand binding. Reconstitution of the fluorescent complex (may it be two parts of a PBP sensor or bringing together GPCR strands) and subsequent conformational change is first needed before fluorescence modulation (Helassa et al., 2018). The temporal resolution for GEIs is thus limited by the timescale of ligand binding domain rearrangement and transduction to the fluorescent reporter.
Although using natural receptors should allow for high sensitivity detection, to view single quantal release with high SNR and lower the limit of detection of GEIs, further engineering is often needed. The sensitivity of these sensors is determined by the dissociation rate and dynamic range, and can be altered by basal ligand concentrations. High SNR sensors, however, may come at a cost to temporal resolution, as sensors with slow decay kinetics allow for more time for photon detection. Engineering GEIs with large changes in fluorescence in response to even low levels of an analyte of interest, often by linker screening, is critical for low limits of detection for in vivo imaging. High affinity variants of GltI, the PBP involved in iGluSnFr, have been screened and explored by several groups in order to improve the detection limits of glutamate sensors (Helassa et al., 2018; Hires et al., 2008b; Marvin et al., 2018). Creating high affinity sensors with slow off kinetics and high expression, however, could result in ligand buffering effects and disruption of endogenous activity. Negative physiological effects as a result of ligand buffering and calcium dysregulation due to calcium GEI expression, including versions of GCaMP, have been reported in several studies (Gasterstädt et al., 2020; McMahon and Jackson, 2018; Steinmetz et al., 2017; Yang et al., 2018). It has become more of the standard to express GEIs under the relatively weak neuronal specific synapsin promoter to curb these potential effects. Further efforts in sensor engineering will be needed to ensure minimal disruption to host processes. For example, GCaMP-X was engineered based on the findings that GCaMP was shown to disrupt endogenous voltage-gated calcium channel function by causing calcium dysregulation (Yang et al., 2018). iGluSnFr has also been found to compete with glutamate transporters and have buffering effects, so sensor engineering efforts must be made to curb this disruption of endogenous activity (Armbruster et al., 2020).
The use of naturally occurring receptors or designed binding proteins as scaffolds affords for high chemical selectivity; however, binding to off-target analytes, especially to structurally related molecules can potentially complicate studies where multiple neurotransmitter release mechanisms are expected (Table 1). Glutamate sensors like FLIPE and iGluSnFr can respond to both glutamate and aspartate binding (Marvin et al., 2013; Okumoto et al., 2005). iGABASnFr can respond to glycine and iAchSnFr can detect choline and nicotine (Borden et al., 2020; Marvin et al., 2019). Previously, we discussed how FSCV can yield similar voltammograms for dopamine and structurally similar norepinephrine and epinephrine. Similarly, GRAB-DA and dLight can also respond to norepinephrine (Patriarchi et al., 2018; Sun et al., 2020), although with reduced affinity. For example, dLight has 70 fold and 40 fold lower affinity for norepinephrine and epinephrine, respectively, to dopamine (Patriarchi et al., 2018). It is likely that for future sensors that are able to bind nonspecifically to structurally related analytes, binding pocket engineering like that undergone to engineer iSeroSnFr can reduce nonspecific binding affinity (Unger et al., 2020). A further limitation for GPCR-based sensors is their ability to respond to drug modulation that may target that specific receptor. While this may make this class of sensors difficult for studies that seek to measure changes in drug-mediated changes in target concentration, it can also be an added benefit. In our recent work, we demonstrated that psychLight has applications in not only in vivo detection of serotonin release, but also as a tool for predicting the hallucinogenic potential of known and novel psychoplastogenic compounds in vitro (Dong et al., 2021).
Simultaneous detection of different neurochemicals with biosensors are relatively challenging compared to microdialysis because of the need to avoid spectral overlap. The majority of well-characterized single FP GEIs use GFP, though in the past few years, efforts have been made to develop red-shifted versions of sensors that need further development for widespread in vivo use. Different color variants of fluorescent GEIs will allow for flexibility with not only other sensors for simultaneous analyte detection, but also with other optogenetic actuators. Beyond fluorescent protein based GEIs, hybrid far-red calcium and voltage indicators based on the self-labeling protein HaloTag have been developed (Deo et al., 2021). The development of orthogonal fluorescent GEIs with different mechanisms of action, color variants, and targets will allow us the flexibility to answer an even broader range of neuroscience questions.
A disadvantage of GEIs that is shared with FSCV is their inability to determine absolute basal concentrations of an analyte of interest. While relative changes in concentration can be calculated from changes in fluorescence by referring to dose-response curves, basal concentrations cannot be estimated with intensity-based indicators, though it has been attempted with FRET sensors, for example using the glycine sensor GlyFS (Zhang et al., 2018). Perhaps the development of fluorescence lifetime-based indicators, such as a recent calcium indicator released by van der Linden and colleagues, could allow for quantification of basal analyte concentrations (van der Linden et al., 2021).
3.2.3. Challenges in image analysis
Single FP sensors utilize the metric dF/F0, where measurements of the change in fluorescence intensity are normalized by baseline fluorescence intensity (F0) to quantify changes in analyte concentration. However, several factors can interfere with accurately converting dF/F0 to changes in concentration. For example, sensor aggregation due to high sensor expression would invariably result in diluted apparent dF/F0 values. Furthermore, as fluorescence values are normalized by a “baseline” fluorescence intensity for a period of time before the event of interest, drifts in conditions that cause baseline fluorescence values to shift irrespective of analyte levels would interfere with accurate quantification. Sample movement, photobleaching, and pH sensitivity can all result in changing baseline levels throughout the course of an experiment. The consequences of having a noisy F0 and a suggestion for data quantification in light of this is discussed in a recent work (Sabatini and Tian, 2020).
A further challenge for consistent reporting of neurochemical dynamics between different studies is the lack of standardization in image processing and analysis techniques. In vivo imaging with neurotransmitter sensors presents many challenges, including diffuse membrane and neuropil expression, motion artifacts from imaging freely moving animals, and high autofluorescence and low sensor signal with the use of minimal laser power to minimize photodamage to the tissue and reporter bleaching. Multispectral imaging can be used to unmix autofluorescence in vivo since the spectrum of objects contributing to autofluorescent background are often broader than the fluorescent markers (Mansfield et al., 2005). However this can be complicated by the many variable sources of autofluorescence (from blood) in a tissue, which makes it difficult to determine the spectral properties of all components in the sample required for accurate automated unmixing (Mansfield et al., 2005). Additionally, uneven fluorescence illumination and detection across a field of view makes it difficult to accurately and precisely quantify fluorescence (Kozlowski and Weimer, 2012). Therefore, considerations for region of interest (ROI) selection, background subtraction, and motion artifact correction are important. For example, different methods for ROI determination for measuring mean fluorescence have been utilized for in vivo and ex vivo use of established neurotransmitter sensors, ranging from whole frame ROIs to ROIs obtained by manual selection or automatic segmentation (Marvin et al., 2013; Patriarchi et al., 2018; Sun et al., 2018). Each technique can result in different dF/F0 results and consistency issues when comparing results from different groups utilizing the same sensor. The measured fluorescent changes from whole frame ROIs are diluted by background pixels with no sensor expressed, thus making the magnitude of fluorescence changes dependent on both noise from background and on sensor expression levels within a field of view. Meanwhile, segmenting an image to restrict measurement to areas of sensor expression can be a work-around for low SNR images and will minimize the “dilution” effect of fluorescence changes when including background pixels where no sensor is expressed.
While much work has been done to develop open-source image analysis software for in vivo calcium imaging (Cantu et al., 2020; Giovannucci et al., 2019; Tegtmeier et al., 2018), the inherent differences between intracellular expressed calcium indicators and synaptic and membrane targeted transmitter sensors may limit their translatability. Detecting and quantifying neurochemical release at the level of individual synapses have been explored (Dürst et al., 2019; Farsi et al., 2021), and perhaps recent advances in synapse detection algorithms for fluorescent images may further improve the accessibility and accurate quantification of synaptic release analysis using GEIs (Feng et al., 2012; Kulikov et al., 2019; Wang et al., 2019). An open-source software suite (pMAT) for analysis of fiber photometry data has been recently developed, allowing for implementation of a standardized data analysis pipeline across groups (Bruno et al., 2021). As isosbestic points for various sensors could vary, further development can be done to accommodate signal normalization based on other spectra. Nonetheless, there is a need for new open-source tools for automated analysis of longitudinal imaging with neurotransmitter GEIs with microscopic applications.
Outlook
We are in a new and exciting era of neurochemical recording. Emerging questions proposed by neuroscientists and lessons learned in creating a variety of technologies will serve as the nexus for the development of novel neurochemical probes. Besides techniques discussed above, other chemical and cell-based approaches have also been developed to monitor neurochemical dynamics. Though fluorescence imaging provides high spatiotemporal resolution, it is not compatible with human applications. Positron emission tomography (PET) and magnetic resonance imaging (MRI) using nuclear medicine or genetically encoded probes provide information at the whole-brain level and have been broadly used for diagnosis in humans, albeit with poor spatial and temporal resolution (Finnema et al., 2015; Li and Jasanoff, 2020; Shimojo et al., 2020). The development of cell-based neurotransmitter fluorescent engineered receptors (CNiFERs) is another detection method for dopamine, norepinephrine and neuropeptides (Muller et al., 2014). CNiFERs are cells that express GPCRs that are activated upon ligand binding, resulting in calcium influx and a change in fluorescence in the FRET-based calcium reporter TN-XXL. This technique, though, requires the invasive implantation of cells and lacks the cell-type or subcellular specificity of genetically encoded indicators. Aptamers, single stranded oligonucleotides that fold into 3D structures, have been engineered to bind neurochemicals with high sensitivity and specificity (Ellington and Szostak, 1990; Gold et al., 1995). Aptamers have been used for electrochemical biosensors to detect the rearrangement of aptamer structure as a result of ligand binding, and have potential for sensitive and specific neurochemical detection in vivo in the near future (Nakatsuka et al., 2018).
The type of neurochemical molecules is substantially diverse (e.g. more than 100 known neurotransmitter/modulators) contributing to the myriad inputs signals to the circuit (Kovács, 2004). Together with heterogeneity within cell types, it is a grand challenge to elucidate circuit mechanisms and function. Fluorescence imaging permits cell-type specific measurement of diverse signaling inputs and post-synaptic activity, as well as provides a cellular map of neurochemical transients across the full-course of behavior, which is difficult to achieve with analytic or electrochemical methods (Table 2). Combined with optogenetic and chemogenetic actuators, we can specifically tease apart the input-output interactions within neural circuits.
Table 2:
Summary of comparisons between microdialysis, FSCV, and fluorescent GEIs based on important parameters for evaluating tools for neurochemical detection.
| Assessment Criteria | Microdialysis | FSCV | Fluorescent genetically encoded indicators |
|---|---|---|---|
| Chemical resolution | High Wide range detected with high specificity | Medium Mainly electroactive chemicals, though others can be detected | Medium-high Sensor engineering to tune affinities to off-target analytes |
| Spatial resolution | Low, limited by probe size (≥1 mm long, ~200 μm diameter) | Medium-high, limited by probe size (≥50 μm long, 5–10 μm diameter) | High, tunable from subcellular to circuits/populations |
| Temporal resolution | Low, sub-minutes to minutes | Sub-second resolution (≥2–100 ms) | Sub-second resolution, tunable with sensor engineering and optical system |
| Sensitivity | High, at a cost to temporal resolution | High, lessens for chronic recording because of biofouling | Medium-high, sensor engineering efforts to improve affinity and brightness |
| Invasiveness | Probe insertion causes tissue damage and resulting ischemia alters surrounding tissue activity | Miniaturized probes allow for reduced tissue damage and chronic recording | Low, non-invasive possible with intact skull imaging |
| Accessibility/Practicality | Permits multimodal studies and multiplexed detection of neurochemicals. Needs specialized chemical analysis equipment |
Permits multimodal studies Accessible commercially available technology |
Limitations on multiplexing GEIs Future engineering efforts to broaden palette of available sensors |
| Model Organisms | Mice, rats, dogs, rabbits, hamster, Jonah crab, pigs, rhesus macaque, humans | Drosophilia melanogaster, mice, rats, zebrafish, pigs, rhesus macaques, humans | Escherichia coli, D. melanogaster, Caenorhabditis elegans, mice, rats, zebrafish, marmosets, rhesus macaque |
However, the breadth and range of chemicals that can be detected is limited by the availability of engineered indicators. Spectral overlap between indicators also enforces limitations on multiplexing. Microdialysis, on the other hand, can simultaneously detect many compounds with sensitive chemical analysis methods. Its capability and flexibility for temporal averaging can be useful for studies where monitoring short timescale dynamics is not desired, such as to measure slow volume transmission of neuropeptides or signal integration dynamics (Table 2).
Non-invasive or minimally invasive monitoring of neurochemical dynamics in freely-moving animal models or even humans is still challenging. Probe implantation, may it be carbon fiber microelectrodes, microdialysis probes, or fiber photometry probes, can result in initiation of inflammatory processes and tissue damage. We have discussed several methods by which these probes are being miniaturized and more biocompatible for chronic recording applications. All the methods mentioned have been extensively implemented in model animals, including non-human primates. Notably, the flexibility of FSCV for multimodal study and its relatively low invasiveness has lended to its ability to measure neurochemicals in the human brain (Bennet et al., 2016), which is likely not in the foreseeable future for fluorescence imaging. Acute microdialysis studies have also been performed in the human brain. Beyond the probe size itself, the chemical specificity of each method can also contribute to its invasive properties. Compared to GEIs which are designed to bind and recognize specific analytes, direct sampling with microdialysis or analyte adsorption to FSCV probes are not as specific. Non-specific depletion of solutes around the probe can result in repercussions given the tightly controlled chemical environment of the brain (Chefer et al., 2009). Depleting a target of interest at a single region from FSCV or microdialysis may have less of a disruption in endogenous processes compared to potentially widespread ligand buffering effects of many cells expressing genetically encoded indicators. This will continue to be an important consideration for sensor engineers moving forward.
Acknowledgements
We would like to thank our funding sources for supporting this work: NIH 5T32GM099608-10 (N.T.), NIA R01AG054649-05(Y.H.), (A.H, M.R.), NIH U01NS113295, R01HD091325, U01NS120820, R21EY031858 (L.T.).
References
- Abdelfattah AS, Kawashima T, Singh A, Novak O, Liu H, Shuai Y, Huang YC, Campagnola L, Seeman SC, Yu J, Zheng J, Grimm JB, Patel R, Friedrich J, Mensh BD, Paninski L, Macklin JJ, Murphy GJ, Podgorski K, Lin BJ, Chen TW, Turner GC, Liu Z, Koyama M, Svoboda K, Ahrens MB, Lavis LD, Schreiter ER, 2019. Bright and photostable chemigenetic indicators for extended in vivo voltage imaging. Science (80-. ). 365, 699–704. 10.1126/science.aav6416 [DOI] [PubMed] [Google Scholar]
- Al-Hasani R, Wong JMT, Mabrouk OS, McCall JG, Schmitz GP, Porter-Stransky KA, Aragona BJ, Kennedy RT, Bruchas MR, 2018. In vivo detection of optically-evoked opioid peptide release. Elife 7, 1–13. 10.7554/eLife.36520 [DOI] [PMC free article] [PubMed] [Google Scholar]
- Armbruster M, Dulla CG, Diamond JS, 2020. Effects of fluorescent glutamate indicators on neurotransmitter diffusion and uptake. Elife 9, 1–27. 10.7554/eLife.54441 [DOI] [PMC free article] [PubMed] [Google Scholar]
- Baird GS, Zacharias DA, Tsien RY, 1999. Circular permutation and receptor insertion within green fluorescent proteins. Proc. Natl. Acad. Sci. U. S. A 96, 11241–11246. 10.1073/pnas.96.20.11241 [DOI] [PMC free article] [PubMed] [Google Scholar]
- Ballini C, Della Corte L, Pazzagli M, Colivicchi MA, Pepeu G, Tipton KF, Giovannini MG, 2008. Extracellular levels of brain aspartate, glutamate and GABA during an inhibitory avoidance response in the rat. J. Neurochem 106, 1035–1043. 10.1111/j.1471-4159.2008.05452.x [DOI] [PubMed] [Google Scholar]
- Bang D, Kishida KT, Lohrenz T, White JP, Laxton AW, Tatter SB, Fleming SM, Montague PR, 2020. Sub-second Dopamine and Serotonin Signaling in Human Striatum during Perceptual Decision-Making. Neuron 108, 999–1010.e6. 10.1016/j.neuron.2020.09.015 [DOI] [PMC free article] [PubMed] [Google Scholar]
- Barnea G, Strapps W, Herrada G, Berman Y, Ong J, Kloss B, Axel R, Lee KJ, 2008. The genetic design of signaling cascades to record receptor activation. Proc. Natl. Acad. Sci. U. S. A 105, 64–69. 10.1073/pnas.0710487105 [DOI] [PMC free article] [PubMed] [Google Scholar]
- Bennet KE, Tomshine JR, Min HK, Manciu FS, Marsh MP, Paek SB, Settell ML, Nicolai EN, Blaha CD, Kouzani AZ, Chang SY, Lee KH, 2016. A diamond-based electrode for detection of neurochemicals in the human brain. Front. Hum. Neurosci 10, 1–12. 10.3389/fnhum.2016.00102 [DOI] [PMC free article] [PubMed] [Google Scholar]
- Bernstein AI, Stout KA, Miller GW, 2012. A fluorescent-based assay for live cell, spatially resolved assessment of vesicular monoamine transporter 2-mediated neurotransmitter transport. J. Neurosci. Methods 209, 357–366. 10.1016/j.jneumeth.2012.06.002 [DOI] [PMC free article] [PubMed] [Google Scholar]
- Beyene AG, Delevich K, Del Bonis-O’Donnell JT, Piekarski DJ, Lin WC, Wren Thomas A, Yang SJ, Kosillo P, Yang D, Prounis GS, Wilbrecht L, Landry MP, 2019. Imaging striatal dopamine release using a nongenetically encoded near infrared fluorescent catecholamine nanosensor. Sci. Adv 5, 1–12. 10.1126/sciadv.aaw3108 [DOI] [PMC free article] [PubMed] [Google Scholar]
- Bi X, Beck C, Gong Y, 2021. Genetically encoded fluorescent indicators for imaging brain chemistry. Biosensors 11. 10.3390/bios11040116 [DOI] [PMC free article] [PubMed] [Google Scholar]
- BITO L, Davson H, Levin E, Murray M, Snider N, 1966. the Concentrations of Free Amino Acids and Other Electrolytes in Cerebrospinal Fluid, in Vivo Dialysate of Brain, and Blood Plasma of the Dog. J. Neurochem 13, 1057–1067. 10.1111/j.1471-4159.1966.tb04265.x [DOI] [PubMed] [Google Scholar]
- Borden PM, Zhang P, Shivange AV, Marvin JS, Cichon J, Dan C, Podgorski K, Figueiredo A, Novak O, Tanimoto M, Shigetomi E, Lobas MA, Kim H, Zhu PK, Zhang Y, Zheng WS, Fan C, Wang G, Xiang B, Gan L, Zhang G-X, Guo K, Lin L, Cai Y, Yee AG, Aggarwal A, Ford CP, Rees DC, Dietrich D, Khakh BS, Dittman JS, Gan W-B, Koyama M, Jayaraman V, Cheer JF, Lester HA, Zhu JJ, Looger LL, 2020. A fast genetically encoded fluorescent sensor for faithful in vivo acetylcholine detection in mice, fish, worms and flies. Biorxiv 2020.02.07.939504. [Google Scholar]
- Bruno CA, O’Brien C, Bryant S, Mejaes JI, Estrin DJ, Pizzano C, Barker DJ, 2021. pMAT: An open-source software suite for the analysis of fiber photometry data. Pharmacol. Biochem. Behav 201, 173093. 10.1016/j.pbb.2020.173093 [DOI] [PMC free article] [PubMed] [Google Scholar]
- Bucher ES, Wightman RM, 2015. Electrochemical Analysis of Neurotransmitters. Annu. Rev. Anal. Chem 8, 239–261. 10.1146/annurev-anchem-071114-040426 [DOI] [PMC free article] [PubMed] [Google Scholar]
- Bungay PM, Morrison PF, Dedrick RL, 1990. Peter M. Bungay, Paul F. Morrison, Robert L. Dedrick Biomedical Engineering & Instrumentation Branch, Division of Research Services, National Institutes of Health, Bethesda, MD 20892 USA. Life Sci 46, 105–119.2299972 [Google Scholar]
- Calhoun SE, Meunier CJ, Lee CA, McCarty GS, Sombers LA, 2019. Characterization of a Multiple-Scan-Rate Voltammetric Waveform for Real-Time Detection of Met-Enkephalin. ACS Chem. Neurosci 10, 2022–2032. 10.1021/acschemneuro.8b00351 [DOI] [PMC free article] [PubMed] [Google Scholar]
- Cantu DA, Wang B, Gongwer MW, He CX, Goel A, Suresh A, Kourdougli N, Arroyo ED, Zeiger W, Portera-Cailliau C, 2020. EZcalcium: Open-Source Toolbox for Analysis of Calcium Imaging Data. Front. Neural Circuits 14, 1–9. 10.3389/fncir.2020.00025 [DOI] [PMC free article] [PubMed] [Google Scholar]
- Carandini M, Shimaoka D, Rossi LF, Sato TK, Benucci A, Knopfel X, 2015. Imaging the awake visual cortex with a genetically encoded voltage indicator. J. Neurosci 35, 53–63. 10.1523/JNEUROSCI.0594-14.2015 [DOI] [PMC free article] [PubMed] [Google Scholar]
- Chefer VI, Thompson AC, Zapata A, Shippenberg TS, 2009. Overview of brain microdialysis. Curr. Protoc. Neurosci 1–28. 10.1002/0471142301.ns0701s47 [DOI] [PMC free article] [PubMed] [Google Scholar]
- Chen NNH, Lai YJ, Pan WHT, 1997. Effects of different perfusion medium on the extracellular basal concentration of dopamine in striatum and medial prefrontal cortex: A zero-net flux microdialysis study. Neurosci. Lett 225, 197–200. 10.1016/S0304-3940(97)00222-X [DOI] [PubMed] [Google Scholar]
- Chen Q, Cichon J, Wang W, Qiu L, Lee SJR, Campbell NR, DeStefino N, Goard MJ, Fu Z, Yasuda R, Looger LL, Arenkiel BR, Gan WB, Feng G, 2012. Imaging Neural Activity Using Thy1-GCaMP Transgenic Mice. Neuron 76, 297–308. 10.1016/j.neuron.2012.07.011 [DOI] [PMC free article] [PubMed] [Google Scholar]
- Chen TW, Wardill TJ, Sun Y, Pulver SR, Renninger SL, Baohan A, Schreiter ER, Kerr RA, Orger MB, Jayaraman V, Looger LL, Svoboda K, Kim DS, 2013. Ultrasensitive fluorescent proteins for imaging neuronal activity. Nature 499, 295–300. 10.1038/nature12354 [DOI] [PMC free article] [PubMed] [Google Scholar]
- Cooper SE, Venton BJ, 2009. Fast-scan cyclic voltammetry for the detection of tyramine and octopamine. Anal. Bioanal. Chem 394, 329–336. 10.1007/s00216-009-2616-0 [DOI] [PubMed] [Google Scholar]
- Cryan MT, Ross AE, 2019. Subsecond detection of guanosine using fast-scan cyclic voltammetry. Analyst 144, 249–257. 10.1039/c8an01547c [DOI] [PubMed] [Google Scholar]
- Dana H, Sun Y, Mohar B, Hulse BK, Kerlin AM, Hasseman JP, Tsegaye G, Tsang A, Wong A, Patel R, Macklin JJ, Chen Y, Konnerth A, Jayaraman V, Looger LL, Schreiter ER, Svoboda K, Kim DS, 2019. High-performance calcium sensors for imaging activity in neuronal populations and microcompartments. Nat. Methods 16, 649–657. 10.1038/s41592-019-0435-6 [DOI] [PubMed] [Google Scholar]
- Deo C, Abdelfattah AS, Bhargava HK, Berro AJ, Falco N, Farrants H, Moeyaert B, Chupanova M, Lavis LD, Schreiter ER, 2021. The HaloTag as a general scaffold for far-red tunable chemigenetic indicators. Nat. Chem. Biol 17, 718–723. 10.1038/s41589-021-00775-w [DOI] [PubMed] [Google Scholar]
- Deuschle K, Okumoto S, Fehr M, Looger LL, Kozhukh L, Frommer WB, 2005. Construction and optimization of a family of genetically encoded metabolite sensors by semirational protein engineering. Protein Sci 14, 2304–2314. 10.1110/ps.051508105 [DOI] [PMC free article] [PubMed] [Google Scholar]
- Dong C, Ly C, Dunlap LE, Vargas MV, Sun J, Hwang I-W, Azinfar A, Oh WC, Wetsel WC, Olson DE, Tian L, 2021. Psychedelic-inspired drug discovery using an engineered biosensor. Cell 1–14. 10.1016/j.cell.2021.03.043 [DOI] [PMC free article] [PubMed] [Google Scholar]
- Dunn M, Henke A, Clark S, Kovalyova Y, Kempadoo KA, Karpowicz RJ, Kandel ER, Sulzer D, Sames D, 2018. Designing a norepinephrine optical tracer for imaging individual noradrenergic synapses and their activity in vivo. Nat. Commun 9, 1–13. 10.1038/s41467-018-05075-x [DOI] [PMC free article] [PubMed] [Google Scholar]
- Dürst CD, Wiegert JS, Helassa N, Kerruth S, Coates C, Schulze C, Geeves MA, Török K, Oertner TG, 2019. High-speed imaging of glutamate release with genetically encoded sensors. Nat. Protoc 14, 1401–1424. 10.1038/s41596-019-0143-9 [DOI] [PMC free article] [PubMed] [Google Scholar]
- Ellington AD, Szostak JW, 1990. In vitro selection of RNA molecules that bind specific ligands. Nature 346, 818–822. 10.1038/346818a0 [DOI] [PubMed] [Google Scholar]
- Farsi Z, Walde M, Klementowicz AE, Paraskevopoulou F, Woehler A, 2021. Single synapse glutamate imaging reveals multiple levels of release mode regulation in mammalian synapses. iScience 24, 101909. 10.1016/j.isci.2020.101909 [DOI] [PMC free article] [PubMed] [Google Scholar]
- Feng J, Zhang C, Lischinsky JE, Jing M, Zhou J, Wang H, Zhang Y, Dong A, Wu Z, Wu H, Chen W, Zhang P, Zou J, Hires SA, Zhu JJ, Cui G, Lin D, Du J, Li Y, 2019. A Genetically Encoded Fluorescent Sensor for Rapid and Specific In Vivo Detection of Norepinephrine. Neuron 102, 745–761.e8. 10.1016/j.neuron.2019.02.037 [DOI] [PMC free article] [PubMed] [Google Scholar]
- Feng L, Zhao T, Kim J, 2012. Improved synapse detection for mGRASP-assisted brain connectivity mapping. Bioinformatics 28, 25–31. 10.1093/bioinformatics/bts221 [DOI] [PMC free article] [PubMed] [Google Scholar]
- Feng T, Ji W, Tang Q, Wei H, Zhang S, Mao J, Zhang Y, Mao L, Zhang M, 2019. Low-fouling nanoporous conductive polymer-coated microelectrode for in vivo monitoring of dopamine in the rat brain. Anal. Chem 91, 10786–10791. 10.1021/acs.analchem.9b02386 [DOI] [PubMed] [Google Scholar]
- Finnema SJ, Scheinin M, Shahid M, Lehto J, Borroni E, Bang-Andersen B, Sallinen J, Wong E, Farde L, Halldin C, Grimwood S, 2015. Application of cross-species PET imaging to assess neurotransmitter release in brain. Psychopharmacology (Berl) 232, 4129–4157. 10.1007/s00213-015-3938-6 [DOI] [PMC free article] [PubMed] [Google Scholar]
- Fletcher HJ, Stenken JA, 2008. An in vitro comparison of microdialysis relative recovery of Met- and Leuenkephalin using cyclodextrins and antibodies as affinity agents. Anal. Chim. Acta 620, 170–175. 10.1016/j.aca.2008.05.028 [DOI] [PMC free article] [PubMed] [Google Scholar]
- Forderhase AG, Styers HC, Lee CA, Sombers LA, 2020. Simultaneous voltammetric detection of glucose and lactate fluctuations in rat striatum evoked by electrical stimulation of the midbrain. Anal. Bioanal. Chem 6611–6624. 10.1007/s00216-020-02797-0 [DOI] [PMC free article] [PubMed] [Google Scholar]
- Gasterstädt I, Jack A, Stahlhut T, Rennau LM, Gonda S, Wahle P, 2020. Genetically Encoded Calcium Indicators Can Impair Dendrite Growth of Cortical Neurons. Front. Cell. Neurosci 14, 1–18. 10.3389/fncel.2020.570596 [DOI] [PMC free article] [PubMed] [Google Scholar]
- Giovannucci A, Friedrich J, Gunn P, Kalfon J, Brown BL, Koay SA, Taxidis J, Najafi F, Gauthier JL, Zhou P, Khakh BS, Tank DW, Chklovskii DB, Pnevmatikakis EA, 2019. CaImAn an open source tool for scalable calcium imaging data analysis. Elife 8, 1–45. 10.7554/eLife.38173 [DOI] [PMC free article] [PubMed] [Google Scholar]
- Gold L, Polisky B, Uhlenbeck O, Yarus M, 1995. Diversity of Oligonucleotide Functions. Annu. Rev. Biochem 64, 763–797. 10.1146/annurev.bi.64.070195.003555 [DOI] [PubMed] [Google Scholar]
- Gottschalk S, Degtyaruk O, Mc Larney B, Rebling J, Hutter MA, Deán-Ben XL, Shoham S, Razansky D, 2019. Rapid volumetric optoacoustic imaging of neural dynamics across the mouse brain. Nat. Biomed. Eng 3, 392–401. 10.1038/s41551-019-0372-9 [DOI] [PMC free article] [PubMed] [Google Scholar]
- Gubernator NG, Zhang H, Staal RGW, Mosharov EV, Pereira DB, Yue M, Balsanek V, Vadola PA, Mukherjee B, Edwards RH, Sulzer D, Sames D, 2009. Fluorescent False Neurotransmitters Visualize Dopamine Release from Individual Presynaptic Terminals. Science (80-. ). 324, 1441–1444. 10.1126/science.1172278 [DOI] [PMC free article] [PubMed] [Google Scholar]
- Hashemi P, Dankoski EC, Petrovic J, Keithley RB, Wightman RM, 2009. Voltammetric detection of 5-hydroxytryptamine release in the rat brain. Anal. Chem 81, 9462–9471. 10.1021/ac9018846 [DOI] [PMC free article] [PubMed] [Google Scholar]
- Hefendehl JK, LeDue J, Ko RWY, Mahler J, Murphy TH, MacVicar BA, 2016. Mapping synaptic glutamate transporter dysfunction in vivo to regions surrounding Aβ plaques by iGluSnFR two-photon imaging. Nat. Commun 7. 10.1038/ncomms13441 [DOI] [PMC free article] [PubMed] [Google Scholar]
- Heien MLAV, Johnson MA, Wightman RM, 2004. Resolving neurotransmitters detected by fast-scan cyclic voltammetry. Anal. Chem 76, 5697–5704. 10.1021/ac0491509 [DOI] [PubMed] [Google Scholar]
- Heien MLAV, Khan AS, Ariansen JL, Cheer JF, Phillips PEM, Wassum KM, Wightman RM, 2005. Real-time measurement of dopamine fluctuations after cocaine in the brain of behaving rats. Proc. Natl. Acad. Sci. U. S. A 102, 10023–10028. 10.1073/pnas.0504657102 [DOI] [PMC free article] [PubMed] [Google Scholar]
- Heien MLAV, Phillips PEM, Stuber GD, Seipel AT, Wightman RM, 2003. Overoxidation of carbon-fiber microelectrodes enhances dopamine adsorption and increases sensitivity. Analyst 128, 1413–1419. 10.1039/b307024g [DOI] [PubMed] [Google Scholar]
- Helassa N, Dürst CD, Coates C, Kerruth S, Arif U, Schulze C, Simon Wiegert J, Geeves M, Oertner TG, Török K, 2018. Ultrafast glutamate sensors resolve high-frequency release at Schaffer collateral synapses. Proc. Natl. Acad. Sci. U. S. A 115, 5594–5599. 10.1073/pnas.1720648115 [DOI] [PMC free article] [PubMed] [Google Scholar]
- Henke A, Kovalyova Y, Dunn M, Dreier D, Gubernator NG, Dincheva I, Hwu C, Šebej P, Ansorge MS, Sulzer D, Sames D, 2018. Toward Serotonin Fluorescent False Neurotransmitters: Development of Fluorescent Dual Serotonin and Vesicular Monoamine Transporter Substrates for Visualizing Serotonin Neurons. ACS Chem. Neurosci 9, 925–934. 10.1021/acschemneuro.7b00320 [DOI] [PMC free article] [PubMed] [Google Scholar]
- Hersey M, Samaranayake S, Berger SN, Tavakoli N, Mena S, Nijhout HF, Reed MC, Best J, Blakely RD, Reagan LP, Hashemi P, 2021. Inflammation-Induced Histamine Impairs the Capacity of Escitalopram to Increase Hippocampal Extracellular Serotonin. J. Neurosci 41, JN-RM-2618–20. 10.1523/jneurosci.2618-20.2021 [DOI] [PMC free article] [PubMed] [Google Scholar]
- Hires SA, Zhu Y, Tsien RY, 2008a. Optical measurement of synaptic glutamate spillover and reuptake by linker optimized glutamate-sensitive fluorescent reporters. Proc. Natl. Acad. Sci. U. S. A 105, 4411–4416. 10.1073/pnas.0712008105 [DOI] [PMC free article] [PubMed] [Google Scholar]
- Hires SA, Zhu Y, Tsien RY, 2008b. Optical measurement of synaptic glutamate spillover and reuptake by linker optimized glutamate-sensitive fluorescent reporters. Proc. Natl. Acad. Sci. U. S. A 105, 4411–4416. 10.1073/pnas.0712008105 [DOI] [PMC free article] [PubMed] [Google Scholar]
- Hobbs CN, Johnson JA, Verber MD, Mark Wightman R, 2017. An implantable multimodal sensor for oxygen, neurotransmitters, and electrophysiology during spreading depolarization in the deep brain. Analyst 142, 2912–2920. 10.1039/c7an00508c [DOI] [PMC free article] [PubMed] [Google Scholar]
- Höcht C, Opezzo JAW, Taira CA, 2007. Applicability of reverse microdialysis in pharmacological and toxicological studies. J. Pharmacol. Toxicol. Methods 55, 3–15. 10.1016/j.vascn.2006.02.007 [DOI] [PubMed] [Google Scholar]
- Hoffmann C, Gaietta G, Bünemann M, Adams SR, Oberdorff-Maass S, Behr B, Vilardaga JP, Tsien RY, Ellisman MH, Lohse MJ, 2005. A FlAsH-based FRET approach to determine G protein-coupled receptor activation in living cells. Nat. Methods 2, 171–176. 10.1038/nmeth742 [DOI] [PubMed] [Google Scholar]
- Jaquins-Gerstl A, Michael AC, 2009. Comparison of the brain penetration injury associated with microdialysis and voltammetry. J. Neurosci. Methods 183, 127–135. 10.1016/j.jneumeth.2009.06.023 [DOI] [PMC free article] [PubMed] [Google Scholar]
- Jensen JB, Lyssand JS, Hague C, Hille B, 2009. Fluorescence changes reveal kinetic steps of muscarinic receptor-mediated modulation of phosphoinositides and Kv7.2/7.3 K + channels. J. Gen. Physiol 133, 347–359. 10.1085/jgp.200810075 [DOI] [PMC free article] [PubMed] [Google Scholar]
- Jeong S, Yang D, Beyene AG, Del Bonis-O’Donnell JT, Gest AMM, Navarro N, Sun X, Landry MP, 2019. High-throughput evolution of near-infrared serotonin nanosensors. Sci. Adv 5, 1–13. 10.1126/sciadv.aay3771 [DOI] [PMC free article] [PubMed] [Google Scholar]
- Jin G, Cheng Q, Feng J, Li F, 2008. On-line microdialysis coupled to analytical systems. J. Chromatogr. Sci 46, 276–287. 10.1093/chromsci/46.3.276 [DOI] [PubMed] [Google Scholar]
- Jing M, Li Yuexuan, Zeng J, Huang P, Skirzewski M, Kljakic O, Peng W, Qian T, Tan K, Zou J, Trinh S, Wu R, Zhang S, Pan S, Hires SA, Xu M, Li H, Saksida LM, Prado VF, Bussey TJ, Prado MAM, Chen L, Cheng H, Li Yulong, 2020. An optimized acetylcholine sensor for monitoring in vivo cholinergic activity. Nat. Methods 17, 1139–1146. 10.1038/s41592-020-0953-2 [DOI] [PMC free article] [PubMed] [Google Scholar]
- Jing M, Zhang P, Wang G, Feng J, Mesik L, Zeng J, Jiang H, Wang S, Looby JC, Guagliardo NA, Langma LW, Lu J, Zuo Y, Talmage DA, Role LW, Barrett PQ, Zhang LI, Luo M, Song Y, Zhu JJ, Li Y, 2018. A genetically encoded fluorescent acetylcholine indicator for in vitro and in vivo studies. Nat. Biotechnol 36. 10.1038/nbt.4184 [DOI] [PMC free article] [PubMed] [Google Scholar]
- Kennedy RT, 2013. Emerging trends in in vivo neurochemical monitoring by microdialysis. Curr. Opin. Chem. Biol 17, 860–867. 10.1016/j.cbpa.2013.06.012 [DOI] [PMC free article] [PubMed] [Google Scholar]
- Kishida KT, Saez I, Lohrenz T, Witcher MR, Laxton AW, Tatter SB, White JP, Ellis TL, Phillips PEM, Montague PR, 2016. Subsecond dopamine fluctuations in human striatum encode superposed error signals about actual and counterfactual reward. Proc. Natl. Acad. Sci. U. S. A 113, 200–205. 10.1073/pnas.1513619112 [DOI] [PMC free article] [PubMed] [Google Scholar]
- Kovács GL, 2004. The Endocrine Brain: Pathophysiological Role of Neuropeptide-Neurotransmitter Interactions. EJIFCC 15, 107–112. [PMC free article] [PubMed] [Google Scholar]
- Kozai TDY, Jaquins-Gerstl AS, Vazquez AL, Michael AC, Cui XT, 2015. Brain tissue responses to neural implants impact signal sensitivity and intervention strategies. ACS Chem. Neurosci 6, 48–67. 10.1021/cn500256e [DOI] [PMC free article] [PubMed] [Google Scholar]
- Kozlowski C, Weimer RM, 2012. An Automated Method to Quantify Microglia Morphology and Application to Monitor Activation State Longitudinally In Vivo. PLoS One 7, e31814. 10.1371/journal.pone.0031814 [DOI] [PMC free article] [PubMed] [Google Scholar]
- Kulikov V, Guo SM, Stone M, Goodman A, Carpenter A, Bathe M, Lempitsky V, 2019. DoGNet: A deep architecture for synapse detection in multiplexed fluorescence images. PLoS Comput. Biol 15, 1–20. 10.1371/journal.pcbi.1007012 [DOI] [PMC free article] [PubMed] [Google Scholar]
- Latorraca NR, Venkatakrishnan AJ, Dror RO, 2017. GPCR dynamics: Structures in motion. Chem. Rev 117, 139–155. 10.1021/acs.chemrev.6b00177 [DOI] [PubMed] [Google Scholar]
- Lee WH, Ngernsutivorakul T, Mabrouk OS, Wong JMT, Dugan CE, Pappas SS, Yoon HJ, Kennedy RT, 2016. Microfabrication and in Vivo Performance of a Microdialysis Probe with Embedded Membrane. Anal. Chem 88, 1230–1237. 10.1021/acs.analchem.5b03541 [DOI] [PMC free article] [PubMed] [Google Scholar]
- Leopold AV, Shcherbakova DM, Verkhusha VV, 2019. Fluorescent Biosensors for Neurotransmission and Neuromodulation: Engineering and Applications. Front. Cell. Neurosci 13. 10.3389/fncel.2019.00474 [DOI] [PMC free article] [PubMed] [Google Scholar]
- Li N, Jasanoff A, 2020. Local and global consequences of reward-evoked striatal dopamine release. Nature 580, 239–244. 10.1038/s41586-020-2158-3 [DOI] [PMC free article] [PubMed] [Google Scholar]
- Liu X, Xiao T, Wu F, Shen MY, Zhang M, Yu HH, Mao L, 2017. Ultrathin Cell-Membrane-Mimic Phosphorylcholine Polymer Film Coating Enables Large Improvements for In Vivo Electrochemical Detection. Angew. Chemie - Int. Ed 56, 11802–11806. 10.1002/anie.201705900 [DOI] [PubMed] [Google Scholar]
- Lobas MA, Tao R, Nagai J, Kronschläger MT, Borden PM, Marvin JS, Looger LL, Khakh BS, 2019. A genetically encoded single-wavelength sensor for imaging cytosolic and cell surface ATP. Nat. Commun 10. 10.1038/s41467-019-08441-5 [DOI] [PMC free article] [PubMed] [Google Scholar]
- Ludvig N, Potter PE, Fox SE, 1994. Simultaneous single-cell recording and microdialysis within the same brain site in freely behaving rats: a novel neurobiological method. J. Neurosci. Methods 55, 31–40. 10.1016/0165-0270(94)90037-X [DOI] [PubMed] [Google Scholar]
- Lugo-Morales LZ, Loziuk PL, Corder AK, Toups JV, Roberts JG, McCaffrey KA, Sombers LA, 2013. Enzyme-modified carbon-fiber microelectrode for the quantification of dynamic fluctuations of nonelectroactive analytes using fast-scan cyclic voltammetry. Anal. Chem 85, 8780–8786. 10.1021/ac4017852 [DOI] [PMC free article] [PubMed] [Google Scholar]
- Maes K, Van Liefferinge J, Viaene J, Van Schoors J, Van Wanseele Y, Béchade G, Chambers EE, Morren H, Michotte Y, Vander Heyden Y, Claereboudt J, Smolders I, Van Eeckhaut A, 2014. Improved sensitivity of the nano ultra-high performance liquid chromatography-tandem mass spectrometric analysis of low-concentrated neuropeptides by reducing aspecific adsorption and optimizing the injection solvent. J. Chromatogr. A 1360, 217–228. 10.1016/j.chroma.2014.07.086 [DOI] [PubMed] [Google Scholar]
- Maier-Peuschel M, Frölich N, Dees C, Hommers LG, Hoffmann C, Nikolaev VO, Lohse MJ, 2010. A fluorescence resonance energy transfer-based M2 muscarinic receptor sensor reveals rapid kinetics of allosteric modulation. J. Biol. Chem 285, 8793–8800. 10.1074/jbc.M109.098517 [DOI] [PMC free article] [PubMed] [Google Scholar]
- Mansfield JR, Gossage KW, Hoyt CC, Levenson RM, 2005. Autofluorescence removal, multiplexing, and automated analysis methods for in-vivo fluorescence imaging. J. Biomed. Opt 10, 041207. 10.1117/1.2032458 [DOI] [PubMed] [Google Scholar]
- Marvin JS, Borghuis BG, Tian L, Cichon J, Harnett MT, Akerboom J, Gordus A, Renninger SL, Chen TW, Bargmann CI, Orger MB, Schreiter ER, Demb JB, Gan WB, Hires SA, Looger LL, 2013. An optimized fluorescent probe for visualizing glutamate neurotransmission. Nat. Methods 10, 162–170. 10.1038/nmeth.2333 [DOI] [PMC free article] [PubMed] [Google Scholar]
- Marvin JS, Scholl B, Wilson DE, Podgorski K, Kazemipour A, Müller JA, Schoch S, Quiroz FJU, Rebola N, Bao H, Little JP, Tkachuk AN, Cai E, Hantman AW, Wang SSH, DePiero VJ, Borghuis BG, Chapman ER, Dietrich D, DiGregorio DA, Fitzpatrick D, Looger LL, 2018. Stability, affinity, and chromatic variants of the glutamate sensor iGluSnFR. Nat. Methods 15, 936–939. 10.1038/s41592-018-0171-3 [DOI] [PMC free article] [PubMed] [Google Scholar]
- Marvin JS, Shimoda Y, Magloire V, Leite M, Kawashima T, Jensen TP, Kolb I, Knott EL, Novak O, Podgorski K, Leidenheimer NJ, Rusakov DA, Ahrens MB, Kullmann DM, Looger LL, 2019. A genetically encoded fluorescent sensor for in vivo imaging of GABA. Nat. Methods 16, 763–770. 10.1038/s41592-019-0471-2 [DOI] [PubMed] [Google Scholar]
- McGirr A, Ledue J, Chan AW, Xie Y, Murphy TH, 2017. Cortical functional hyperconnectivity in a mouse model of depression and selective network effects of ketamine. Brain 140, 2210–2225. 10.1093/brain/awx142 [DOI] [PubMed] [Google Scholar]
- McMahon SM, Jackson MB, 2018. An Inconvenient Truth: Calcium Sensors Are Calcium Buffers. Trends Neurosci 41, 880–884. 10.1016/j.tins.2018.09.005 [DOI] [PMC free article] [PubMed] [Google Scholar]
- Mendoza A, Asrat T, Liu F, Wonnenberg P, Zestos AG, 2020. Carbon nanotube yarn microelectrodes promote high temporal measurements of serotonin using fast scan cyclic voltammetry. Sensors (Switzerland) 20. 10.3390/s20041173 [DOI] [PMC free article] [PubMed] [Google Scholar]
- Millar J, Stamford JA, Kruk ZL, Wightman RM, 1985. Electrochemical, pharmacological and electrophysiological evidence of rapid dopamine release and removal in the rat caudate nucleus following electrical stimulation of the median forebrain bundle. Eur. J. Pharmacol 109, 341–348. 10.1016/0014-2999(85)90394-2 [DOI] [PubMed] [Google Scholar]
- Miyawaki A, Llopis J, Heim R, Michael McCaffery J, Adams JA, Ikura M, Tsien RY, 1997. Fluorescent indicators for Ca2+ based on green fluorescent proteins and calmodulin. Nature 388, 882–887. 10.1038/42264 [DOI] [PubMed] [Google Scholar]
- Moran RJ, Kishida KT, Lohrenz T, Saez I, Laxton AW, Witcher MR, Tatter SB, Ellis TL, Phillips PE, Dayan P, Montague PR, 2018. The Protective Action Encoding of Serotonin Transients in the Human Brain. Neuropsychopharmacology 43, 1425–1435. 10.1038/npp.2017.304 [DOI] [PMC free article] [PubMed] [Google Scholar]
- Muller A, Joseph V, Slesinger PA, Kleinfeld D, 2014. Cell-based reporters reveal in vivo dynamics of dopamine and norepinephrine release in murine cortex. Nat. Methods 11, 1245–1252. 10.1038/nmeth.3151 [DOI] [PMC free article] [PubMed] [Google Scholar]
- Nakai J, Ohkura M, Imoto K, 2001. A high signal-to-noise ca2+ probe composed of a single green fluorescent protein. Nat. Biotechnol 19, 137–141. 10.1038/84397 [DOI] [PubMed] [Google Scholar]
- Nakatsuka N, Yang KA, Abendroth JM, Cheung KM, Xu X, Yang H, Zhao C, Zhu B, Rim YS, Yang Y, Weiss PS, Stojanović MN, Andrews AM, 2018. Aptamer-field-effect transistors overcome Debye length limitations for small-molecule sensing. Science (80-. ). 362, 319–324. 10.1126/science.aao675 [DOI] [PMC free article] [PubMed] [Google Scholar]
- Nandi P, Lunte SM, 2009. Recent trends in microdialysis sampling integrated with conventional and microanalytical systems for monitoring biological events: A review. Anal. Chim. Acta 651, 1–14. 10.1016/j.aca.2009.07.064 [DOI] [PMC free article] [PubMed] [Google Scholar]
- Ngernsutivorakul T, Steyer DJ, Valenta AC, Kennedy RT, 2018a. In Vivo Chemical Monitoring at High Spatiotemporal Resolution Using Microfabricated Sampling Probes and Droplet-Based Microfluidics Coupled to Mass Spectrometry. Anal. Chem 90, 10943–10950. 10.1021/acs.analchem.8b02468 [DOI] [PMC free article] [PubMed] [Google Scholar]
- Ngernsutivorakul T, White TS, Kennedy RT, 2018b. Microfabricated Probes for Studying Brain Chemistry: A Review. ChemPhysChem 19, 1128–1142. 10.1002/cphc.201701180 [DOI] [PMC free article] [PubMed] [Google Scholar]
- Ngo KT, Varner EL, Michael AC, Weber SG, 2017. Monitoring Dopamine Responses to Potassium Ion and Nomifensine by in Vivo Microdialysis with Online Liquid Chromatography at One-Minute Resolution. ACS Chem. Neurosci 8, 329–338. 10.1021/acschemneuro.6b00383 [DOI] [PMC free article] [PubMed] [Google Scholar]
- O’Connell MJ, Bachilo SH, Huffman CB, Moore VC, Strano MS, Haroz EH, Rialon KL, Boul PJ, Noon WH, Kittrell C, Ma J, Hauge RH, Weisman RB, Smalley RE, 2002. Band gap fluorescence from individual single-walled carbon nanotubes. Science (80-. ). 297, 593–596. 10.1101/2020.04.08.032870 [DOI] [PubMed] [Google Scholar]
- Obrenovitch TP, Richards DA, Sarna GS, Symon L, 1993. Combined intracerebral microdialysis and electrophysiological recording: methodology and applications. J. Neurosci. Methods 47, 139–145. 10.1016/0165-0270(93)90030-U [DOI] [PubMed] [Google Scholar]
- Okumoto S, Looger LL, Micheva KD, Reimer RJ, Smith SJ, Frommer WB, 2005. Detection of glutamate release from neurons by genetically encoded surface-displayed FRET nanosensors. Proc. Natl. Acad. Sci. U. S. A 102, 8740–8745. 10.1073/pnas.0503274102 [DOI] [PMC free article] [PubMed] [Google Scholar]
- Owesson-White C, Belle AM, Herr NR, Peele JL, Gowrishankar P, Carelli RM, Mark Wightman R, 2016. Cue-evoked dopamine release rapidly modulates D2 neurons in the nucleus accumbens during motivated behavior. J. Neurosci 36, 6011–6021. 10.1523/JNEUROSCI.0393-16.2016 [DOI] [PMC free article] [PubMed] [Google Scholar]
- Pál B, 2018. Involvement of extrasynaptic glutamate in physiological and pathophysiological changes of neuronal excitability, Cellular and Molecular Life Sciences Springer International Publishing. 10.1007/s00018-018-2837-5 [DOI] [PMC free article] [PubMed] [Google Scholar]
- Park C, Oh Y, Shin H, Kim J, Kang Y, Sim J, Cho HU, Lee HK, Jung SJ, Blaha CD, Bennet KE, Heien ML, Lee KH, Kim IY, Jang DP, 2018. Fast Cyclic Square-Wave Voltammetry to Enhance Neurotransmitter Selectivity and Sensitivity. Anal. Chem 90, 13348–13355. 10.1021/acs.analchem.8b02920 [DOI] [PubMed] [Google Scholar]
- Patriarchi T, Cho JR, Merten K, Howe MW, Marley A, Xiong WH, Folk RW, Broussard GJ, Liang R, Jang MJ, Zhong H, Dombeck D, von Zastrow M, Nimmerjahn A, Gradinaru V, Williams JT, Tian L, 2018. Ultrafast neuronal imaging of dopamine dynamics with designed genetically encoded sensors. Science (80-. ). 360. 10.1126/science.aat4422 [DOI] [PMC free article] [PubMed] [Google Scholar]
- Patriarchi T, Mohebi A, Sun J, Marley A, Liang R, Dong C, Puhger K, Mizuno GO, Davis CM, Wiltgen B, von Zastrow M, Berke JD, Tian L, 2020. An expanded palette of dopamine sensors for multiplex imaging in vivo. Nat. Methods 17, 1147–1155. 10.1038/s41592-020-0936-3 [DOI] [PMC free article] [PubMed] [Google Scholar]
- Pereira DB, Schmitz Y, Mészros J, Merchant P, Hu G, Li S, Henke A, Lizardi-Ortiz JE, Karpowicz RJ, Morgenstern TJ, Sonders MS, Kanter E, Rodriguez PC, Mosharov EV, Sames D, Sulzer D, 2016. Fluorescent false neurotransmitter reveals functionally silent dopamine vesicle clusters in the striatum. Nat. Neurosci 19, 578–586. 10.1038/nn.4252 [DOI] [PMC free article] [PubMed] [Google Scholar]
- Piatkevich KD, Bensussen S, an Tseng H, Shroff SN, Lopez-Huerta VG, Park D, Jung EE, Shemesh OA, Straub C, Gritton HJ, Romano MF, Costa E, Sabatini BL, Fu Z, Boyden ES, Han X, 2019. Population imaging of neural activity in awake behaving mice. Nature 574, 413–417. 10.1038/s41586-019-1641-1 [DOI] [PMC free article] [PubMed] [Google Scholar]
- Plock N, Kloft C, 2005. Microdialysis - Theoretical background and recent implementation in applied life-sciences. Eur. J. Pharm. Sci 25, 1–24. 10.1016/j.ejps.2005.01.017 [DOI] [PubMed] [Google Scholar]
- Post MR, Sulzer D, 2021. The chemical tools for imaging dopamine release. Cell Chem. Biol 28, 748–764. 10.1016/j.chembiol.2021.04.005 [DOI] [PMC free article] [PubMed] [Google Scholar]
- Puthongkham P, Lee ST, Jill Venton B, 2019. Mechanism of histamine oxidation and electropolymerization at carbon electrodes. Anal. Chem 91. 10.1021/acs.analchem.9b01178 [DOI] [PMC free article] [PubMed] [Google Scholar]
- Puthongkham P, Venton BJ, 2020. Recent advances in fast-scan cyclic voltammetry. Analyst 145, 1087–1102. 10.1039/c9an01925a [DOI] [PMC free article] [PubMed] [Google Scholar]
- Quiroz C, Orrú M, Rea W, Ciudad-Roberts A, Yepes G, Britt JP, Ferré S, 2016. Local control of extracellular dopamine levels in the medial nucleus accumbens by a glutamatergic projection from the infralimbic cortex. J. Neurosci 36, 851–859. 10.1523/JNEUROSCI.2850-15.2016 [DOI] [PMC free article] [PubMed] [Google Scholar]
- Rafi H, Zestos AG, 2021a. Multiplexing neurochemical detection with carbon fiber multielectrode arrays using fast-scan cyclic voltammetry. Anal. Bioanal. Chem 10.1007/s00216-021-03526-x [DOI] [PMC free article] [PubMed] [Google Scholar]
- Rafi H, Zestos AG, 2021b. Review—Recent Advances in FSCV Detection of Neurochemicals via Waveform and Carbon Microelectrode Modification. J. Electrochem. Soc 168, 057520. 10.1149/1945-7111/ac0064 [DOI] [PMC free article] [PubMed] [Google Scholar]
- Raman R, Rousseau EB, Wade M, Tong A, Cotler MJ, Kuang J, Lugo AA, Zhang E, Graybiel AM, White FM, Langer R, Cima MJ, 2020. Platform for micro-invasive membrane-free biochemical sampling of brain interstitial fluid. Sci. Adv 6, 1–12. 10.1126/sciadv.abb0657 [DOI] [PMC free article] [PubMed] [Google Scholar]
- Reinhoud NJ, Brouwer HJ, Van Heerwaarden LM, Korte-Bouws GAH, 2013. Analysis of glutamate, GABA, noradrenaline, dopamine, serotonin, and metabolites using microbore UHPLC with electrochemical detection. ACS Chem. Neurosci 4, 888–894. 10.1021/cn400044s [DOI] [PMC free article] [PubMed] [Google Scholar]
- Rodeberg NT, Sandberg SG, Johnson JA, Phillips PEM, Wightman RM, 2017. Hitchhiker’s Guide to Voltammetry: Acute and Chronic Electrodes for in Vivo Fast-Scan Cyclic Voltammetry. ACS Chem. Neurosci 8, 221–234. 10.1021/acschemneuro.6b00393 [DOI] [PMC free article] [PubMed] [Google Scholar]
- Rodriguez PC, Pereira DB, Borgkvist A, Wong MY, Barnard C, Sonders MS, Zhang H, Sames D, Sulzer D, 2013. Fluorescent dopamine tracer resolves individual dopaminergic synapses and their activity in the brain. Proc. Natl. Acad. Sci. U. S. A 110, 870–875. 10.1073/pnas.1213569110 [DOI] [PMC free article] [PubMed] [Google Scholar]
- Ross AE, Venton BJ, 2014. Sawhorse waveform voltammetry for selective detection of adenosine, ATP, and hydrogen peroxide. Anal. Chem 86, 7486–7493. 10.1021/ac501229c [DOI] [PMC free article] [PubMed] [Google Scholar]
- Sabatini BL, Tian L, 2020. Imaging Neurotransmitter and Neuromodulator Dynamics In Vivo with Genetically Encoded Indicators. Neuron 108, 17–32. 10.1016/j.neuron.2020.09.036 [DOI] [PubMed] [Google Scholar]
- Samaranayake S, Abdalla A, Robke R, Wood KM, Zeqja A, Hashemi P, 2015. In vivo histamine voltammetry in the mouse premammillary nucleus. Analyst 140, 3759–3765. 10.1039/c5an00313j [DOI] [PMC free article] [PubMed] [Google Scholar]
- Sarter M, Bruno JP, Parikh V, 2007. Abnormal neurotransmitter release underlying behavioral and cognitive disorders: Toward concepts of dynamic and function-specific dysregulation. Neuropsychopharmacology 32, 1452–1461. 10.1038/sj.npp.1301285 [DOI] [PubMed] [Google Scholar]
- Schmerberg CM, Li L, 2013. Mass spectrometric detection of neuropeptides using affinity-enhanced microdialysis with antibody-coated magnetic nanoparticles. Anal. Chem 85, 915–922. 10.1021/ac302403e [DOI] [PMC free article] [PubMed] [Google Scholar]
- Schultz KN, Kennedy RT, 2008. Time-resolved microdialysis for in vivo neurochemical measurements and other applications. Annu. Rev. Anal. Chem 1, 627–661. 10.1146/annurev.anchem.1.031207.113047 [DOI] [PubMed] [Google Scholar]
- Seaton BT, Hill DF, Cowen SL, Heien ML, 2020. Mitigating the Effects of Electrode Biofouling-Induced Impedance for Improved Long-Term Electrochemical Measurements in Vivo. Anal. Chem 92, 6334–6340. 10.1021/acs.analchem.9b05194 [DOI] [PMC free article] [PubMed] [Google Scholar]
- Shimojo M, Ono M, Takuwa H, Mimura K, Nagai Y, Fujinaga M, Kikuchi T, Okada M, Seki C, Tokunaga M, Maeda J, Takado Y, Takahashi M, Minamihisamatsu T, Ming-Rong Z, Yomita Y, Suzuki N, Maximov A, Suhara T, Minamimoto T, Sahara N, Higuchi M, 2020. Genetically targeted reporter imaging of deep neuronal network in the mammalian brain. bioRxiv. 10.1101/2020.04.08.032870 [DOI] [PMC free article] [PubMed] [Google Scholar]
- Shivange AV, Borden PM, Muthusamy AK, Nichols AL, Bera K, Bao H, Bishara I, Jeon J, Mulcahy MJ, Cohen B, O’Riordan SL, Kim C, Dougherty DA, Chapman ER, Marvin JS, Looger LL, Lester HA, 2019. Determining the pharmacokinetics of nicotinic drugs in the endoplasmic reticulum using biosensors. J. Gen. Physiol 151, 738–757. 10.1085/jgp.201812201 [DOI] [PMC free article] [PubMed] [Google Scholar]
- Smith SK, Lee CA, Dausch ME, Horman BM, Patisaul HB, McCarty GS, Sombers LA, 2017. Simultaneous Voltammetric Measurements of Glucose and Dopamine Demonstrate the Coupling of Glucose Availability with Increased Metabolic Demand in the Rat Striatum. ACS Chem. Neurosci 8, 272–280. 10.1021/acschemneuro.6b00363 [DOI] [PMC free article] [PubMed] [Google Scholar]
- Song P, Hershey ND, Mabrouk OS, Slaney TR, Kennedy RT, 2012. Mass spectrometry “sensor” for in vivo acetylcholine monitoring. Anal. Chem 84, 4659–4664. 10.1021/ac301203m [DOI] [PMC free article] [PubMed] [Google Scholar]
- Steinmetz NA, Buetfering C, Lecoq J, Lee CR, Peters AJ, Jacobs EAK, Coen P, Ollerenshaw DR, Valley MT, De Vries SEJ, Garrett M, Zhuang J, Groblewski PA, Manavi S, Miles J, White C, Lee E, Griffin F, Larkin JD, Roll K, Cross S, Nguyen TV, Larsen R, Pendergraft J, Daigle T, Tasic B, Thompson CL, Waters J, Olsen S, Margolis DJ, Zeng H, Hausser M, Carandini M, Harris KD, 2017. Aberrant cortical activity in multiple GCaMP6-expressing transgenic mouse lines. eNeuro 4. 10.1523/ENEURO.0207-17.2017 [DOI] [PMC free article] [PubMed] [Google Scholar]
- Sun F, Zeng J, Jing M, Zhou J, Feng J, Owen SF, Luo Y, Li F, Wang H, Yamaguchi T, Yong Z, Gao Y, Peng W, Wang L, Zhang S, Du J, Lin D, Xu M, Kreitzer AC, Cui G, Li Y, 2018. A Genetically Encoded Fluorescent Sensor Enables Rapid and Specific Detection of Dopamine in Flies, Fish, and Mice. Cell 174, 481–496.e19. 10.1016/j.cell.2018.06.042 [DOI] [PMC free article] [PubMed] [Google Scholar]
- Sun F, Zhou J, Dai B, Qian T, Zeng J, Li X, Zhuo Y, Zhang Y, Wang Y, Qian C, Tan K, Feng J, Dong H, Lin D, Cui G, Li Y, 2020. Next-generation GRAB sensors for monitoring dopaminergic activity in vivo. Nat. Methods 17, 1156–1166. 10.1038/s41592-020-00981-9 [DOI] [PMC free article] [PubMed] [Google Scholar]
- Takmakov P, Zachek MK, Keithley RB, Walsh PL, Donley C, McCarty GS, Wightman RM, 2010. Carbon microelectrodes with a renewable Surface. Anal. Chem 82, 2020–2028. 10.1021/ac902753x [DOI] [PMC free article] [PubMed] [Google Scholar]
- Taylor IM, Robbins EM, Catt KA, Cody PA, Happe CL, Cui XT, 2017. Enhanced dopamine detection sensitivity by PEDOT/graphene oxide coating on in vivo carbon fiber electrodes. Biosens. Bioelectron 89, 400–410. 10.1016/j.bios.2016.05.084 [DOI] [PMC free article] [PubMed] [Google Scholar]
- Tegtmeier J, Brosch M, Janitzky K, Heinze H-J, Ohl FW, Lippert MT, 2018. CAVE: An Open-Source Tool for Combined Analysis of Head-Mounted Calcium Imaging and Behavior in MATLAB. Front. Neurosci 12, 1–11. 10.3389/fnins.2018.00958 [DOI] [PMC free article] [PubMed] [Google Scholar]
- Tian L, Hires SA, Mao T, Huber D, Chiappe ME, Chalasani SH, Petreanu L, Akerboom J, McKinney SA, Schreiter ER, Bargmann CI, Jayaraman V, Svoboda K, Looger LL, 2009. Imaging neural activity in worms, flies and mice with improved GCaMP calcium indicators. Nat. Methods 6, 875–881. 10.1038/nmeth.1398 [DOI] [PMC free article] [PubMed] [Google Scholar]
- Unger EK, Keller JP, Altermatt M, Liang R, Matsui A, Dong C, Hon OJ, Yao Z, Sun J, Banala S, Flanigan ME, Jaffe DA, Hartanto S, Carlen J, Mizuno GO, Borden PM, Shivange AV, Cameron LP, Sinning S, Underhill SM, Olson DE, Amara SG, Temple Lang D, Rudnick G, Marvin JS, Lavis LD, Lester HA, Alvarez VA, Fisher AJ, Prescher JA, Kash TL, Yarov-Yarovoy V, Gradinaru V, Looger LL, Tian L, 2020. Directed Evolution of a Selective and Sensitive Serotonin Sensor via Machine Learning. Cell 183, 1986–2002.e26. 10.1016/j.cell.2020.11.040 [DOI] [PMC free article] [PubMed] [Google Scholar]
- Ungerstedt U, Pycock C, 1974. Functional correlates of dopamine neurotransmission. Bull. Schweiz. Akad. Med. Wiss 30, 44–55. [PubMed] [Google Scholar]
- van der Linden FH, Mahlandt EK, Arts JJG, Beumer J, Puschhof J, de Man SMA, Chertkova AO, Ponsioen B, Clevers H, van Buul JD, Postma M, Gadella TWJ, Goedhart J, 2021. A turquoise fluorescence lifetime-based biosensor for quantitative imaging of intracellular calcium, bioRxiv. [DOI] [PMC free article] [PubMed] [Google Scholar]
- Venton BJ, Cao Q, 2020. Fundamentals of fast-scan cyclic voltammetry for dopamine detection. Analyst 145, 1158–1168. 10.1039/c9an01586h [DOI] [PMC free article] [PubMed] [Google Scholar]
- Vilardaga JP, Bünemann M, Krasell C, Castro M, Lohse MJ, 2003. Measurement of the millisecond activation switch of G protein-coupled receptors in living cells. Nat. Biotechnol 21, 807–812. 10.1038/nbt838 [DOI] [PubMed] [Google Scholar]
- Villette V, Chavarha M, Dimov IK, Bradley J, Pradhan L, Mathieu B, Evans SW, Chamberland S, Shi D, Yang R, Kim BB, Ayon A, Jalil A, St-Pierre F, Schnitzer MJ, Bi G, Toth K, Ding J, Dieudonné S, Lin MZ, 2019. Ultrafast Two-Photon Imaging of a High-Gain Voltage Indicator in Awake Behaving Mice. Cell 179, 1590–1608.e23. 10.1016/j.cell.2019.11.004 [DOI] [PMC free article] [PubMed] [Google Scholar]
- Wan J, Peng W, Li X, Qian T, Song K, Zeng J, Deng F, Hao S, Feng J, Zhang P, Zhang Y, Zou J, Pan S, Shin M, Venton BJ, Zhu JJ, Jing M, Xu M, Li Y, 2021. A genetically encoded sensor for measuring serotonin dynamics. Nat. Neurosci 24, 746–752. 10.1038/s41593-021-00823-7 [DOI] [PMC free article] [PubMed] [Google Scholar]
- Wang Y, Venton BJ, 2017. Correlation of transient adenosine release and oxygen changes in the caudateputamen. J. Neurochem 140, 13–23. 10.1111/jnc.13705 [DOI] [PMC free article] [PubMed] [Google Scholar]
- Wang Yizhi, Wang C, Ranefall P, Broussard GJ, Wang Yinxue, Shi G, Lyu B, Wu C-T, Wang Yue, Tian L, Yu G, 2019. SynQuant: an automatic tool to quantify synapses from microscopy images. Bioinformatics 36, 1599–1606. 10.1093/bioinformatics/btz760 [DOI] [PMC free article] [PubMed] [Google Scholar]
- Weisenburger S, Tejera F, Demas J, Chen B, Manley J, Sparks FT, Martínez Traub F, Daigle T, Zeng H, Losonczy A, Vaziri A, 2019. Volumetric Ca2+ Imaging in the Mouse Brain Using Hybrid Multiplexed Sculpted Light Microscopy. Cell 177, 1050–1066.e14. 10.1016/j.cell.2019.03.011 [DOI] [PMC free article] [PubMed] [Google Scholar]
- Wong JMT, Malec PA, Mabrouk OS, Ro J, Dus M, Kennedy RT, 2016. Benzoyl chloride derivatization with liquid chromatography-mass spectrometry for targeted metabolomics of neurochemicals in biological samples. J. Chromatogr. A 1446, 78–90. 10.1016/j.chroma.2016.04.006 [DOI] [PMC free article] [PubMed] [Google Scholar]
- Wu J, Abdelfattah AS, Zhou H, Ruangkittisakul A, Qian Y, Ballanyi K, Campbell RE, 2018. Genetically Encoded Glutamate Indicators with Altered Color and Topology. ACS Chem. Biol 13, 1832–1837. 10.1021/acschembio.7b01085 [DOI] [PubMed] [Google Scholar]
- Wu Z, Cui Y, Wang H, Song K, Yuan Z, Dong A, Wu H, Wan Y, Pan S, Peng W, Jing M, Xu M, Luo M, Li Y, 2020. A GRAB sensor reveals activity-dependent non-vesicular somatodendritic adenosine release, bioRxiv. 10.1101/2020.05.04.075564 [DOI] [Google Scholar]
- Xie Y, Chan AW, McGirr A, Xue S, Xiao D, Zeng H, Murphy TH, 2016. Resolution of high-frequency mesoscale intracortical maps using the genetically encoded glutamate sensor iGluSnFR. J. Neurosci 36, 1261–1272. 10.1523/JNEUROSCI.2744-15.2016 [DOI] [PMC free article] [PubMed] [Google Scholar]
- Yang C, Hu K, Wang D, Zubi Y, Lee ST, Puthongkham P, Mirkin MV, Venton BJ, 2019. Cavity Carbon-Nanopipette Electrodes for Dopamine Detection. Anal. Chem 91, 4618–4624. 10.1021/acs.analchem.8b05885 [DOI] [PMC free article] [PubMed] [Google Scholar]
- Yang H, Thompson AB, McIntosh BJ, Altieri SC, Andrews AM, 2013. Physiologically relevant changes in serotonin resolved by fast microdialysis. ACS Chem. Neurosci 4, 790–798. 10.1021/cn400072f [DOI] [PMC free article] [PubMed] [Google Scholar]
- Yang SJ, Del Bonis-O’Donnell JT, Beyene AG, Landry MP, 2021. Near-infrared catecholamine nanosensors for high spatiotemporal dopamine imaging. Nat. Protoc 16, 3026–3048. 10.1038/s41596-021-00530-4 [DOI] [PMC free article] [PubMed] [Google Scholar]
- Yang Y, Liu N, He Y, Liu Y, Ge L, Zou L, Song S, Xiong W, Liu X, 2018. Improved calcium sensor GCaMP-X overcomes the calcium channel perturbations induced by the calmodulin in GCaMP. Nat. Commun 9. 10.1038/s41467-018-03719-6 [DOI] [PMC free article] [PubMed] [Google Scholar]
- Zapata A, Chefer VI, Shippenberg TS, 2009. Microdialysis in Rodents. Curr. Protoc. Neurosci 47, 1–34. 10.1002/0471142301.ns0702s47 [DOI] [PMC free article] [PubMed] [Google Scholar]
- Zestos AG, Kennedy RT, 2017. Microdialysis Coupled with LC-MS/MS for In Vivo Neurochemical Monitoring. AAPS J 19, 1284–1293. 10.1208/s12248-017-0114-4 [DOI] [PMC free article] [PubMed] [Google Scholar]
- Zestos AG, Venton BJ, 2018. Communication—Carbon Nanotube Fiber Microelectrodes for High Temporal Measurements of Dopamine. J. Electrochem. Soc 165, G3071–G3073. 10.1149/2.0111812jes [DOI] [PMC free article] [PubMed] [Google Scholar]
- Zhang J, Liu Y, Jaquins-Gerstl A, Shu Z, Michael AC, Weber SG, 2012. Optimization for speed and sensitivity in capillary high performance liquid chromatography. The importance of column diameter in online monitoring of serotonin by microdialysis. J. Chromatogr. A 1251, 54–62. 10.1016/j.chroma.2012.06.002 [DOI] [PMC free article] [PubMed] [Google Scholar]
- Zhang WH, Herde MK, Mitchell JA, Whitfield JH, Wulff AB, Vongsouthi V, Sanchez-Romero I, Gulakova PE, Minge D, Breithausen B, Schoch S, Janovjak H, Jackson CJ, Henneberger C, 2018. Monitoring hippocampal glycine with the computationally designed optical sensor GlyFS. Nat. Chem. Biol 14, 861–869. 10.1038/s41589-018-0108-2 [DOI] [PubMed] [Google Scholar]
- Zhao Y, Araki S, Wu J, Teramoto T, Chang Y-F, Nakano M, Abdelfattah AS, Fujiwara M, Ishihara T, Nagai T, Campbell RE, 2011. An Expanded Palette of Genetically Encoded Ca2+ Indicators. Science (80-. ). 333, 1888–1891. 10.1126/science.1208592 [DOI] [PMC free article] [PubMed] [Google Scholar]
- Zhou Y, Wong JMT, Mabrouk OS, Kennedy RT, 2015. Reducing Adsorption To Improve Recovery and in Vivo Detection of Neuropeptides by Microdialysis with LC-MS. Anal. Chem 87, 9802–9809. 10.1021/acs.analchem.5b02086 [DOI] [PMC free article] [PubMed] [Google Scholar]
- Zong W, Wu R, Li M, Hu Y, Li Y, Li J, Rong H, Wu H, Xu Y, Lu Y, Jia H, Fan M, Zhou Z, Zhang Y, Wang A, Chen L, Cheng H, 2017. Fast high-resolution miniature two-photon microscopy for brain imaging in freely behaving mice. Nat. Methods 14, 713–719. 10.1038/nmeth.4305 [DOI] [PubMed] [Google Scholar]