Abstract
In this study, the chloroplast (cp) genomes of Hemiptelea davidii, Ulmus parvifolia, Ulmus lamellosa, Ulmus castaneifolia, and Ulmus pumila ‘zhonghuajinye’ were spliced, assembled and annotated using the Illumina HiSeq PE150 sequencing platform, and then compared to the cp genomes of other Ulmus and Ulmaceae species. The results indicated that the cp genomes of the five sequenced species showed a typical tetrad structure with full lengths ranging from 159,113 to 160,388 bp. The large single copy (LSC), inverted repeat (IR), and small single copy (SSC) lengths were in the range of 87,736–88,466 bp, 26,317–26,622 bp and 18,485–19,024 bp, respectively. A total of 130–131 genes were annotated, including 85–86 protein-coding genes, 37 tRNA genes and eight rRNA genes. The GC contents of the five species were similar, ranging from 35.30 to 35.62%. Besides, the GC content was different in different region and the GC content in IR region was the highest. A total of 64-133 single sequence repeat (SSR) loci were identified among all 21 Ulmaceae species. The (A)n and (T)n types of mononucleotide were highest in number, and the lengths were primarily distributed in 10–12 bp, with a clear AT preference. A branch-site model and a Bayes Empirical Bayes analysis indicated that the rps15 and rbcL had the positive selection sites. Besides, the analysis of mVISTA and sliding windows got a lot of hotspots such as trnH/psbA, rps16/trnQ, trnS/trnG, trnG/trnR and rpl32/trnL, which could be utilized as potential markers for the species identification and phylogeny reconstruction within Ulmus in the further studies. Moreover, the evolutionary tree of Ulmaceae species based on common protein genes, whole cp genome sequences and common genes in IR region of the 23 Ulmaceae species were constructed using the ML method. The results showed that these Ulmaceae species were divided into two branches, one that included Ulmus, Zelkova and Hemiptelea, among which Hemiptelea was the first to differentiate and one that included Celtis, Trema, Pteroceltis, Gironniera and Aphananthe. Besides, these variations found in this study could be used for the classification, identification and phylogenetic study of Ulmus species. Our study provided important genetic information to support further investigations into the phylogenetic development and adaptive evolution of Ulmus and Ulmaceae species.
Subject terms: Evolution, Genetics, Molecular biology, Plant sciences, Structural biology
Introduction
Ulmaceae includes approximately 16 genera and 230 species that are primarily distributed in the tropical-to-cold temperate zone of the Northern Hemisphere. Currently, eight genera of Ulmaceae are found in China, including Ulmus, Celtis, Aphananthe, Trema, Gironniera, Zelkova, Hemiptelea, and Pteroceltis. These genera include 46 species and ten varieties1 distributed throughout the country, and Ulmus accounts for nearly half of these species. Elms generally exhibit extensive adaptability and strong resistance2,3, mainly in afforestation and landscape greening applications4,5. In addition, most types of elm woods are hard, delicate, wear-resistant, tough, and excellent in quality, and can be used for furniture, construction, and bridges6. Numerous beneficial substances can be found in the bark and root bark of elms, many of which have high medicinal value7,8. The phloem of elm has high viscosity and can be used as a natural plant adhesive, and the leaves can be used as animal feed9. In addition, the seed oils of Gironniera, Ulmus, Aphananthe, and Celtis can be used for industrial purposes10.
Plant palynological fossils and other studies have documented that elms have existed since approximately the third century of the geological age11,12. As an ancient Tertiary tree family, Ulmaceae is rich in germplasm resources. The large numbers of naturally occurring polyploids and mutants13,14 and interspecific and intraspecific hybrids15 lend themselves to extensive elm varieties worldwide, with complex genetic backgrounds16–18. However, because previous plant classification and identification methods focused on morphological characteristics, pollen characteristics, and flavonoid differential substances19 but generally lacked molecular identification. Many differences and controversies exist in the evolution and classification of Ulmaceae plants20–24, including the attribution of Ulmus, Pteroceltis, Gironniera, Trema, and Aphananthe25,26, and the classification and species determination of Ulmus vary widely27,28.
In this study, we sequenced, assembled and annotated the cp genomes of U. parvifolia, H. davidii, U. lamellosa, U. castaneifolia and U. pumila ‘zhonghuajinye’, and compared their sequences with related species. Moreover, this present study using the cp genome to construct the evolutionary tree aimed to improve our understanding of evolution within Ulmaceae species. The plant-specific cp genome is relatively independent of the nuclear genome. Compared to nuclear genome sequences, the cp genome exhibits a low molecular weight, low nucleotide substitution rate and slow structural variation; therefore, it is increasingly used to solve deep phylogenetic problems within plants29–31. Besides, the structural characteristics and variation of the cp genomes of Ulmus and Ulmaceae species were preliminarily documented to obtain comprehensive understanding the structure of plastomes within Ulmaceae, which will help to lay the foundation for the accurate identification of Ulmus and Ulmaceae species classification and genome evolution.
Materials and methods
Test materials
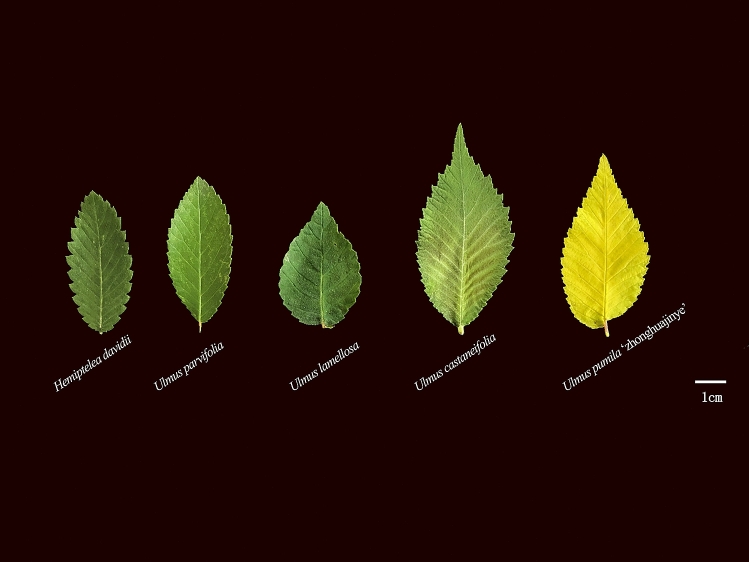
Hemiptelea davidii, Ulmus parvifolia, Ulmus lamellosa, Ulmus castaneifolia and Ulmus pumila ‘zhonghuajinye’ (Fig. 1) were used as the focal experimental species. In May 2019, young and healthy mature leaves on annual branches of each sample were selected from the Germplasm Resources Nursery of the Hebei Forestry and Grassland Science Research Institute. All methods were carried out in accordance with relevant guidelines and regulations.
Figure 1.
Leaves characteristic of four Ulmus species and H. davidii.
DNA extraction and Illumina sequencing
The leaves were cleaned with ultrapure water and then immediately placed into liquid nitrogen and stored at − 80 °C. A plant DNA extraction kit (TIANGEN Biotech, Beijing, China) was used to extract the total DNA from fresh young leaves of each sample. The integrity and quality of total DNA were detected using agarose gel and a NanoDrop2000 microspectrophotometer (Thermo Fisher Scientific, Waltham, MA, USA). The qualified samples were sent to Beijing Zhongxing Bomai Technology Co., Ltd. (Beijing, China) for cp genome sequencing using the Illumina HiSeq PE150 double-end sequencing strategy.
Chloroplast genome assembly, annotation and visualization
Clean reads were filtered using Trimmomatic ver. 0.33 software32 to acquire clean reads by deleting adaptors and low quality reads. GetOrganelle33 was used to assemble cp genome sequences, which were then annotated using GeSeq software34. HMMER and ARAGORN v1.2.3835 were used to ensure the accuracy of the predictions for the encoded protein and RNA genes, respectively. Moreover, the Chloroplotc36 was used to draw the cp genome maps. Finally, the newly obtained cp genomes were uploaded to the NCBI database.
Sequence and genome comparison analyses
The single sequence repeats (SSRs) were determined using MISA37 among the cp genomes of 23 Ulmaceae species. The parameter settings for single mononucleotide, dinucleotide, trinucleotide, tetranucleotide, pentanucleotide and hexanucleotide repeats were ten, six, five, five, five and five, respectively. REPuter38 was to identify and locate the repeat sequences among Ulmaceae species including forward repeats (F), reverse repeats (R), palindromic repeats (P) and complement repeats (C) and the following parameters were used: (1) 30 bp minimum repeat size and (2) 90% or greater sequence identity (Hamming distance = 3). Tandem Repeats Finder ver. 4.0439 was used to analyze and detect tandem repeats, with the default parameters. The mVISTA software40 (Frazer et al., 2004) was used to examine the genetic divergence among Ulmaceae species using U. pumila as reference, in the LAGAN model. We also conducted a window analysis to identify the nucleotide diversity (Pi) among the cp genomes of 21 Ulmaceae species using DnaSP v5.10 software41.
Ka/Ks and positive selection on plastid genes
A total of 77 protein coding genes from 23 cp genomes of Ulmaceae species were selected for positive selected genes (PSGs) identification and analysis. First, MAFFT v742 was used to compare the amino acid sequences of each gene. PhyML v3.0 software43 was then used to construct the phylogenetic tree based on the maximum likelihood (ML) method for the above multiple-sequence alignment results. Subsequently, trimAl v1.444 was used for trimming, and PAML v4.9 CodeML was used for branch-site analysis. The parameters of Model A and Model A null in branch site were Model A (Model = 2, NSsites = 2, fix/omega = 0, omega = 2) and Model A null (Model = 2, NSsites = 2, fix/omega = 1, omega = 1). The likelihood ratio test (LRT) of paml chi2 (chi2 d.f.2ΔlnL) was used to obtain the LRT P value. False discovery rate correction was performed on the LRT P value. Gene with P value < 0.05 was selected as PSG. Lastly, the posterior probabilities of amino acid sites were calculated using Bayes Empirical Bayes (BEB) to determine whether the sites were positively selected.
Phylogenetic analyses
23 Ulmaceae species were selected from the NCBI database (Table S1). The phylogenetic trees were constructed with Arabidopsis thaliana as an outgroup. The cluster analyses were conducted based on the whole cp genome sequence, common protein genes (accD, atpA, atpB, atpE, atpF, atpH, atpI, ccsA, cemA, clpP, matK, ndhA, ndhB, ndhD, ndhE, ndhF, ndhG, ndhH, ndhI, ndhJ, ndhK, petA, petB, petD, petG, petL, petN, psaA, psaB, psaC, psaI, psaJ, psbA, psbB, psbC, psbD, psbE, psbF, psbH, psbI, psbJ, psbK, psbL, psbM, psbN, psbT, psbZ, rbcL, rpl14, rpl16, rpl20, rpl22, rpl23, rpl2, rpl32, rpl33, rpl36, rpoA, rpoB, rpoC1, rpoC2, rps11, rps12, rps14, rps15, rps16, rps18, rps19, rps2, rps3, rps4, rps7, rps8, ycf1, ycf2, ycf3 and ycf4) and common genes in IR region (ndhB, rpl2, rpl23, rps12, rps7, ycf1 and ycf2). MAFFT v7 was used to align the cpDNAs sequences under default parameters42, and the alignment was trimmed by Gblocks/0.91b to remove low-quality regions with the parameters: − t = d − b4 = 5 − b5 = h45. The Maximum-likelihood (ML) method was performed for the phylogenetic analyses using PhyML v3.043. Nucleotide substitution model selection was estimated with jModelTest 2.1.1046. The model GTR + I + G was selected for ML analyses with 1,000 bootstrap replicates to calculate the bootstrap values (BS) of the topology. Moreover, the results were treated with iTOL 3.4.347.
Results and analysis
Chloroplast characteristics of Ulmus species
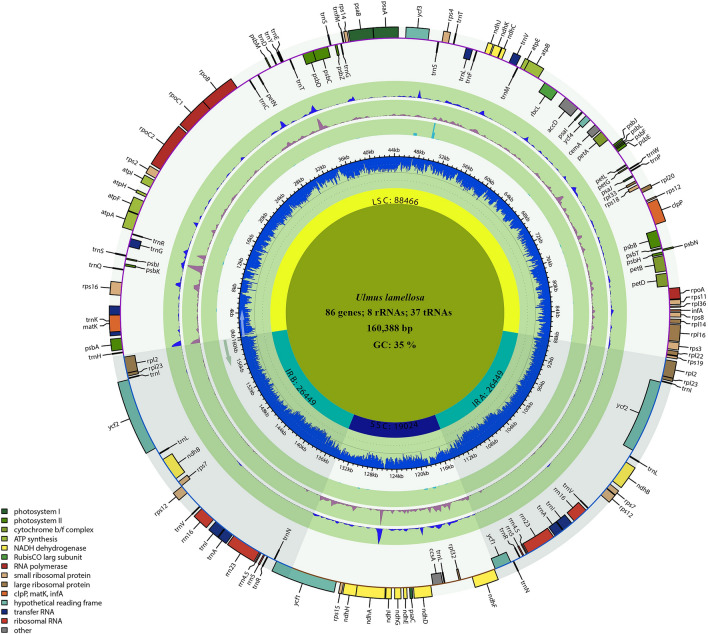
In the present study, the cp genomes of H. davidii, U. parvifolia, U. lamellosa, U. castaneifolia and U. pumila ‘zhonghuajinye’ were sequenced, assembled and annotated. As shown in Fig. 2 and Table 1, the cp genomes of the five species were covalently closed double-chain cyclic molecules with a typical four-segment structure, and the sizes ranged from 159,113 to 160,388 bp (Table 1). U. lamellose had the largest genome, while U. pumila ‘zhonghuajinye’ had the smallest. The lengths of the LSC in each segment varied greatly (87,736–88,466 bp), with a difference of 730 bp. The longest LSC occurred in U. lamellosa, followed by U. castaneifolia, U. pumila ‘zhonghuajinye’, H. davidii, and U. parvifolia. The lengths of the SSC region ranged from 18,485 to 19,024 bp, with a difference of 539 bp. And the variation range of the SSC region was smaller than that of the LSC region. Among them, U. lamellosa had the largest SSC region and U. pumila ‘zhonghuajinye’ had the smallest. Besides, the smallest IR region occurred in U. pumila ‘zhonghuajinye’ (26,317 bp), while the largest was found in H. davidii (26,622 bp). The cp genome of H. davidii with a total of 130 genes contained the smallest number of genes of the five species, while the other four species had 131 genes each. The five species contained 85–86 protein-coding genes, 37 tRNAs and eight rRNAs. In addition, the coding region was longer than the non-coding region and the coding region (36.62–36.74%) had significantly higher GC content than the non-coding region (33.96–34.48%). Moreover, the GC content in rRNA was higher than that in tRNA.
Figure 2.
The cp genome maps of Ulmus species. The species name and specific information regarding the genome (length, GC content, and the number of genes) are depicted in the center of the plot. Extending outward, the four layers are the nucleotide diversity of U. pumila ‘zhonghuajinye’, U. parvifolia, U. castaneifolia and U. lamellosa respectively.
Table 1.
The basic characteristics of the cp genomes of four Ulmus species and H. davidii.
| Hemiptelea davidii | Ulmus parvifolia | Ulmus lamellosa | Ulmus pumila ‘zhonghuajinye’ | Ulmus castaneifolia | |
|---|---|---|---|---|---|
| Total length (bp) | 159,803 | 159,199 | 160,388 | 159,113 | 159,925 |
| Total gene number | 130 | 131 | 131 | 131 | 131 |
| Total GC(%) | 35.30 | 35.60 | 35.43 | 35.62 | 35.49 |
| LSC length (bp) | 87,798 | 87,736 | 88,466 | 87,994 | 88,154 |
| GC (%) | 32.74 | 33.08 | 32.90 | 33.08 | 32.96 |
| SSC length (bp) | 18,761 | 18,743 | 19,024 | 18,485 | 18,955 |
| GC (%) | 28.08 | 28.60 | 28.15 | 28.63 | 28.34 |
| IR length (bp) | 26,622 | 26,360 | 26,449 | 26,317 | 26,408 |
| GC (%) | 42.07 | 42.30 | 42.25 | 42.34 | 42.28 |
| Coding region length | 80,517 | 80,472 | 80,532 | 80,559 | 80,487 |
| Coding region GC (%) | 36.62 | 36.73 | 36.74 | 36.73 | 36.72 |
| Noncoding region length (bp) | 79,286 | 78,727 | 79,856 | 78,554 | 79,438 |
| Noncoding region GC (%) | 33.96 | 34.44 | 34.11 | 34.48 | 34.24 |
| Protein-coding gene number | 85 | 86 | 86 | 86 | 86 |
| tRNA | 37 | 37 | 37 | 37 | 37 |
| tRNA GC (%) | 53.12 | 53.12 | 53.12 | 53.12 | 53.12 |
| rRNA | 8 | 8 | 8 | 8 | 8 |
| rRNA GC (%) | 55.29 | 55.33 | 55.33 | 55.33 | 55.33 |
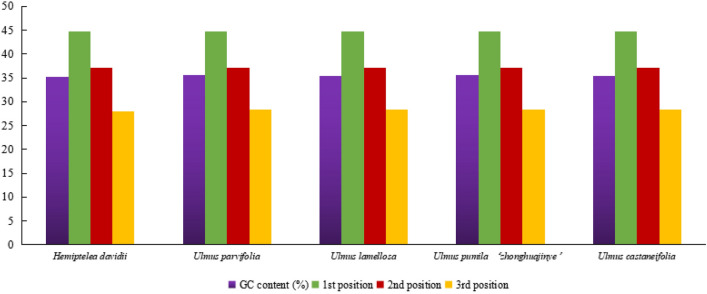
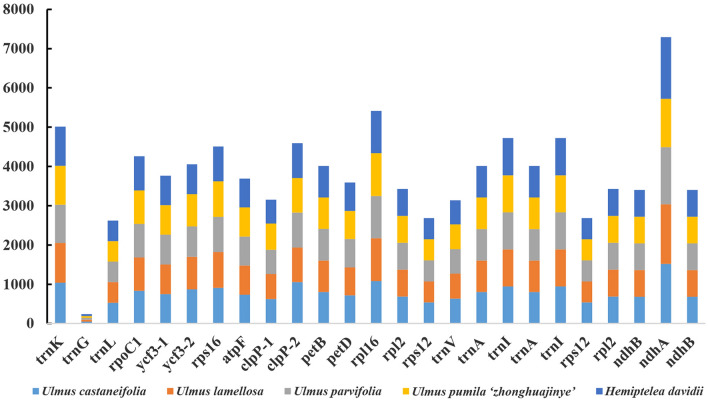
In addition, the total GC contents of the five species were similar, ranging from 35.30 to 35.62% which was higher than in the LSC and SSC regions, but lower than in the IR region. Moreover, the first position had the highest GC content than the second and third positions (Fig. 3). Comparative analysis indicated that gene structure was relatively conservative and most genes did not contain introns. In this study, the number of genes containing introns were 23. Among these, the clpP and ycf3 genes contained two introns. The other genes contained only one intron that primarily involved 13 coding genes (rps16, atpF, rpoC1, rpl2 × 2, ndhB × 2, rps12 × 2, ndhA, petB, petD and rpl16) and eight tRNA genes (trnK, trnG, trnL, trnV, trnI × 2 and trnA × 2). The length of ndhA intron was the longest, followed by rpl16 and trnK (Fig. 4).
Figure 3.
The GC (%) content in different positions of CDs region of species within four Ulmus species and H. davidii.
Figure 4.
Intron length in the chloroplast genomes of four Ulmus species and H. davidii.
Gene loss and the Ka/Ks ratios of ulmaceae species pairwise
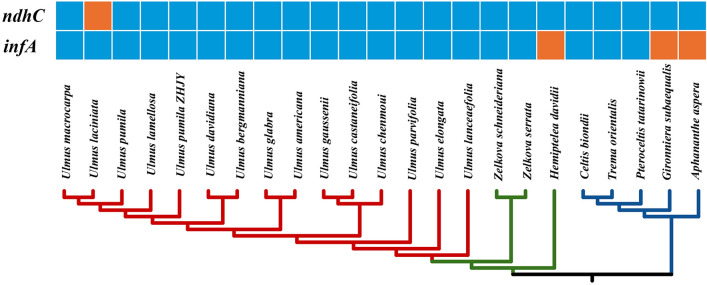
The protein-coding genes of the 23 Ulmaceae species including 15 Ulmus species were counted. The results were shown in Fig. 5. As it was shown, the gene of ndhC was lost in U. laciniata. In addition, the infA was lost in three species (H. davidii, G. subaequalis and A. aspera) with different degree.
Figure 5.
Loss of chloroplast protein-coding genes in the phylogeny of 23 Ulmaceae species.
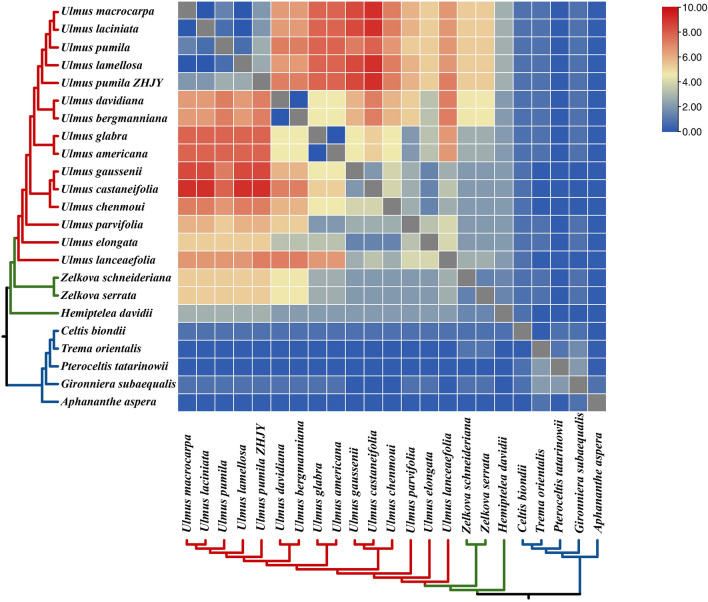
The Ka/Ks ratios, which provided information on the effects of selection pressures on protein coding genes of each 23 Ulmaceae species pair, were calculated (Fig. 6). The results showed that the higher Ka/Ks ratios were detected in Ulmus species pairs than non-Ulmus species pairs.
Figure 6.
Pairwise Ka/Ks ratios in Ulmus and other Ulmaceae species.
Positive selection analysis of protein sequence among Ulmaceae species
Seventy-seven common CDS genes from 23 Ulmaceae species were subjected to positive selection analysis (Table 2 and Supplementary Table S2). And Model A and Model A null were calculated using codeML. The results showed that no genes were positively selected. However, the BEB analysis indicated that two protein-coding genes (rps15 and rbcL) had significant posterior probabilities and there was a positive selection site in each gene. Besides the rps15 and rbcL genes were located in the SC region.
Table 2.
The potential positive selection test based on the branch-site model.
| No | Genes | Null hypothesis | Alternative hypothesis | Significance test | |||||
|---|---|---|---|---|---|---|---|---|---|
| lnL | df | omega (w = 1) | lnL | df | omega (w > 1) | BEB | LRT/P-value | ||
| 1 | psbC | − 2628.876655 | 48 | 1 | − 2628.876655 | 49 | 2.38616 | 1 | |
| 2 | psbD | − 1886.150227 | 48 | 1 | − 1886.150206 | 49 | 1 | 0.99482915 | |
| 3 | psbE | − 438.426396 | 48 | 1 | − 438.426396 | 49 | 1 | 1 | |
| 4 | psbF | − 207.535187 | 48 | 1 | − 207.535187 | 49 | 2.13411 | 1 | |
| 5 | psbH | − 461.853033 | 48 | 1 | − 461.853033 | 49 | 1 | 1 | |
| 6 | psbI | − 198.463720 | 48 | 1 | − 198.463720 | 49 | 1.02032 | 1 | |
| 7 | psbJ | − 268.641875 | 48 | 1 | − 268.641875 | 49 | 1 | 1 | |
| 8 | psbK | − 385.952605 | 48 | 1 | − 385.952606 | 49 | 2.30325 | 1 | |
| 9 | psbL | − 184.308851 | 48 | 1 | − 184.308851 | 49 | 2.85599 | 1 | |
| 10 | psbM | − 158.730809 | 48 | 1 | − 158.730809 | 49 | 1.99465 | 1 | |
| 11 | psbN | − 226.751297 | 48 | 1 | − 226.751297 | 49 | 2.31959 | 1 | |
| 12 | psbT | − 182.788331 | 48 | 1 | − 182.788328 | 49 | 1 | 0.99804559 | |
| 13 | psbZ | − 323.223609 | 48 | 1 | − 323.223610 | 49 | 2.04743 | 1 | |
| 14 | rbcL | − 2862.940558 | 48 | 1 | − 2862.940558 | 49 | 1 | 97 F 0.589 | 1 |
| 15 | rpl14 | − 740.033667 | 48 | 1 | − 740.033667 | 49 | 1.87798 | 1 | |
| 16 | rpl16 | − 817.516599 | 48 | 1 | − 817.516578 | 49 | 1 | 0.99482915 | |
| 17 | rpl20 | − 784.139114 | 48 | 1 | − 784.139113 | 49 | 1.63776 | 0.99887162 | |
| 18 | rpl22 | − 1192.404192 | 48 | 1 | − 1192.404192 | 49 | 1 | 1 | |
| 19 | rpl23 | − 489.910969 | 48 | 1 | − 489.910972 | 49 | 1.60907 | 1 | |
| 20 | rpl2 | − 1318.425181 | 48 | 1 | − 1318.425181 | 49 | 2.00600 | 1 | |
| 21 | rpl32 | − 378.674247 | 48 | 1 | − 378.674247 | 49 | 1 | 1 | |
| 22 | rpl33 | − 408.488673 | 48 | 1 | − 408.488673 | 49 | 1.59913 | 1 | |
| 23 | rpl36 | − 172.345096 | 48 | 1 | − 172.345096 | 49 | 1.67091 | 1 | |
| 24 | rpoA | − 2432.015315 | 48 | 1 | − 2432.015306 | 49 | 1 | 0.99661487 | |
| 25 | rpoB | − 6520.420040 | 48 | 1 | − 6520.420227 | 49 | 2.26257 | 1 | |
| 26 | rpoC1 | − 4522.103881 | 48 | 1 | − 4522.103903 | 49 | 1.78582 | 1 | |
| 27 | rpoC2 | − 10,541.83165 | 48 | 1 | − 10,541.83152 | 49 | 2.51647 | 0.98689001 | |
| 28 | rps11 | − 832.170672 | 48 | 1 | − 832.170681 | 49 | 1.72878 | 1 | |
| 29 | rps12 | − 638.263354 | 48 | 1 | − 638.263335 | 49 | 13.88404 | 0.99508154 | |
| 30 | rps14 | − 610.532984 | 48 | 1 | − 610.532987 | 49 | 1.52180 | 1 | |
| 31 | rps15 | − 719.532818 | 48 | 1 | − 719.270557 | 49 | 18.60132 | 30 D 0.873 | 0.46891907 |
| 32 | rps16 | − 605.186225 | 48 | 1 | − 605.186223 | 49 | 1 | 0.99840423 | |
Repeat sequence analysis of Ulmaceae species
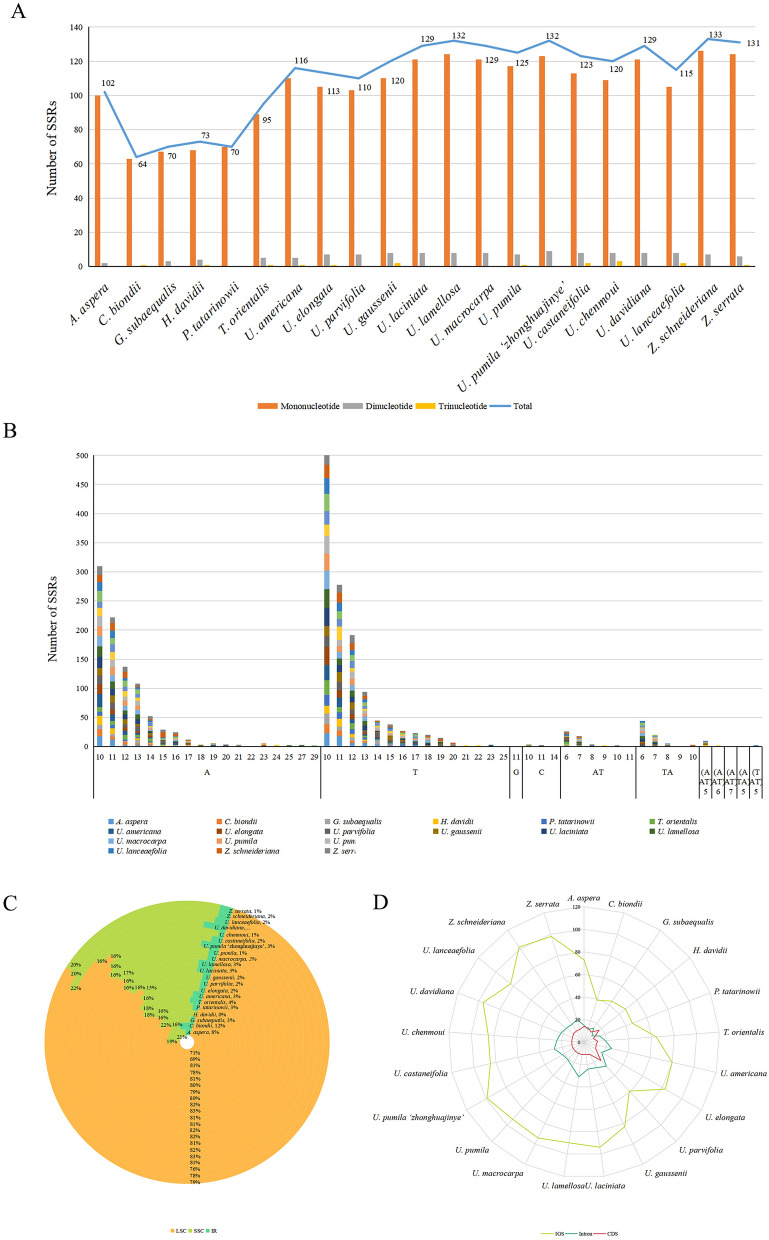
A total of 64–133 SSRs were identified in the cp genome of the 21 Ulmaceae species, with lengths of 10–29 bp, including mononucleotides, dinucleotides and trinucleotides. The mononucleotide repeats ranged from 63 to 126, followed by dinucleotide (2–9) and trinucleotide (1–3) repeats (Fig. 7A). The mononucleotides repeats were mostly composed of (A)n and (T)n, with only one (G)11-type SSR in G. subaequalis; one (G)10-type SSR in P. tatarinowii, T. orientalis, U. elongata and U. pumila ‘zhonghuajinye’; one (C)11-type SSR in A. aspera and U. parvifolia; and one (C)14-type SSR in U. lanceaefolia. Dinucleotide repeats included 11 SSRs of (AT)n and (TA)n of different lengths. Besides, trinucleotide repeats included (AAT)n, (ATA)5 and (TAT)5 SSRs of different lengths (Fig. 7B).
Figure 7.
(A) Analysis of SSRs in the cp genomes of 21 Ulmaceae species; (B) The numbers of SSRs types of 21 Ulmaceae species; (C) Frequency of SSRs in the LSC, IR and SSC region; (D) Frequency of SSRs in intergenic regions, protein-coding genes and introns regions.
The statistical results for the SSR distribution in the LSC, SSC and IR regions of the cp genome indicated that the SSRs in the 21 Ulmaceae species were mainly distributed in the LSC region with 44–107 SSRs, accounting for 69–83% of the total; followed by the SSC region with 11–27 SSRs, accounting for 15–22%; and the IR region with 0–8 SSRs, accounting for 0–12%. SSRs in H. davidii were only distributed in the LSC and SSC regions (Fig. 7C). In addition, SSRs were primarily distributed in intergenic regions ranging from 39 to 102 SSRs, while 9–31 occurred in introns and 9–22 occurred in CDS (Fig. 7D).
In the 21 Ulmaceae species, palindrome repeats (P), forward repeats (F), reverse repeats (R) and complement repeats (C) of repeat sequences were observed. C. biondii was the only species that lacked C repeats. The total number of repeat sequences ranged from 46 to 89 (21–35 of type P, 17–41 of type F, 1–17 of type R and 0–11 of type C), with G. subaequalis containing the fewest and U. gaussenii and U. chenmoui containing the most number (Fig. S1A). Moreover, the lengths of repeats primarily ranged from 30 to 39 bp, although three repeats were longer than 200 bp in U. americana, U. gaussenii and U. castaneifolia (Fig. S1B).
Chloroplast genomic divergence and hotspots regions
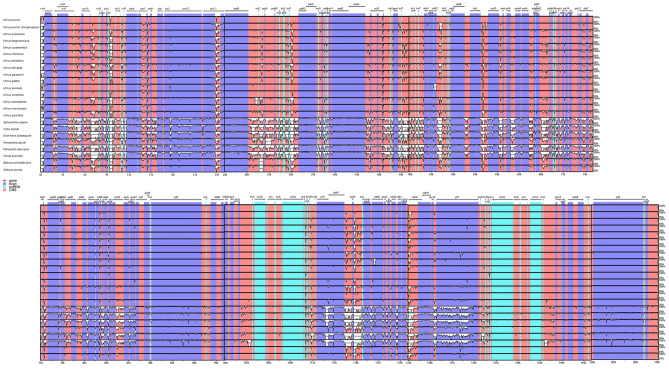
The mVISTA was used to compare and analyze the divergent regions of plastomes among the 23 Ulmaceae species with U. pumila as a reference. (Fig. 8). Overall, the 23 Ulmaceae species could be roughly divided into two groups: one containing 15 Ulmus species and two Zelkova species species; the other containing H. davidii, A. aspera, C. biondii, G. subaequalis, P. tatarinowii and T. orientalis. Significant separation was observed between the two groups. And the results showed that the cp genomes of Ulmus, Zelkova and Hemiptelea species were more conserved than the species of other group. In terms of region variation, the variation range of the LSC and SSC regions were greater than that of the IR regions. Moreover, the conservation of gene-coding regions was generally higher than that of non-coding regions. For example, the non-coding regions of trnH/psbA, trnK/rps16 and trnS/trnG exhibited large variation and could be used as an alternative region for DNA barcoding at later stages. Although the gene-coding region was overall highly conserved, the conservativeness of the ycf1 and ndhD genes was poor. These noncoding region and gene-coding region obtained could also be used as alternative regions for DNA barcoding of Ulmus and Ulmaceae species.
Figure 8.
Sequence identity plots of the 23 Ulmaceae species genomes generated using mVISTA, taking the annotation of U. pumila as a reference. Grey arrows above the alignment indicate the orientation of genes. Blue bars represent exons, pink ones represent non-coding sequences (CNS). X-scale axis represents the genome coordinate positions, Y-scale axis represents the percent identity within 50–100%.
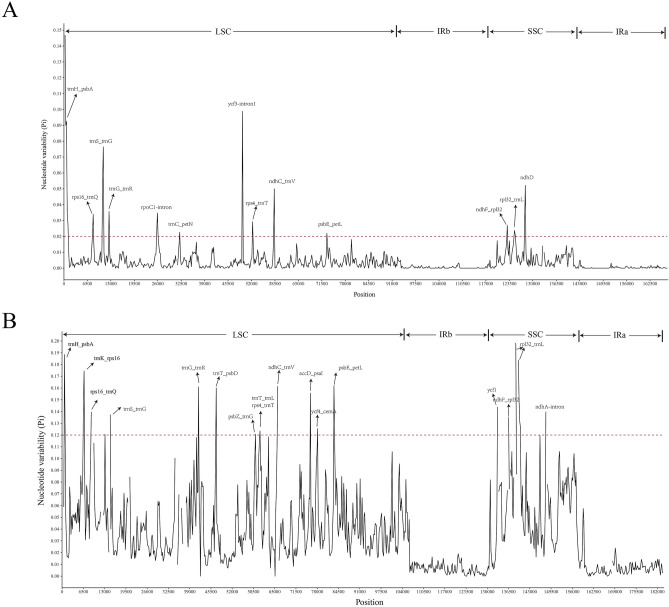
To further clarify the diversity of Ulmus and Ulmaceae species at the sequence level, the nucleotide difference (pi) of the 15 Ulmus species and 23 Ulmaceae species were calculated respectively and suitable polymorphic loci from protein-coding sequences, IGS regions and intronic regions were identifed. The results showed that the most of the regions with the high nucleotide diversity among 15 Ulmus species were included from IGS regions, namely trnH/psbA, rps16/trnQ, trnS/trnG, trnG/trnR, rpoC1-intron, trnC/petN, ycf3-intron1, rps4/trnT, ndhC/trnV, psbE/petL, ndhF/rpl32, rpl32/trnL. The protein-coding regions of ndhD were also included in the suitable polymorphic loci (Fig. 9A, Table 3). What is more, these variation locis were mainly distributed in LSC and SSC region.
Figure 9.
Nucleotide variability (pi) values of 15 Umlus species and 23 Ulmaceae species. (A): pi values of 15 Umlus species. (B): pi values of 23 Ulmaceae species. X-axis: name of the regions; Y-axis: nucleotide diversity. window length: 300 bp; step size: 200 bp.
Table 3.
High variable marker of cp genomes among 15 Ulmus species.
| High/variable/marker | Variable sites | Parsimony informative sites | Nucleotide diversity |
|---|---|---|---|
| trnH/psbA | 106 | 97 | 0.1469388 |
| rps16/trnQ | 34 | 34 | 0.0339336 |
| trnS/trnG | 85 | 75 | 0.0764813 |
| trnG/trnR | 11 | 10 | 0.0357410 |
| rpoC1-intron | 43 | 40 | 0.0347718 |
| trnC/petN | 19 | 17 | 0.0226560 |
| ycf3-intron1 | 6 | 5 | 0.0988095 |
| rps4/trnT | 34 | 34 | 0.0292303 |
| ndhC/trnV | 60 | 60 | 0.0500000 |
| psbE/petL | 22 | 19 | 0.0220286 |
| ndhF/rpl32 | 18 | 17 | 0.0269951 |
| rpl32/trnL | 17 | 17 | 0.0237776 |
| ndhD | 72 | 72 | 0.0521942 |
In addition, We also compared all the regions of cp genomes of the 23 Ulmaceae species in pairwise alignment. the cp genome variation primarily occurred in intergenic regions (Fig. 9B, Table 4), such as trnH/psbA, trnK/rps16, rps16/trnQ, trnS/trnG, trnG/trnR, trnT/psbD, psbZ/trnG, rps4/trnT, trnT/trnL, ndhC/trnV, accD/psaI, ycf4/cemA, psbE/petL, ndhF/rpl32, rpl32/trnL and ndhA-intron. In the coding regions, the most variable gene was ycf1 which showing that the gene-coding regions were more conservative than the non-coding regions. Thus, these region could be used as a potential molecular marker for the identification and phylogenetic analysis of Ulmus and Ulmaceae species.
Table 4.
High variable marker of cp genomes among 23 Ulmaceae species.
| High variable marker | Variable/sites | Parsimony/informative/sites | Nucleotide/diversity |
|---|---|---|---|
| trnH/psbA | 63 | 47 | 0.1885375 |
| trnK/rps16 | 55 | 45 | 0.1745718 |
| rps16/trnQ | 32 | 27 | 0.1396574 |
| trnS/trnG | 31 | 24 | 0.1206239 |
| trnG/trnR | 28 | 24 | 0.1374807 |
| trnT/psbD | 32 | 22 | 0.1609912 |
| psbZ/trnG | 26 | 23 | 0.1600226 |
| rps4/trnT | 24 | 20 | 0.1207277 |
| trnT/trnL | 52 | 35 | 0.1235178 |
| ndhC/trnV | 36 | 28 | 0.1615283 |
| accD/psaI | 35 | 29 | 0.1556324 |
| ycf4/cemA | 14 | 14 | 0.1254941 |
| psbE/petL | 42 | 37 | 0.1620553 |
| ycf1 | 32 | 31 | 0.1438735 |
| ndhF/rpl32 | 16 | 15 | 0.1351779 |
| rpl32/trnL | 122 | 88 | 0.1982872 |
| ndhA-intron | 62 | 49 | 0.1398927 |
Phylogenetic analysis of Ulmaceae species
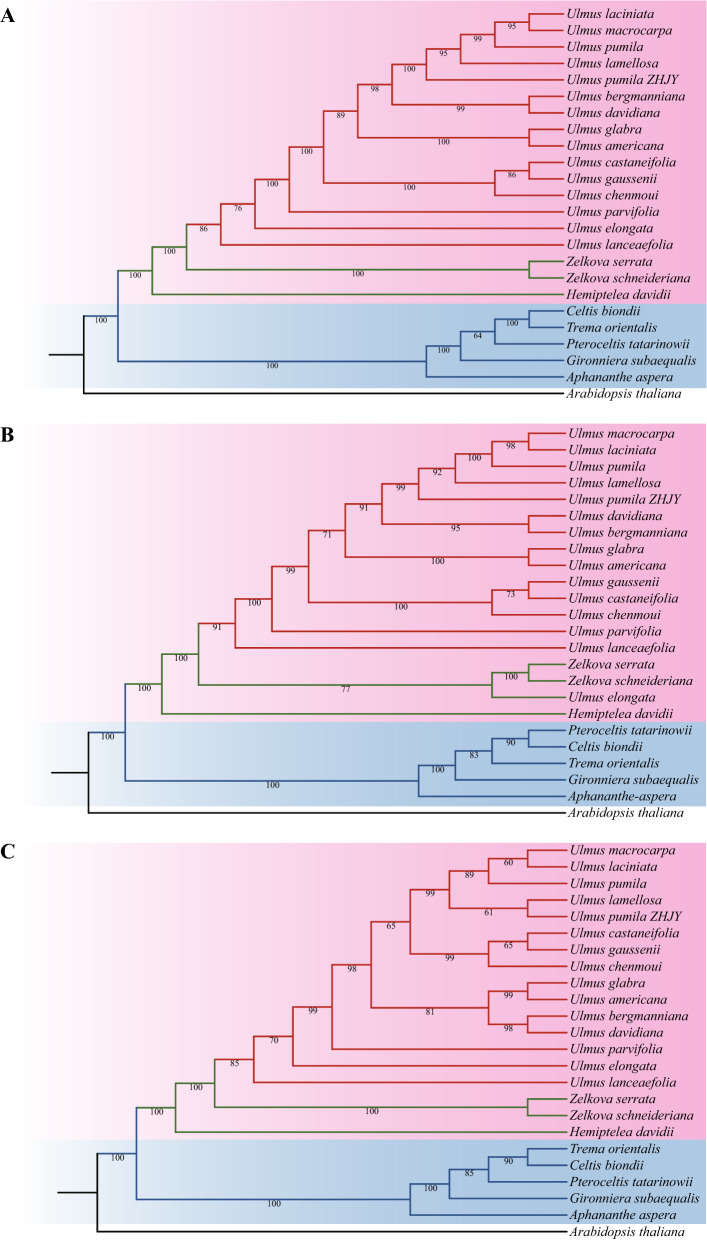
To reveal the developmental relationship of Ulmaceae species, the phylogenetic tree based on the whole cp genome sequences, common protein-coding genes and common genes in IR region of 23 Ulmaceae species were constructed using the ML method. The results of three phylogenetic trees were nearly similar to a certain extent (Fig. 10). The 23 Ulmaceae species could be divided into two branches: one included Ulmus, Zelkova and Hemiptelea, among which Hemiptelea was the first to differentiate; and the other included Celtis, Trema, Pteroceltis, Gironniera and Aphananthe. Of the three trees, the one based on the whole cp genome and the common protein genes were more similar, and the U. lanceaefolia and U. elongata had the different locations. U. lanceaefolia was differentiated after Zelkova in Fig. 10A, while in Fig. 10B the U. lanceaefolia was differentiated after Zelkova and U. elongata. Besides the genetic relationship between C. biondii, T. orientalis, P. tatarinowii were different. The phylogenetic relationship of Ulmus species constucted based on IR region was different from the above two methods (Fig. 10C). For example, the U. chenmoui had a more closer relationship with U. glabra and U. americana.
Figure 10.
Phylogenetic trees of 23 Ulmaceae species. (A) Phylogenetic tree constructed using common protein coding genes; (B) Phylogenetic tree constructed using the whole cp genome; (C) Phylogenetic tree constructed using common genes in IR region.
Discussion
Cp genome variation of Ulmaceae species
In the present study, the cp genome size, structure and composition of the four Ulmus species and H. davidii were highly conserved, displaying a typical quadripartite structure with a LSC, a SSC region and two IR regions, which was similar to the other angiosperms48. The cp genome of the five species ranged from 159,113 to 160,388 bp, encoding 130–131 genes, including 85–86 protein coding genes, 37 tRNAs and eight rRNAs. In particular, rps12 in Ulmaceae was recognized as the trans-spliced gene, which was in consistent with observations in other species49. The five species shared the similar GC content (about 35%). Besides, the overall difference in cp genome size was 1275 bp and the difference in LSC length was 730 bp, accounting for the majority of the cp genome variation. Therefore, the differences in cp genome length of the five species were primarily caused by variation in LSC length based on IR contraction or expansion50. In this study, the gene introns of the five species were compared and analyzed and the results indicated that most genes do not contain introns. There were only 23 genes harbored introns and no intron loss was found in the five species. Among them the clpP and ycf3 gene contained two introns, which is similar with the other plants51. Intron sequences were valuable in phylogenetic studies at lower taxonomic levels (e.g., closely related genera and interspecies)52. Huang et al.53 analyzed the phylogenetic relationship of the four species among Amana by combining partial DNA fragments of ITS nuclear sequence and trnL intron sequence, and proved that Amana wanzhensis was an effective species. Moreover, Huang et al.54 confirmed that the intron of the ndhA gene was a promising DNA barcode for Fagopyrum phylogenetic research. In this study, the ndhA (1233–1570 bp) gene had the longest introns. And the length of the ndhA gene intron varied the 337 bp among the five species. In the future, the intron of the ndhA gene may similarly used as a DNA barcode for the phylogenetic study of Ulmus, which will serve to facilitate the identification and utilization of natural Ulmus resources. The phenomenon of gene loss was common in most plant55. In the present study, the infA and ndhC gene were lost in different species, which was also occured in previous reported 56.
Identification of repeated sequences among Ulmaceae species
cpSSRs, which are uniparentally inherited materia and widely distribute in the genome of eukaryotes, with the characteristics of simple structures, small molecular weight and relative conservation, are short tandem repeats of 2 to 6 bp and widely used in species identification, genetic difference analysis at the individual level and population evolution studies57,58. In this study, a total of 64–133 SSRs were found in the cp genomes of 21 Ulmaceae species, including mononucleotide, dinucleotide and trinucleotide types. The numbers of mononucleotides were the largest among all the types and contributed to AT richness, which was similar to previous results59,60. The distribution of SSR loci in different regions was uneven and primarily occurred in the LSC region, SSC region and intergenic region, and less so in the IR region, gene region and introns. In addition, previous studies had reported that new genes had been generated from repetitive sequences, and SSR loci were more distributed in SCs, which may be one reason for their greater variation compared to the IR region61.
Adaptative evolution of the Ulmaceae plastome
In CodeML, there were four common models including branch model, site model, branch-site model and clade model. Among them, the branch-site model was usually used to assess potential positive selection of genes, in which the nonsynonymous and synonymous rate ratio (ω = dN/dS) was used to measured selection pressure and the ratio ω < 1, ω = 1, ω > 1 were considered to be purifying selection, neutral selection and positive selection, respectively62,63. Then the BEB method was further used to assess whether sites were under positive selection64. The analysis of adaptive evolution of genes is of certain value for studying the changes of gene structure, gene function, and evolutionary track of species65. The plastid genes with positive selection signature suggested that in response to the environment these genes might be undergoing adaptative evolution66. The cp genome was highly conserved and few genes with positive selection were identified, which is consistent with other studies67. For example, it was found that the rpoB, matk, ndhF, rps18, rps7, ycf4, clpP and rbcL genes were positively selected61. And the rpoB and matK gene has been used as DNA barcodes in phylogeny reconstruction of plants68,69. In this study, the positive selection analysis of 77 protein-coding genes among 23 Ulmaceae species indicated that there was no positively selected gene but the rps15 and rbcL had positive selection sites, which is consistent with the study of Xie et al.70, in which there were no significant p-values, while, some genes like petA, rps4, ndhE and rpoC1 were found with positive selection sites in the BEB test. The rps15 was different types of small subunit ribosomal structural proteins. In addition to playing an important regulatory role in ribosomal biosynthesis, the gene were also involved in regulating a variety of cellular life processes, such as genome integrity and development71–73. Besides, the rbcL gene (large subunit of ribose-1,5-diphosphate) was located in the large region outside the reverse repeat sequence, which encoded the large subunit of Rubisco. Eight rbcL and eight rbcS genes encoded by nuclear genes constitute Rubisco, which mainly catalyzed the fixation of carbon dioxide during photosynthesis and the oxidation of carbon during photorespiration. The sequence of the rbcL gene had been widely used in molecular systematics research to detect the systematic relationship and molecular evolution between plants74,75. Wu et al.76 used a single fragment of rbcL to obtain a phylogenetic tree of mangrove plant with a higher average node support rate than the matK and trnH-psbA fragments, which could accurately distinguish different tree species.
Identification of hotspots
DNA barcoding has been widely used in species identification, resource classification and phylogenetic evolution77. Cp genome thus plays an important role in the development of DNA barcoding. For example, the highly variable loci identified through sliding window and mVIST analysis in cp genome could be used as candidate markers for molecular markers, DNA barcoding and evolutionary analysis. Among them the molecular evolution rate of coding region and non-coding region is different, which is suitable for the phylogenetic study of different order. The coding region is suitable for the phylogenetic research of families, orders and even higher taxonomic levels, while the non-coding region is suitable for the phylogenetic research of genera and species78. For example, a phylogenetic tree based on the combined sequences of trnL-trnF and accD-psaI in the chloroplast noncoding region further confirmed the independent evolution of Eastern pear and Western pear from the maternal evolutionary background79. The matK gene, which exhibited rapid evolution and high polymorphism, was widely used as an important marker gene in evolutionary research and species identification80. Moreover, The regions such as matK, rbcL and trnK/rps16 have been proved to be commonly used as DNA barcodes in plant identification81. In this study, the result of alignment and nucleotide diversity revealed the sequencing five species had high level of similarity. It is similar to the other species that the LSC and SSC regions were more variable than the IR regions, whereas the coding regions were more conservative than the non-coding regions82. Some polymorphic regions by comparison of 15 Ulmus species were also identified using the sliding window and mvista analysis. The most divergent regions were trnH/psbA, rps16/trnQ, trnS/trnG, trnG/trnR, rpoC1-intron, trnC/petN, ycf3-intron1, rps4/trnT, ndhC/trnV, psbE/petL, ndhF/rpl32, rpl32/trnL and protein-coding gene ndhD. Among them, trnH-GUG/psbA, trnS/trnG and ndhF/rpl32 had already been screened as a suitable barcode for plants83–85. The trnH/psbA is widely used as a phylogenetic marker in the Asteraceae family86. These hotspot regions obtained in our study could be used as DNA border in plant identification and system evolution in Ulmus species.
Phylogenetic analysis
The base substitution rate in the maternally inherited cp genome was much lower than that in the nuclear genome. Therefore, the cp genome had become an important basis for phylogenetic analysis of higher plants. In the Flora Reipublicae Popularis Sinicae (FRPS), Ulmus species were divided into four sections: Blepharocarpa, Chaetoptelea, Microptelea, and Ulmus. Section Ulmus was further divided into three series: Glabrae, Lanceaefoliae, and Nitentes. Among the five species sequenced in this study, U. parvifolia belongs to Sect. Microptelea; U. castaneifolia belongs to Ser. Nitentes of Sect. Ulmus; U. lamellosa and U. pumila ‘zhonghuajinye’ belong to Ser. Glabrae of Sect. Ulmus, and H. davidii is the only species of Hemiptelea, which is consistent with the results of constructing evolutionary trees from the cp genomes of 23 species. However, several differences existed. First, U. lanceaefolia belongs to Series Lanceaefoliae of Section Ulmus in the FRPS, but our results indicated that it did not belong to Section Ulmus. This discrepancy may be due to the fact that U. lanceaefolia was an evergreen plant, unlike other Ulmus species. A large amount of intraspecific variation in photosynthetic genes and intergenic regions of chloroplast genomes had been reported for other evergreen species87, leading to differences in evolutionary relationships. The second discrepancy was that U. gaussenii belongs to Series Glabrae of Section Ulmus in the FRPS, but our results indicated that this species was clustered into a small branch with U. castaneifolia and U. chenmoui of Series Nitentes. This result was consistent with classifications of Ulmus species based on leaf morphology, wood anatomical structure, and pollen morphology88–90. Based on the results of this study, U. lanceaefolia could be listed as a new Ulmus section or as a new genus of Ulmaceae in parallel with Zelkova and Hemiptelea. Furthermore, U. gaussenii could be included in Series Nitentes. However, the cp genome may not contain enough genetic information to thoroughly analyze the evolutionary relationship of Ulmaceae species; therefore, it is necessary to use nuclear genome information for further classification research.
Supplementary Information
Author contributions
Y.H. and M.Y. conceived and designed the experiments. Y.L. and Y.L. collected the samples and analyzed the sequence data. Y.L., Y.L. and S.F. drafted the manuscript. Y.L., Y.L. and S.Y. revised the manuscript. All authors read and approved the final manuscript.
Funding
This study was supported by the S&T Program of Hebei, China (Grant No. 21326301D) and the Science and Technology Development Foundation, China (Grant No. 206Z6802G).
Data availability
The original contributions presented in the study are publicly available. This data can be found at NCBI (MZ292512, MZ292513, MZ292514, MZ292515).
Competing interests
The authors declare no competing interests.
Footnotes
Publisher's note
Springer Nature remains neutral with regard to jurisdictional claims in published maps and institutional affiliations.
These authors contributed equally: Yichao Liu, Yongtan Li
Contributor Information
Yinran Huang, Email: 13933001838@163.com.
Minsheng Yang, Email: yangms100@126.com.
Supplementary Information
The online version contains supplementary material available at 10.1038/s41598-022-20184-w.
References
- 1.Li F, et al. A summary on phytogenetic classification of Ulmaceae from China. J. Wuhan Bot. Res. 2000;18:412–416. [Google Scholar]
- 2.Sangi MR, et al. Removal and recovery of heavy metals from aqueous solution using Ulmus carpinifolia and Fraxinus excelsior tree leaves. J. Hazard Mater. 2008;155:513–522. doi: 10.1016/j.jhazmat.2007.11.110. [DOI] [PubMed] [Google Scholar]
- 3.Shi L, et al. Effects of sand burial on survival, growth, gas exchange and biomass Allocation of Ulmus pumila seedlings in the Hunshandak Sandland, China. Ann. Bot-Lond. 2004;94:553–560. doi: 10.1093/aob/mch174. [DOI] [PMC free article] [PubMed] [Google Scholar]
- 4.Lin, H. et al. An experimental studies on mediating growth of poplar and elm mixed farm shelterbelt. Chinese J. Ecol. 27–30 (1999).
- 5.Wang H, et al. Study on the effects of different afforestation species on the soil Improvement in coastal saline area. Res. Soil Water Conserv. 2016;23:161–165. [Google Scholar]
- 6.Aytin A, et al. Effect of thermal treatment on the swelling and surface roughness of common alder and wych elm wood. J. For. Res. 2016;27:225–229. doi: 10.1007/s11676-015-0136-7. [DOI] [Google Scholar]
- 7.Cheng S, et al. A new flavonoid from the bark of Ulmus pumila L. Biochem. Syst. Ecol. 2020;88:103956. doi: 10.1016/j.bse.2019.103956. [DOI] [Google Scholar]
- 8.Jung M, et al. Free radical scavenging and total phenolic contents from methanolic extracts of Ulmus davidiana. Food Chem. 2008;108:482–487. doi: 10.1016/j.foodchem.2007.10.081. [DOI] [PubMed] [Google Scholar]
- 9.Beigh YA, et al. Evaluation of himalayan elm (Ulmus wallichiana) leaf meal as a partial substitute for concentrate mixture in total mixed ration of sheep. Small Rumin. Res. 2021;196:106331. doi: 10.1016/j.smallrumres.2021.106331. [DOI] [Google Scholar]
- 10.Tanaka T, et al. Aphananthe aspera kernel oil: A rich source of linoleic acid. J. Am. Oil Chem. Soc. 1977;54:269–269. doi: 10.1007/BF02655170. [DOI] [Google Scholar]
- 11.Bouchal, J. M. et al. Palynological and palaeobotanical investigations in the Miocene Yataan basin, Turkey; High-resoluton taxonomy and biostratigraphy. In Paper presented at the EGU2015. (2015).
- 12.Fang A, et al. Cenozoic terrestrial palynological assemblages in the glacial erratics from the Grove Mountains, east Antarctica. Prog. Nat. Sci. 2009;19:851–859. doi: 10.1016/j.pnsc.2008.01.040. [DOI] [Google Scholar]
- 13.Zalapa, J. E. et al. Hybridization and introgression patterns between native red elm (Ulmus rubra Muhl.) and exotic, invasive Siberian elm (Ulmus pumila L.) examined using species-specific microsatellite markers. In CONGEN3: The Third International Conservation Genetics Symposium. p. 20 (2007).
- 14.López-Cruz A, et al. Ulmus ismaelis (Ulmaceae) y Pilocarpus racemosus var. racemosus (Rutaceae), nuevos registros para la flora de Chiapas, México. Rev. Mex Biodivers. 2013;84:985–988. doi: 10.7550/rmb.35009. [DOI] [Google Scholar]
- 15.Zalapa JE, et al. The extent of hybridization and its impact on the genetic diversity and population structure of an invasive tree, Ulmus pumila (Ulmaceae) Evol. Appl. 2010;3:157–168. doi: 10.1111/j.1752-4571.2009.00106.x. [DOI] [PMC free article] [PubMed] [Google Scholar]
- 16.Whittemore AT, et al. Ulmus americana (Ulmaceae) is a polyploid complex. Am. J. Bot. 2011;98:754–760. doi: 10.3732/ajb.1000372. [DOI] [PubMed] [Google Scholar]
- 17.Cox K, et al. Interspecific hybridisation and interaction with cultivars affect the genetic variation of Ulmus minor and Ulmus glabra in Flanders. Tree Genet. Genomes. 2014;10:813–826. doi: 10.1007/s11295-014-0722-4. [DOI] [Google Scholar]
- 18.Feng GP, et al. Paleocene wuyun flora in northeast China: Ulmus furcinervis of Ulmaceae. Acta Bot. Sin. 2003;45:146–150. [Google Scholar]
- 19.Giannasi DE. Generic relationships in the Ulmaceae based on flavonoid chemistry. Taxon. 1978;27:331–344. doi: 10.2307/1220369. [DOI] [Google Scholar]
- 20.Oginuma K, et al. Karyomorphology of some moraceae and cecropiaceae (Urticales) J. Plant Res. 1995;108:313–326. doi: 10.1007/BF02344357. [DOI] [Google Scholar]
- 21.Omori Y, et al. Gynoecial vascular anatomy and its systematic implications in Celtidaceae and Ulmaceae (Urticales) J. Plant Res. 1993;106:249–258. doi: 10.1007/BF02344593. [DOI] [Google Scholar]
- 22.Ren, X. et al. Studies on morphology and cluster analysis of fruits and seeds in Ulmaceae in China. Hebei J. For. Orchard Res. 4–8 (1997).
- 23.Ueda K, et al. A molecular phylogeny of celtidaceae and ulmaceae (Urticales) based onrbcL nucleotide sequences. J. Plant Res. 1997;110:171–178. doi: 10.1007/BF02509305. [DOI] [Google Scholar]
- 24.Zavada M. Pollen morphology of Ulmaceae. Grana. 2009;22:23–30. doi: 10.1080/00173138309429910. [DOI] [Google Scholar]
- 25.Wu Z, et al. Classification of white pigment trees. J. South China Agr. Univ. 1988;03:71–73. [Google Scholar]
- 26.Zavada MS, et al. Phylogenetic analysis of Ulmaceae. Plant Syst. Evol. 1996;200:13–20. doi: 10.1007/BF00984745. [DOI] [Google Scholar]
- 27.Sweitzer EM. Comparative anatomy of ulmaceae. J. Arnold Arbor. 1971;52(4):523–585. doi: 10.5962/bhl.part.9117. [DOI] [Google Scholar]
- 28.Wiegrefe SJ, et al. Phylogeny of elms (Ulmus, Ulmaceae): Molecular evidence for a sectionalclassification. Syst. Bot. 1994;19:590. doi: 10.2307/2419779. [DOI] [Google Scholar]
- 29.Michael TC, et al. Rates and patterns of chloroplast DNA evolution. P. Nalt. Acad. Sci. USA. 1994;91:6795–6801. doi: 10.1073/pnas.91.15.6795. [DOI] [PMC free article] [PubMed] [Google Scholar]
- 30.Sugiura M. The chloroplast genome. Plant Mol. Biol. 1992;19:149–168. doi: 10.1007/BF00015612. [DOI] [PubMed] [Google Scholar]
- 31.Ying W, et al. Comparative chloroplast genomics of gossypium species: Insights into repeat sequence variations and phylogeny. Front. Plant Sci. 2018;9:376. doi: 10.3389/fpls.2018.00376. [DOI] [PMC free article] [PubMed] [Google Scholar]
- 32.Bolger AM, et al. Trimmomatic: A flexible trimmer for illumina sequence data. Bioinformatics. 2014;30:2114–2120. doi: 10.1093/bioinformatics/btu170. [DOI] [PMC free article] [PubMed] [Google Scholar]
- 33.Jin, J. J. et al. GetOrganelle: A fast and versatile toolkit for accurate denovo assembly of organelle genomes. BioRxiv, 256479 (2019). [DOI] [PMC free article] [PubMed]
- 34.Tillich M, et al. GeSeq-versatile and accurate annotation of organelle genomes. Nucleic Acids Res. 2017;45:W6–W11. doi: 10.1093/nar/gkx391. [DOI] [PMC free article] [PubMed] [Google Scholar]
- 35.Laslett D, et al. ARAGORN, a program to detect tRNA genes and tmRNA genes in nucleotide sequences. Nucleic Acids Res. 2004;32:11–16. doi: 10.1093/nar/gkh152. [DOI] [PMC free article] [PubMed] [Google Scholar]
- 36.Zheng S, et al. Chloroplot: an online program for the versatile plotting of organelle genomes. Front. Genet. 2020;11:576124. doi: 10.3389/fgene.2020.576124. [DOI] [PMC free article] [PubMed] [Google Scholar]
- 37.Beier S, Thiel T, Münch T, Scholz U, Mascher M. MISA-web: A web server for microsatellite prediction. Bioinformatics. 2017;33(16):2583–2585. doi: 10.1093/bioinformatics/btx198. [DOI] [PMC free article] [PubMed] [Google Scholar]
- 38.Kurtz S, et al. REPuter: The manifold applications of repeat analysis on a genomic scale. Nucleic Acids Res. 2001;29:4633–4642. doi: 10.1093/nar/29.22.4633. [DOI] [PMC free article] [PubMed] [Google Scholar]
- 39.Benson G. Tandem repeats finder: A program to analyze DNA sequences. Nucleic Acids Res. 1999;27:573–580. doi: 10.1093/nar/27.2.573. [DOI] [PMC free article] [PubMed] [Google Scholar]
- 40.Frazer KA, et al. VISTA: Computational tools for comparative genomics. Nucleic Acids Res. 2004;32:W273–279. doi: 10.1093/nar/gkh458. [DOI] [PMC free article] [PubMed] [Google Scholar]
- 41.Librado P, et al. DnaSP v5: A software for comprehensive analysis of DNA polymorphism data. Bioinformatics. 2009;25:1451–1452. doi: 10.1093/bioinformatics/btp187. [DOI] [PubMed] [Google Scholar]
- 42.Katoh K, et al. MAFFT: A novel method for rapid multiple sequence alignment based on fast fourier transform. Nucleic Acids Res. 2002;30:3059–3066. doi: 10.1093/nar/gkf436. [DOI] [PMC free article] [PubMed] [Google Scholar]
- 43.Guindon S, et al. New algorithms and methods to estimate maximumlikelihood phylogenies: Assessing the performance of PhyML 3.0. Syst. Biol. 2010;59:307–321. doi: 10.1093/sysbio/syq010. [DOI] [PubMed] [Google Scholar]
- 44.Capella-Gutierrez S, et al. trimAl: A tool for automated alignment trimming in large-scale phylogenetic analyses. Bioinformatics. 2009;25:1972–1973. doi: 10.1093/bioinformatics/btp348. [DOI] [PMC free article] [PubMed] [Google Scholar]
- 45.Castresana J. Selection of conserved blocks from multiple alignments for their use in phylogenetic analysis. Mol. Biol. Evol. 2000;17:540–552. doi: 10.1093/oxfordjournals.molbev.a026334. [DOI] [PubMed] [Google Scholar]
- 46.Darriba D, et al. jModelTest 2: More models, new heuristics and parallel computing. Nat. Methods. 2012;9:772–772. doi: 10.1038/nmeth.2109. [DOI] [PMC free article] [PubMed] [Google Scholar]
- 47.Letunic I, et al. Interactive tree of life (iTOL) v3: An online tool for the display and annotation of phylogenetic and other trees. Nucleic Acids Res. 2016;44:W242–W245. doi: 10.1093/nar/gkw290. [DOI] [PMC free article] [PubMed] [Google Scholar]
- 48.Zhang X, et al. Optimization of assembly pipeline may improve the sequence of the chloroplast genome in Quercus spinosa. Sci. Rep. 2018;8:8906. doi: 10.1038/s41598-018-27298-0. [DOI] [PMC free article] [PubMed] [Google Scholar]
- 49.Chen HM, et al. Sequencing and analysis of Strobilanthes cusia (Nees) Kuntze chloroplast genome revealed the rare simultaneous contraction and expansion of the inverted repeat region in Angiosperm. Front. Plant Sci. 2018;9:324. doi: 10.3389/fpls.2018.00324. [DOI] [PMC free article] [PubMed] [Google Scholar]
- 50.Liu X, et al. Complete chloroplast genome sequence and phylogenetic analysis of Quercus bawanglingensis Huang, Li et Xing, a Vulnerable Oak Tree in China. Forests. 2019;10(7):587. doi: 10.3390/f10070587. [DOI] [Google Scholar]
- 51.Sablok G, et al. Sequencing the plastid genome of giant ragweed (Ambrosia trifida, Asteraceae) from a herbarium specimen. Front. Plant Sci. 2019;10:218. doi: 10.3389/fpls.2019.00218. [DOI] [PMC free article] [PubMed] [Google Scholar]
- 52.Song B, et al. The utility of trnK intron 5′ region in phylogenetic analysis of Ulmaceae s.l. Acta Phytotaxon. Sin. 2002;40:125–132. [Google Scholar]
- 53.Huang L, et al. Amana wanzhensis (Liliaceae), a new species from Anhui., China. Phytotaxa. 2014;177:118–124. doi: 10.11646/phytotaxa.177.2.3. [DOI] [Google Scholar]
- 54.Huang Y, et al. PsbE-psbL and ndhA intron, the promising plastid DNA barcode of fagopyrum. Int. J. Mol. Sci. 2019;20:3455. doi: 10.3390/ijms20143455. [DOI] [PMC free article] [PubMed] [Google Scholar]
- 55.Samigullin TH, et al. Complete plastid genome of the recent holoparasite Lathraea squamaria reveals earliest stages of plastome reduction in Orobanchaceae. PLoS ONE. 2016;11:0150718. doi: 10.1371/journal.pone.0150718. [DOI] [PMC free article] [PubMed] [Google Scholar]
- 56.Zuo LH, et al. The first complete chloroplast genome sequences of Ulmus species by de novo sequencing: Genome comparative and taxonomic position analysis. PLoS ONE. 2017;12:e0171264. doi: 10.1371/journal.pone.0171264. [DOI] [PMC free article] [PubMed] [Google Scholar]
- 57.Alzahrani DA, et al. Complete cp genome sequence of Barleria prionitis, comparative chloroplast genomics and phylogenetic relationships among Acanthoideae. BMC Genom. 2020;21:393. doi: 10.1186/s12864-020-06798-2. [DOI] [PMC free article] [PubMed] [Google Scholar]
- 58.Provan J, et al. Chloroplast microsatellites: New tools for studies in plant ecology and evolution. Trends Ecol. Evol. 2001;16:142–147. doi: 10.1016/S0169-5347(00)02097-8. [DOI] [PubMed] [Google Scholar]
- 59.Feng S, et al. Complete cp genomes of four Physalis species (Solanaceae): Lights into genome structure, comparative analysis, and phylogenetic relationships. BMC Plant Biol. 2020;20:242. doi: 10.1186/s12870-020-02429-w. [DOI] [PMC free article] [PubMed] [Google Scholar]
- 60.Liu L, et al. cp genome analyses and genomic resource development for epilithic sister genera Oresitrophe and Mukdenia (Saxifragaceae), using genome skimming data. BMC Genom. 2018;19:235. doi: 10.1186/s12864-018-4633-x. [DOI] [PMC free article] [PubMed] [Google Scholar]
- 61.Li Y, et al. Comparative analyses of Euonymus cp genomes: Genetic structure, screening for loci with suitable polymorphism, positive selection genes, and phylogenetic relationships within Celastrineae. Front. Plant Sci. 2020;11:593984. doi: 10.3389/fpls.2020.593984. [DOI] [PMC free article] [PubMed] [Google Scholar]
- 62.Yang Z, et al. Statistical properties of the branch-site test of positive selection. Mol. Biol. Evol. 2011;28:1217–1228. doi: 10.1093/molbev/msq303. [DOI] [PubMed] [Google Scholar]
- 63.Yang Z, Nielsen R. Codon-Substitution Models for detecting molecular adaptation at individual sites along specific lineages. Mol. Biol. Evol. 2002;19(6):908–917. doi: 10.1093/oxfordjournals.molbev.a004148. [DOI] [PubMed] [Google Scholar]
- 64.Yang Z, et al. Bayes empirical bayes inference of amino acid sites under positive selection. Mol. Biol. Evol. 2005;22:1107–1118. doi: 10.1093/molbev/msi097. [DOI] [PubMed] [Google Scholar]
- 65.Nei M, et al. Molecular Evolution and Phylogenetics. Oxford: Oxford University Press; 2000. [Google Scholar]
- 66.Ivanova Z, et al. Chloroplast genome analysis of resurrection tertiary relict Haberlea rhodopensis highlights genes important for desiccation stress response. Front. Plant Sci. 2017;8:204. doi: 10.3389/fpls.2017.00204. [DOI] [PMC free article] [PubMed] [Google Scholar]
- 67.Yin K, et al. Different natural selection pressures on the atpF gene in evergreen sclerophyllous and deciduous oak species: evidence from comparative analysis of the complete chloroplast genome of Quercus aquifolioides with other oak species. Int. J. Mol. Sci. 2018;19:1042. doi: 10.3390/ijms19041042. [DOI] [PMC free article] [PubMed] [Google Scholar]
- 68.Daniell H, et al. Chloroplast genomes: Diversity, evolution, and applications in genetic engineering. Genome Biol. 2016;17:134. doi: 10.1186/s13059-016-1004-2. [DOI] [PMC free article] [PubMed] [Google Scholar]
- 69.Krawczyk K, et al. The uneven rate of the molecular evolution of gene sequences of DNA-dependent RNA polymerase I of the genus Lamium L. Int. J. Mol. Sci. 2013;14:11376–11391. doi: 10.3390/ijms140611376. [DOI] [PMC free article] [PubMed] [Google Scholar]
- 70.Xie DF, et al. Phylogeny of chinese Allium species in section daghestanica and adaptive evolution of Allium (Amaryllidaceae, Allioideae) species revealed by the chloroplast complete genome. Front. Plant Sci. 2019;10:460. doi: 10.3389/fpls.2019.00460. [DOI] [PMC free article] [PubMed] [Google Scholar]
- 71.Bonham-Smith PC, et al. Cytoplasmic ribosomal protein S15a from Brassica napus: Molecular cloning and developmental expression in mitotically active tissues. Plant Mol. Biol. 1992;18:909–919. doi: 10.1007/BF00019205. [DOI] [PubMed] [Google Scholar]
- 72.Guo, H. et al. Advances in ribosomal protein regulation of viral life cycle. Chin. J. Anim. Infec. Dis. 1–13 (2020).
- 73.Lilyn D, et al. Ribosomal proteins RPL37, RPS15 and RPS20 regulate the mdm2-p53-mdmx network. PLoS ONE. 2013;8:e68667. doi: 10.1371/journal.pone.0068667. [DOI] [PMC free article] [PubMed] [Google Scholar]
- 74.Gao QB, et al. Population genetic differentiation and taxonomy of three closely related sspecies of Saxifraga (Saxifragaceae) from southern tibet and the Hengduan Mountains. Front. Plant Sci. 2017;8:1325. doi: 10.3389/fpls.2017.01325. [DOI] [PMC free article] [PubMed] [Google Scholar]
- 75.Shen J, et al. Plastome evolution in dolomiaea (Asteraceae, Cardueae) using phylogenomic and comparative analyses. Front. Plant Sci. 2020;11:376. doi: 10.3389/fpls.2020.00376. [DOI] [PMC free article] [PubMed] [Google Scholar]
- 76.Wu F, et al. Assessment of major mangrove plants from guangdong province using DNA barcode. J. Northeast For. Univ. 2020;48:42–49. [Google Scholar]
- 77.Liu X, et al. Complete chloroplast genome sequence and phylogenetic analysis of Quercus bawanglingensis Huang, Li et Xing, a vulnerable oak tree in China. Forests. 2019;10:587. doi: 10.3390/f10070587. [DOI] [Google Scholar]
- 78.Li Y, et al. Structural and comparative analysis of the complete chloroplast genome of Pyrus hopeiensis-“Wild plants with a tiny population”-and three other Pyrus Species. Int. J. Mol. Sci. 2018;19:3262. doi: 10.3390/ijms19103262. [DOI] [PMC free article] [PubMed] [Google Scholar]
- 79.Hu CY, et al. Characterization and phylogenetic utility of non-coding chloroplast regions trnL-trnF and accD-psaI in Pyrus. Acta Hortic. Sinica. 2011;38:2261–2272. [Google Scholar]
- 80.İpek M, et al. Testing the utility of matK and ITS DNA regions for discrimination of Allium species. Turk. J. Bot. 2014;38:203–212. doi: 10.3906/bot-1308-46. [DOI] [Google Scholar]
- 81.Zhou T, et al. Comparative chloroplast genome analyses of species in Gentiana section Cruciata (Gentianaceae) and the development of authentication markers. Int. J. Mol. Sci. 2018;19:1962. doi: 10.3390/ijms19071962. [DOI] [PMC free article] [PubMed] [Google Scholar]
- 82.Yang Y, et al. Remarkably conserved plastid genomes of Quercus group cerris in China: Comparative and phylogenetic analyses. Nord. J. Bot. 2018;36:e01921. doi: 10.1111/njb.01921. [DOI] [Google Scholar]
- 83.Shaw J, et al. Chloroplast DNA sequence utility for the lowest phylogenetic and phylogeographic inferences in angiosperms: The tortoise and the hare IV. Am. J. Bot. 2014;101:1987–2004. doi: 10.3732/ajb.1400398. [DOI] [PubMed] [Google Scholar]
- 84.Shaw J, et al. Comparison of whole chloroplast genome sequences to choose noncoding regions for phylogenetic studies in angiosperms: The tortoise and the hare III. Am. J. Bot. 2007;94:275–288. doi: 10.3732/ajb.94.3.275. [DOI] [PubMed] [Google Scholar]
- 85.Thode VA, et al. Comparative chloroplast genomics at low taxonomic levels: A case study using Amphilophium (Bignonieae, Bignoniaceae) Front. Plant Sci. 2019;10:796. doi: 10.3389/fpls.2019.00796. [DOI] [PMC free article] [PubMed] [Google Scholar]
- 86.Doorduin L, et al. The complete chloroplast genome of 17 individuals of pest species Jacobaea vulgaris: SNPs, microsatellites and barcoding markers for population and phylogenetic studies. DNA Res. 2011;18:93–105. doi: 10.1093/dnares/dsr002. [DOI] [PMC free article] [PubMed] [Google Scholar]
- 87.Lee JH, et al. Preliminary search of intraspecific chloroplast DNA variation of nine evergreen broad Leaved plants in East Asia. Korean J. Plant Taxon. 2011;41:194–201. doi: 10.11110/kjpt.2011.41.3.194. [DOI] [Google Scholar]
- 88.Li HM, et al. The comparative anatomical study on leaves of 12 species and 2 varieties of Ulmus in China. J. Henan For. Sci. Technol. 2004;24:1–3. [Google Scholar]
- 89.Li HM, et al. Wood anatomy of 12 species and 2 varieties from Ulmus of China. J. Henan For. Sci. Technol. 2007;27:1–3. [Google Scholar]
- 90.Xin YQ, et al. Studies on the pollen morphology of the genus Ulmus L in China and its taxonomic significance. J. Integr. Plant Biol. 1993;35:91–95. [Google Scholar]
Associated Data
This section collects any data citations, data availability statements, or supplementary materials included in this article.
Supplementary Materials
Data Availability Statement
The original contributions presented in the study are publicly available. This data can be found at NCBI (MZ292512, MZ292513, MZ292514, MZ292515).


