

Abstract
Chimeric Antigen Receptor (CAR)-T cell therapy has revolutionized the treatment of hematologic malignancies. Approximately half of patients with refractory large B-cell lymphomas achieve durable responses from CD19-targeting CAR-T treatment; however, failure mechanisms are identified in only a fraction of cases. To gain novel insights into the basis of clinical response, we performed single-cell transcriptome sequencing of 105 pre- and post-treatment peripheral blood mononuclear cell samples, and infusion products collected from 32 individuals with large B-cell lymphoma treated with either of two CD19 CAR-T products: axicabtagene ciloleucel (axi-cel) or tisagenlecleucel (tisa-cel). Expansion of proliferative memory-like CD8 clones was a hallmark of tisa-cel response, whereas axi-cel responders displayed more heterogeneous populations. Elevations in CAR-T regulatory cells (CAR-Tregs) among non-responders to axi-cel were detected, and these populations were capable of suppressing conventional CAR-T cell expansion and driving late relapses in an in vivo model. Our analyses reveal the temporal dynamics of effective responses to CAR-T therapy, the distinct molecular phenotypes of CAR-T cells with differing designs, and the capacity for even small increases in CAR-Tregs to drive relapse.
Editor summary:
Single-cell transcriptomics analyses of pre- and post-treatment peripheral blood mononuclear cells from patients treated with CD19 CAR-T products reveals a role for CAR-T regulatory cells in treatment relapse.
Introduction
CAR-T cell therapy has revolutionized the treatment of hematologic malignancies, resulting in multiple Food and Drug Administration (FDA) approvals since 2017. However, long-term responses only persist in roughly half of patients1,2. Proposed mechanisms for relapse include tumor resistance to apoptosis3,4, target antigen loss5, upregulation of inhibitory receptors, and intrinsic T-cell deficiencies6,7. For patients with chronic lymphocytic leukemia, a dearth of specific apheresis and CAR-T subpopulations appeared to be important for response7. However, thus far, investigation of mechanisms of resistance to CAR-T therapy in aggressive large-B cell lymphomas (LBCL) has been limited.
The first two FDA approved CAR-T cell products for LBCL, axicabtagene ciloleucel (axi-cel) and tisagenlecleucel (tisa-cel), utilize similar CAR designs with identical extracellular binding domains. They have, however, differing manufacturing processes and costimulatory domains (CD28 and 4–1BB respectively), endowing them with different expansion and phenotypic characteristics while maintaining comparable clinical efficacy8. CD19 loss has been reported in roughly 30% of lymphoma relapses9, suggesting other factors may explain a majority of cases of non-response or relapse. A recent study of single-cell RNA sequencing (scRNA-seq) data on cellular infusion products from LBCL patients treated with axi-cel identified an association between complete clinical response and higher frequencies of CD8 T cells expressing memory signatures, while poor clinical response was associated with CD8 T cell exhaustion10. Much, however, remains to be understood with respect to how transcriptional mechanisms of response vary by product, evolve after infusion into the patient, or fit into the broader context of the host immune system.
We hypothesized that studying the evolutionary trajectories of patient-derived T cells and CAR-T cells from two different CAR products would yield insights into their respective modes of failure. Here, we performed scRNA-seq and single-cell TCR-sequencing of 105 samples from 32 patients with LBCL treated with axi-cel or tisa-cel, collected over the course of treatment. We found substantial differences in the cellular dynamics of response between the two products: tisa-cel responses were associated with striking expansion of rare CD8+ central-memory-like populations from the infusion products, while axi-cel treatment revealed less shifting of T-cell lineages between IP and post-treatment. In axi-cel IPs, we identified increased frequencies of CAR-Treg populations in patients lacking clinical responses. We then showed, through in vitro and in vivo modeling, that these CAR-Treg cells, expressing either product, can suppress conventional CAR-T activity and thus facilitate relapse.
Results
We performed scRNA-seq on peripheral blood mononuclear cells (PBMC) collected from multiple timepoints from 32 individuals with LBCL treated with axi-cel (n=19) and tisa-cel (n=13), along with their matching infusion products (IP) (Figs. 1a,b; Supplementary Table 1, 2). Patient outcomes were tracked for up to six months, with fluorodeoxyglucose positron emission tomography (FDG-PET) scans taken for clinical response approximately 1, 3, and 6 months post-infusion for most patients. We observed 15 of 32 (47%) patients progress or relapse within the six-month window of observation, consistent with the known clinical activity of these agents (Fig. 1b). We analyzed PBMCs collected within 30 days prior to treatment (n=20 total, n=12 at day −30, n=4 at day −5, and n=4 on the day of infusion) and, to capture the peak CAR-T expansion, also at 7 days after treatment (n=29). When possible, day 7 cells were sorted by flow cytometry based on expression of the CAR to generate an enriched fraction of CAR-T cells (n=22) (Extended Data Fig. 1a, Methods). Altogether, our cohort yielded a total of 602,577 high-quality cells.
Figure 1. The landscape of CAR-T and host immune populations in CAR-T treated patients.
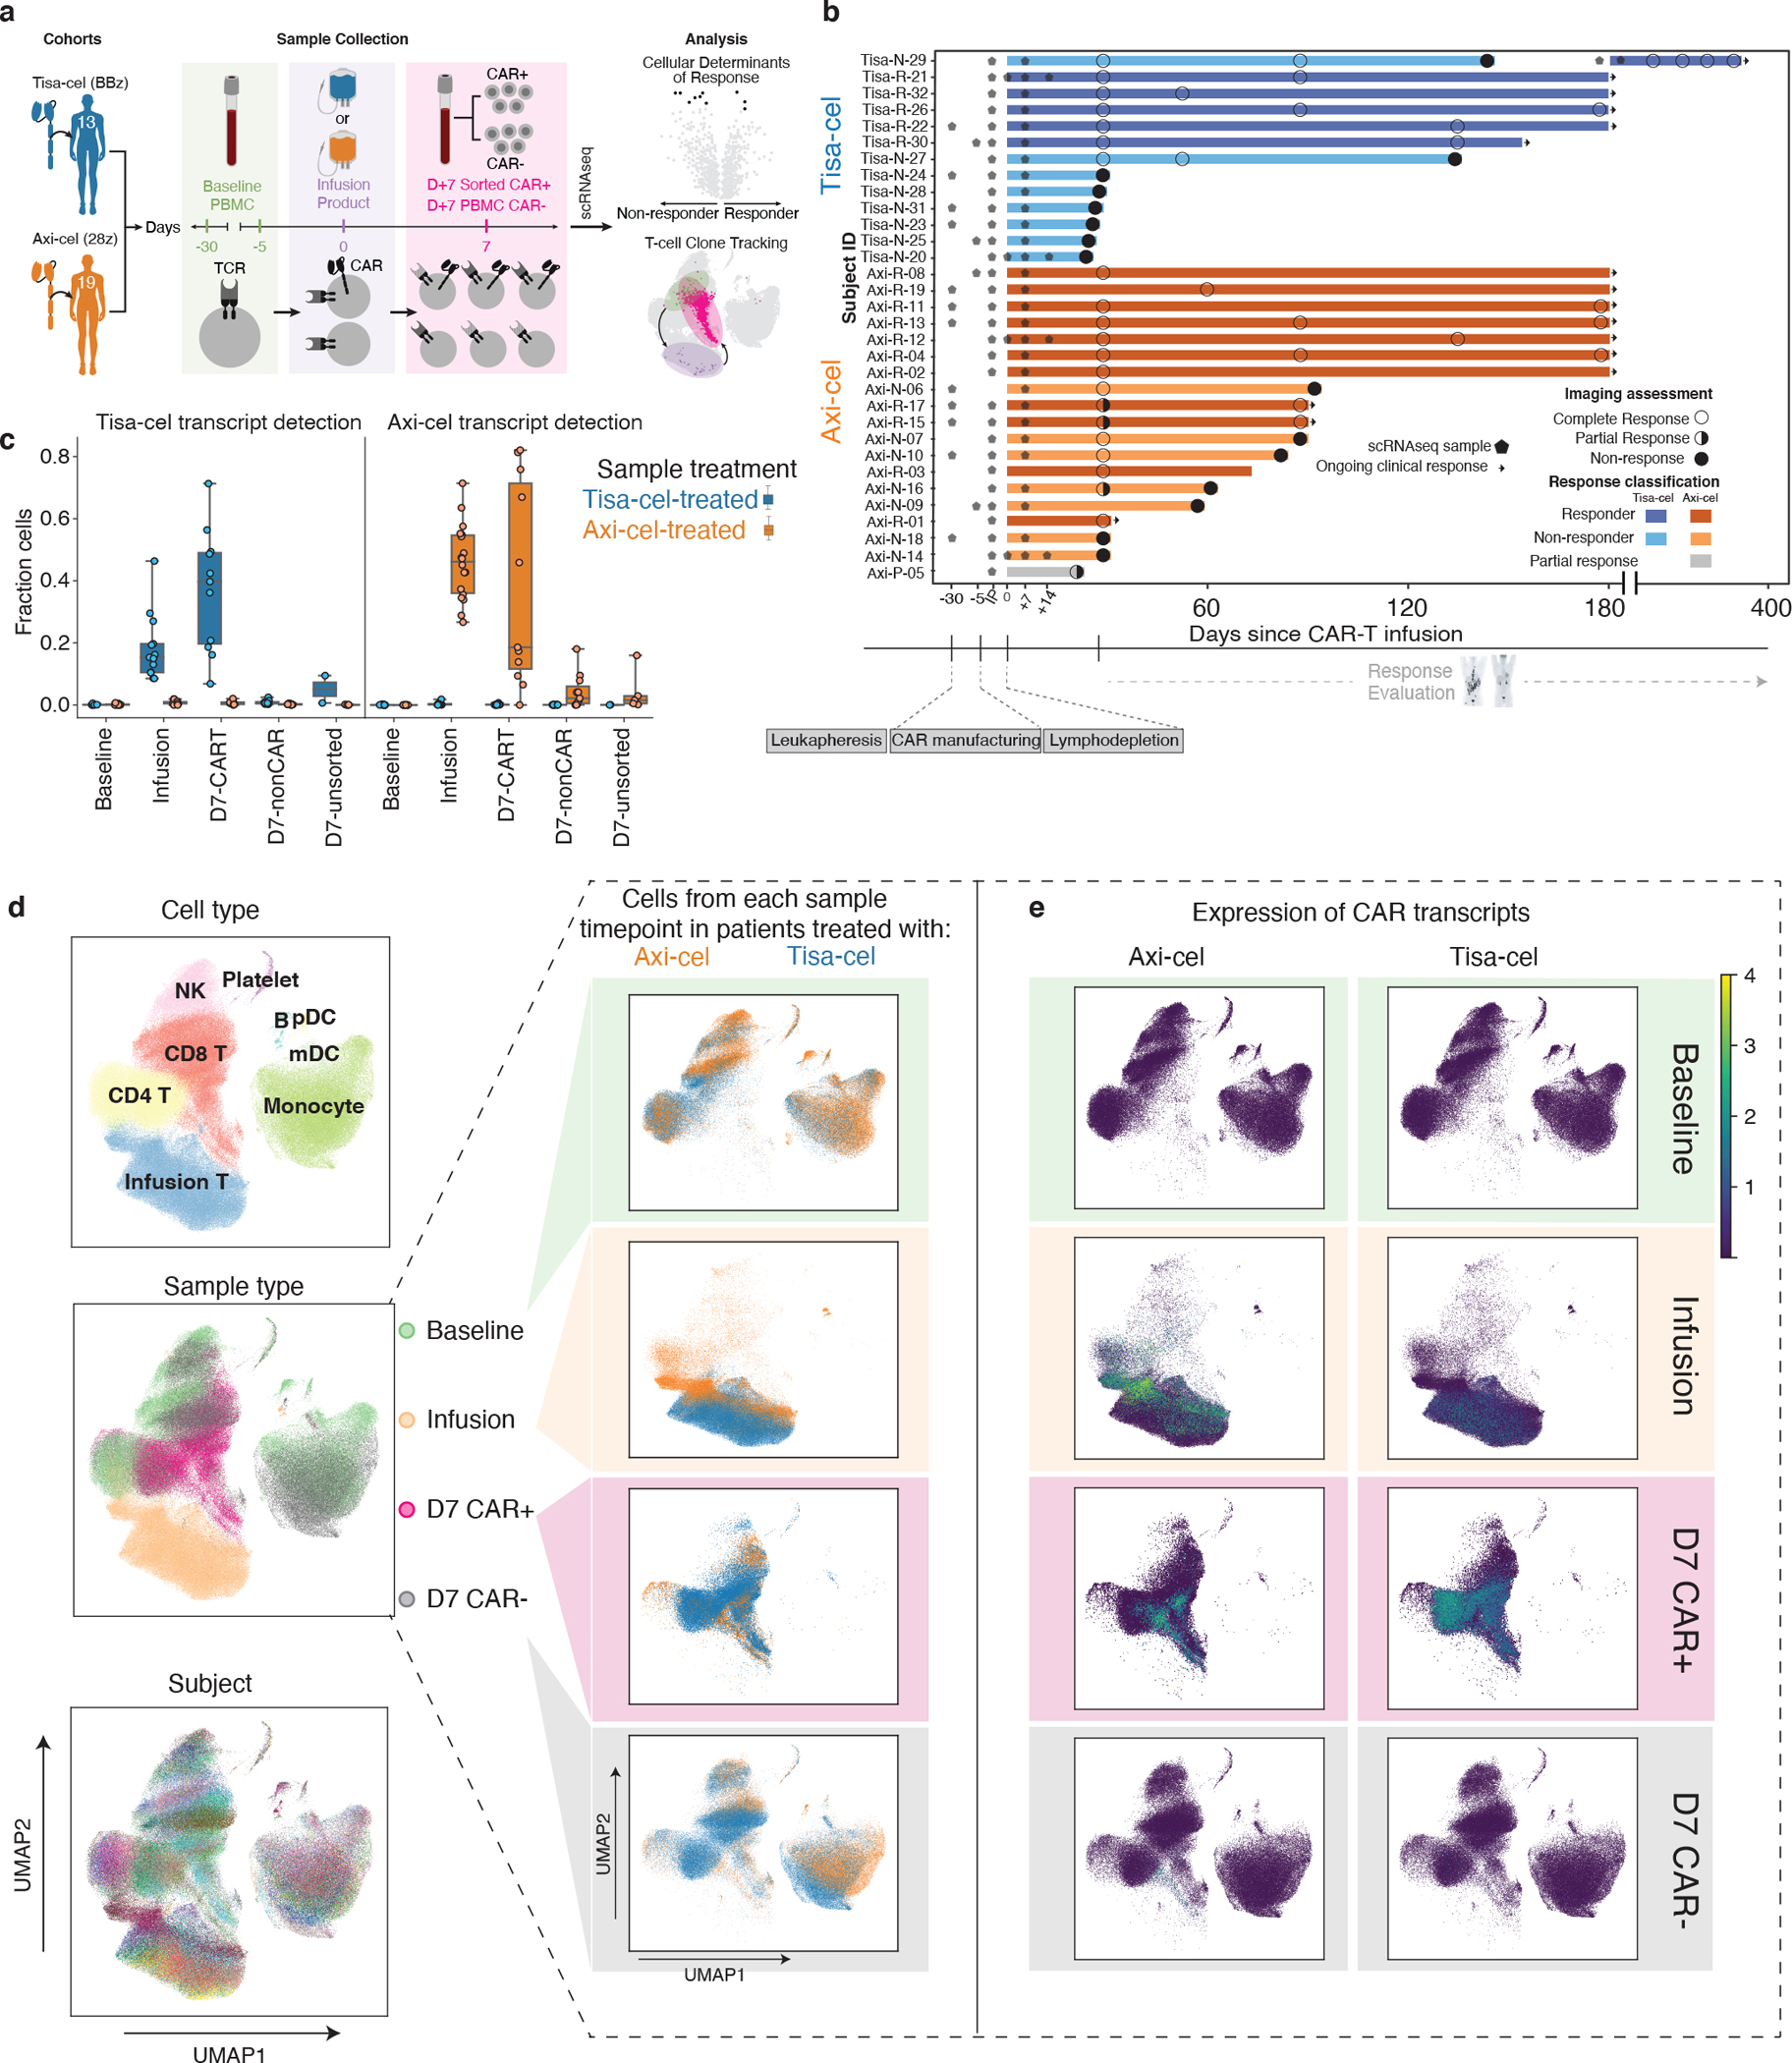
a, Illustration of study design. b, Swimmer plot of patient outcomes. Bars represent follow-up window (either by PET scan or physician report), circles represent outcome of PET scans, and arrows represent ongoing response. Stars designate timepoints at which samples were collected for scRNA-sequencing. n=32 patients are shown. c, Fraction of cells per sample with at least one detected tisa-cel or axi-cel transcript. Each circle represents a sample, and samples from patients with tisa-cel or axi-cel are stratified. n=20 baseline, n=31 infusion product, n=22 day 7 CAR-positive, n=22 day 7 CAR-negative, and n=7 day 7 unsorted biologically independent samples are shown. The timepoint and sorting strategy is denoted on the x-axis. Boxes show the median, interquartile range, and maximum/minimum values. d, UMAP representation of full dataset. On the left, colored by cell type, timepoint, and subject. On the right, cells from the same UMAP subset for each timepoint are colored by the CAR treatment (axi-cel orange, tisa-cel blue), and e, colored by the expression of each CAR construct detected in each cell.
Cells with an in-silico detected CAR transcript (Methods) were present at high numbers in the IPs and the sorted CAR+ day 7 samples, while they were only minimally detected in the sorted CAR-negative fractions and unsorted samples from day 7 post-treatment samples (Fig. 1c). In pre-treatment samples we only artifactually detected the CAR transcript in 73 of 131,000 cells (0.0006%).
Clustering of all cells in our dataset enabled the identification of diverse immune cell types present based on canonical markers (Fig. 1d, Extended Data Fig. 1b). Such analysis revealed day 7 non-CAR-T cells to intersperse with those from baseline, whereas day 7 CAR+ cells tended to cluster separately from the baseline and the day 7 CAR-negative cells, and IPs clustered independently (Fig. 1d, left, center plot). Most clusters, and in particular the non-T cell clusters, spanned the patients, indicating that there was less variability among patients than among types of cells (Fig. 1d left, bottom plot). We observed distinct clustering of the CAR+ cells originating from the IP cells, as well as the day 7 CAR-sorted samples (Fig. 1e). As expected, the IP samples and day 7 CAR+ samples primarily consisted of T cells, while baseline and day 7 CAR− samples contained other populations such as macrophages, myeloid, dendritic cells, and B cells (Fig. 1d, right). We did not detect major transcriptional differences among cells from patients treated with tisa-cel vs axi-cel at baseline (Fig. 1d). However, cells from the IPs and day 7 samples appeared to cluster by CAR construct and expression, suggesting potential CAR-driven differences in their phenotype (Fig. 1e).
Transcriptomic evolution of CAR-T cells from IP to day 7
To molecularly explore the observed separation between transduced CAR-T cells and untransduced T cells, we devised a pseudobulk differential expression approach, which has been shown to help avoid inflated test statistics associated with repeatedly measuring many cells from a comparatively small number of patients11. We performed in-silico sorting of cells of each sample into populations of interest (CD4/CD8, CAR/nonCAR) and then aggregated transcripts across all cells of a particular cell type to yield a sample x gene matrix of transcript counts as one might obtain from bulk sequencing (Fig. 2a, Extended Data Fig. 1c, Methods).
Figure 2. Pseudobulk analysis of genes related to treatment, timepoint, and response.
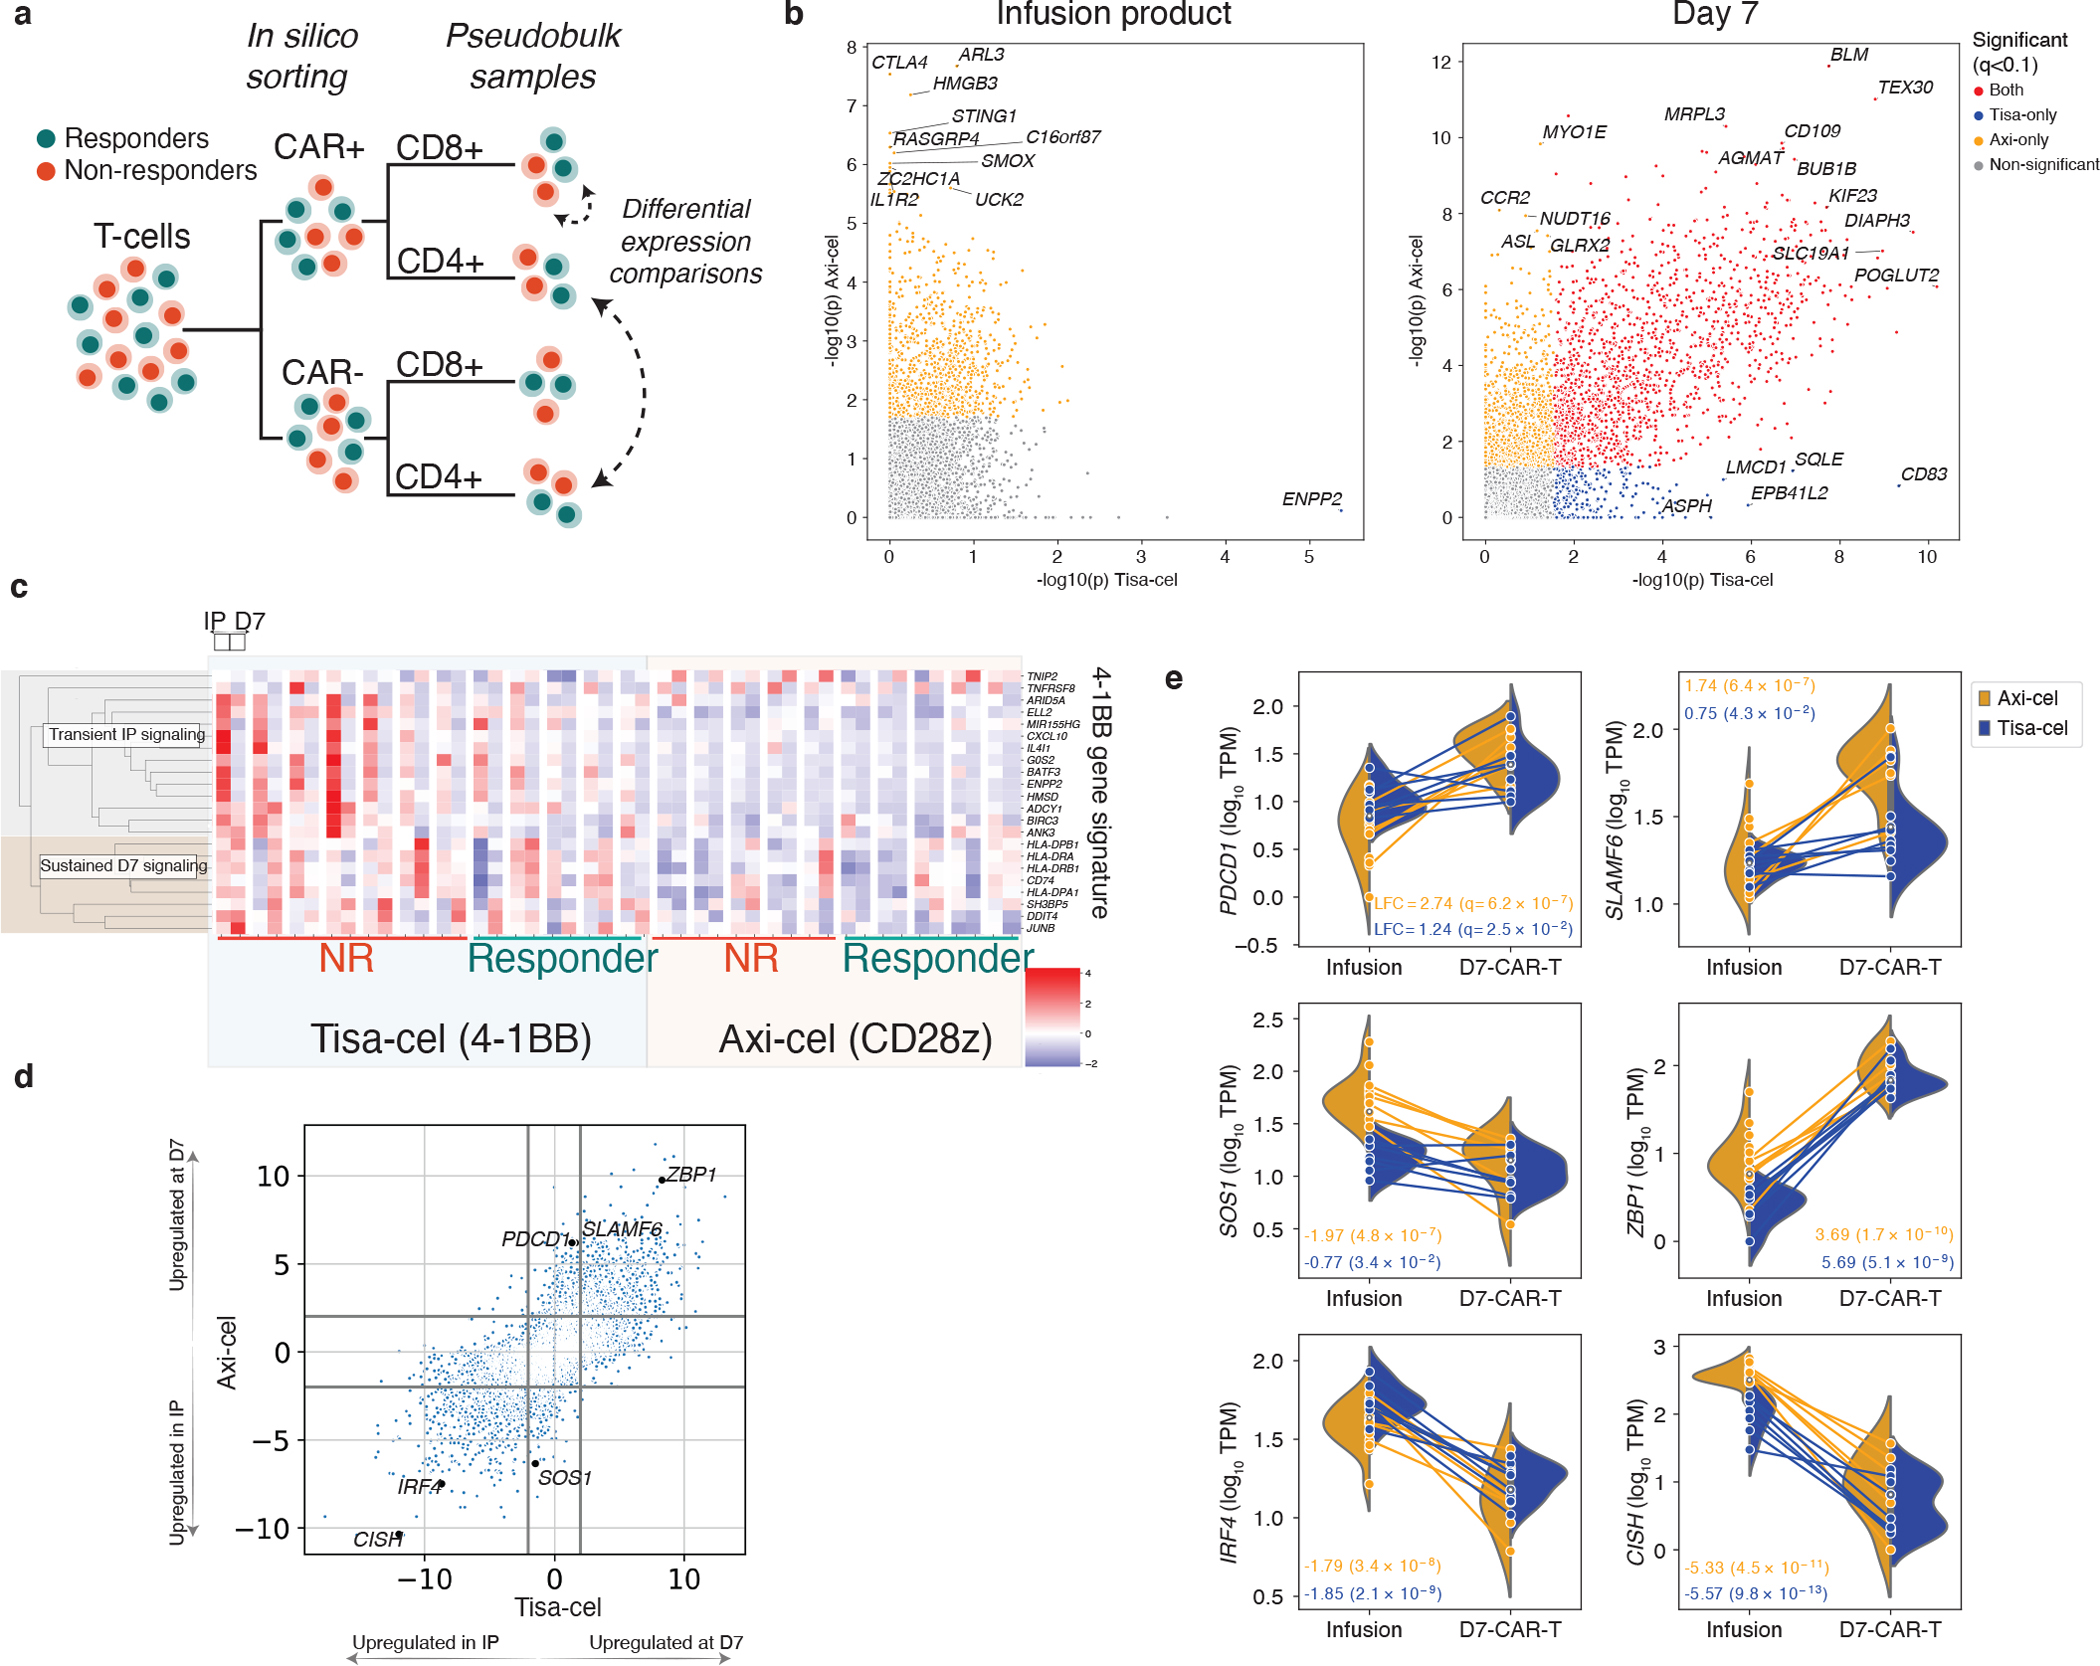
a, Schematic of pseudobulk approach. T-cells from IP and day 7 samples are in-silico sorted for CAR+ and CAR- cells, and when stated CD4 and CD8. Transcript counts are then combined across these cells into one pseudobulk observation. Different conditions are then compared using limma48. b, Scatterplot of two-tailed -log10 p-values derived from moderated t-statistics calculated by the limma package testing differential expression between CAR+ and CAR- (not separating CD4 and CD8) pseudobulk samples from the IP (left, n=13 and n=18 for tisa-cel and axi-cel, respectively) and day 7 PBMCs (right, n=13 and n=15) for each product. Genes with Benjamini-Hochberg corrected p-values of q<.1 are colored (plotted values are uncorrected). c, Expression of previously identified signature of 4–1BB CAR activation across timepoints and patients. d, Comparison of genes differentially expressed between CD8+ cells in the infusion products (n=7 and n=15 for tisa-cel and axi-cel, respectively) and at day 7 (n=10 and n=7 for tisa-cel and axi-cel). The scatter plot shows the signed log10 p-values obtained from limma testing differences between IP and day 7 samples for tisa-cel (x-axis) and axi-cel (y-axis). Positive values indicate higher expression at day 7, and negative values higher in the IP. e, Illustration of several highlighted genes in panel d. Lines represent the changes in expression of the gene between infusion product and day 7 in CD8+ CAR-T cells of a single sample. Samples are colored by treatment, and split violins represent the distribution of expression across patients of each treatment at a given timepoint. Only samples with ≥25 cells are shown, including n=22 infusion product and n=17 day 7 CAR-positive biologically independent samples. Boxes show the interquartile range.
At day 7, we found 463 genes to be elevated (FDR<10%, >2-fold increase in CAR+ cells relative to CAR-) in both types of CAR-transduced T cells (Supplementary Table 3), including genes were related to cellular proliferation (DIAPH3, BUB1B, KIF23, q<10−5 for both products) and activation (e.g., CD109 with log2 fold-change (LFC)=1.3, q=2.1×10⁻⁷ and LFC=2.4, q=1.0×10⁻⁷ for tisa- and axi-cel, respectively). Additional genes were found in product-specific analyses, such as increased expression of CTLA4 in axi-cel IPs (LFC=2.3, q=5.0×10⁻⁵, Fig. 2b).
Our analysis of tisa-cel IPs yielded just one significant hit (q< 0.1), likely due to power limitations from the lower CAR transcript detection rate compared to axi-cel (Fig. 1c, Fig. 2b): ENPP2 (LFC=1.09, q=0.02), which is associated with a 4–1BB signature12. Indeed we found genes of this signature to be recurrently upregulated in tisa-cel IPs over axi-cel (Fig. 2c). We observed a subset of these genes maintained expression at day 7 (genes in the MHC II pathway), while others (such as the transcription factor-encoding BATF3) were transiently expressed in the IP but downregulated post-transfusion.
To further map out these temporal transcriptional changes, we calculated differentially expressed genes between IP and day 7 for each product separately (Fig. 2d, Supplementary Table 4). Some of the upregulated genes found exclusively in one product reflected known differences between CD28 and 4–1BB signaling in tisa-cel and axi-cel. Consistent with rapid activation associated with CD28 signaling, CD8+ axi-cel cells showed stronger upregulation of activation marker PDCD113–15 (PD-1, LFC=2.74 day 7 relative to IP, q=6.2×10⁻⁷) and checkpoint regulator SLAMF6 (Fig. 2e, LFC=1.74, q=6.4×10⁻⁷), perhaps suggestive of an early exhaustion signature in this rapidly expanding product16. We also observed upregulation of SOS1 in the IP of axi-cel, which is associated with CAR proliferation17 (LFC=−1.97, q=4.8×10⁻⁷).
We identified 1442 differentially expressed genes shared between the products (708 upregulated and 734 downregulated by at least 2-fold in day 7 samples compared to IP with q<0.1). This included ZBP1 (tisa-cel LFC=5.7 and q=5.1×10⁻⁹, and axi-cel LFC=3.7 and q=1.7×10⁻¹⁰) which plays an important role in mediating necroptosis in response to interferon-exposed cells18, suggestive of potential upregulation of activation-induced cell death pathways in both products at this timepoint. ZBP1-deficient mice resist systemic inflammation driven by elevations in IFNg signaling, suggesting a potential pathway for regulation of CAR toxicity18,19. Genes lowered in expression at day 7 included: (i) IRF4 (tisa-cel LFC=−1.8, q=2.0×10⁻⁹, and axi-cel LFC=−1.8, q=3.4×10⁻⁸) implicated in prevention of exhaustion in the CAR-T cells of in vivo cancer models20; and (ii) CISH (tisa-cel LFC=−5.6, q=9.8×10⁻¹³,and axi-cel LFC=−5.3, q=4.5×10⁻¹¹) which has been identified as encoding a critical T-cell immune checkpoint, the ablation of which results in enhanced T-cell function mediated through the TCR21.
Associations of cell subsets with clinical response
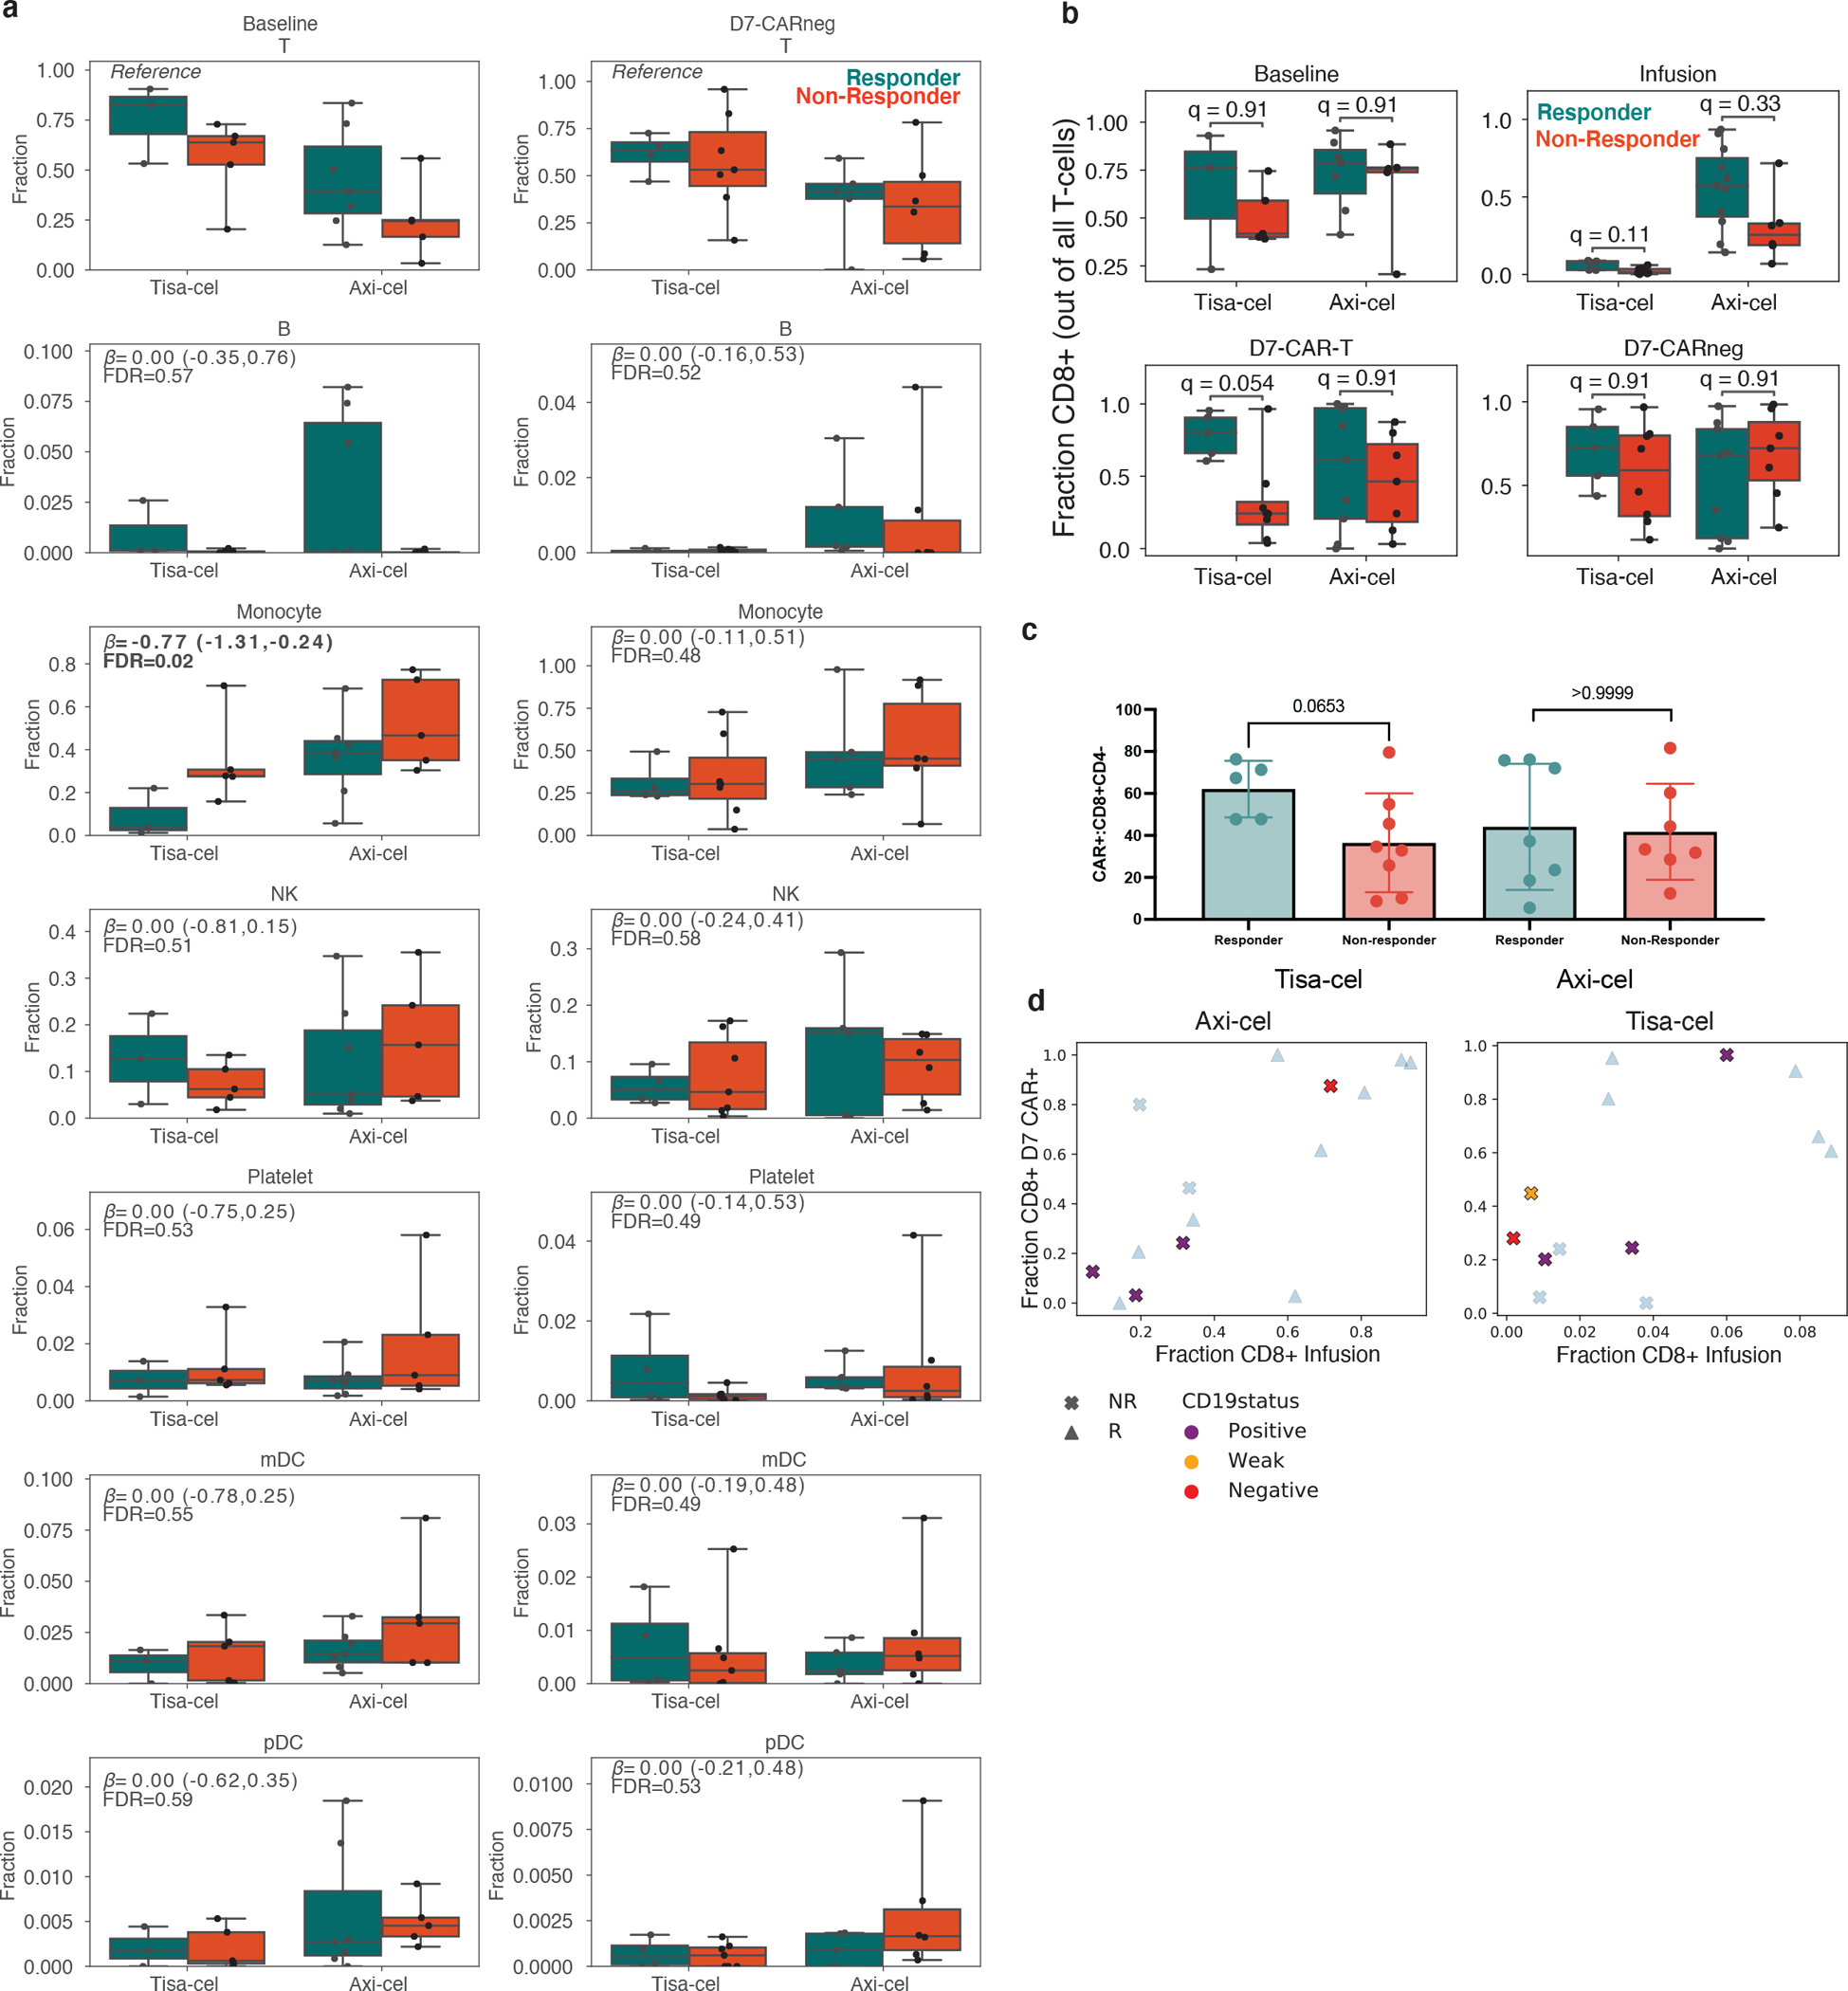
We next queried our dataset for cell types with frequencies associated with clinical response, defined by whether progressive disease was observed by PET within six months of follow-up (Methods). Among the CAR-negative PBMCs, we used the method scCODA22 to test whether any non-T-cell populations changed in frequency relative to the number of T-cells. We included as covariates treatment product and, for baseline analyses, the timepoint of sampling (days 0, −5, or −30), as we observed that T-cell fractions were higher in day 0 samples (Extended Data Fig. 1d). Other factors such as baseline tumor volume were not observed to associate (Extended Data Fig. 1e). We identified monocytes as more abundant in non-responders at baseline for both products (FDR=0.02, estimated log2 fold-change of 0.77 with a 95% high density interval of [0.24,1.31] between non-responders and responders, Extended Data Fig. 2a), in agreement with previously described results23. This effect was not observed at day 7, nor were any other non-T cell populations found to be significantly altered.
Assessing whether the relative fractions of CD4+ and CD8+ subsets were associated with response, we found in patients treated with tisa-cel, but not axi-cel, response was associated with the extent to which day 7 CAR+ cells were predominantly (>50%) of CD8+ subtype (Fig. 3a, Extended Data Fig. 2b,c; likelihood ratio test p=0.02 and p=0.51 for tisa-cel and axi-cel, respectively). 5/7 tisa-cel treated patients with lower proportion (<50%) of CD8+ CAR+ T cells at day 7 exhibited progressive disease by day 30, and the remaining two relapsed six months following treatment. In contrast, only 1/6 patients (Tisa-N-31) with >50% CD8+ CAR-T cells at day 7 exhibited progressive disease. The percentage of CD8+ cells in tisa-cel IPs was low in both responders and non-responders, but had a modest association with 6-month response (Extended Data Fig. 2b; q=0.11).
Figure 3. Temporal evolution of T cells in responders and non-responders of different products.
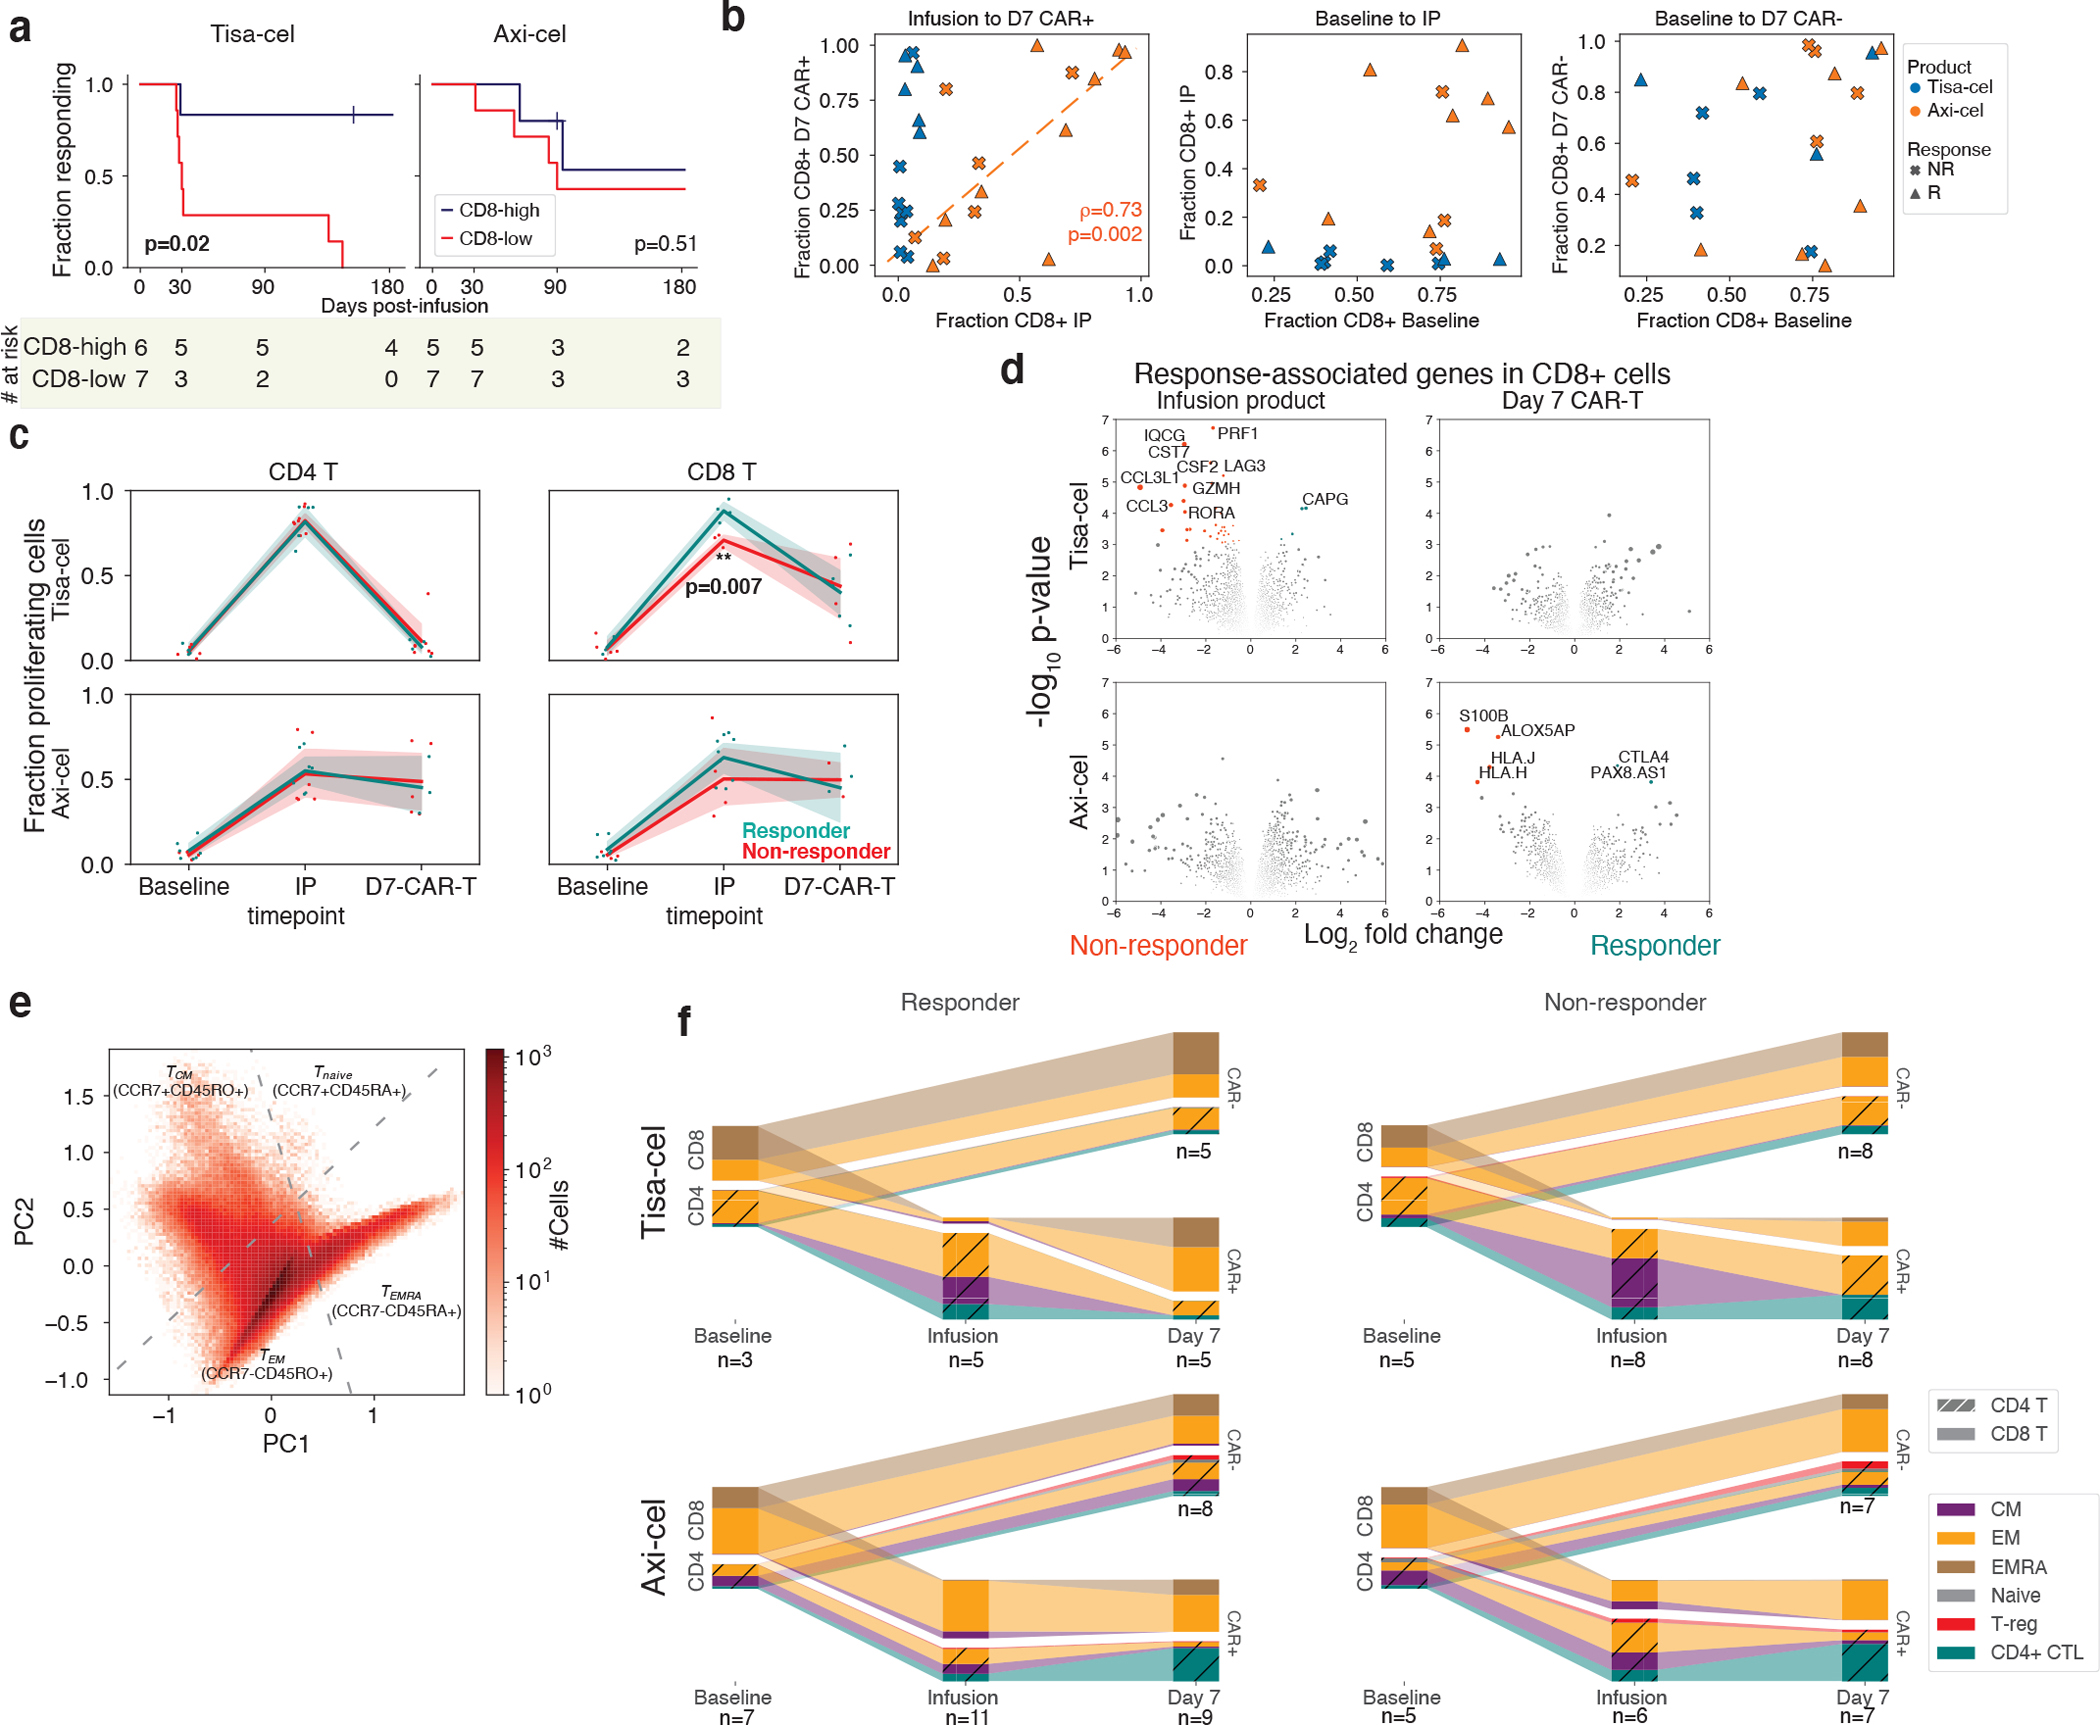
a, Kaplan-meier response curves stratified by whether patients had >50% CD8 CAR-T cells (out of all CAR-T cells) at day 7. P-values testing the significance of this stratification using a cox proportional-hazards model are shown. b, Changes in CD8 frequency between different timepoints for CAR- and CAR+ cells. c, Fraction of cycling cells at different timepoints for different CD4/8 designations, treatments, and response outcomes. A two-tailed t-test is shown for tisa-cel CD8+ IPs comparing responders and non-responders (p=0.007, t-statistic=−4.3, n=4 and n=3 for R and NR). Individual samples are shown as dots, and a line is drawn showing the mean of each timepoint, with an error band showing a 95% confidence interval derived from bootstrapping 1000 iterations. d, Volcano plots of differentially expressed genes in CD8+ CAR-T cells between responders and non-responders for each product and timepoint. P-values are calculated with the limma package two-tailed test of moderated t-statistics. All genes with Benjamini-Hochberg FDR-corrected p-values q<0.25 are colored and labeled (plotted values are uncorrected). The area of each dot is the absolute value of the log2 fold change times the negative log10 p-value. e, PCA dimensionality reduction using knn-smoothed expression of T differentiation markers (CD45RO, CD45RA, and CCR7) visualizing the classification of T cell subtypes. Dotted lines represent where the cutoffs used to define CCR7+ and CD45RA+ (smoothed expression values >0.5) fall in the projection. f, Depiction of T subset frequencies at each timepoint for each product and response. Bar widths at each timepoint are proportional to the fraction of cells (out of all calls) being classified as a particular subset. CD4 and CD8 cells are stratified, and distinguished with cross-hatching for CD4 subsets.
The temporal dynamics of these CD8 fractions from IP to day 7 were strikingly different between the two treatments. In axi-cel, the fraction of day 7 CAR+ T cells that were CD8+ was highly variable, and this value was highly correlated with the percentage of CD8+ cells in the IP (Fig. 3b, left spearman ρ=0.73, p=0.002). Tisa-cel IPs, however, were universally composed of <10% CD8+ cells, but these CD8+ cells dramatically expanded at day 7, particularly in the patients exhibiting long-term response (Fig. 3b, left). The reduced expansion in non-responders was seen for patients with CD19 positive and negative relapse alike (Extended Data Fig. 2d). Baseline fractions of CD8+ cells were found to be predictive of neither those observed in the circulating CAR-negative T cell populations nor in the IPs (Fig. 3b, center and right, respectively).
Response-associated expansion of CD8+ cells in tisa-cel
To explore whether these changing CD4/ CD8 frequencies could be explained by different proliferative dynamics, we scored our cells for cell cycle gene sets24, and calculated the fraction of cycling CAR-T cells at each timepoint. A higher fraction of cells at a single timepoint in the S and G2/M phases is suggestive that as a whole, cells in the population are moving faster through G0/G125, which is the main determinant of proliferation rate. Tisa-cel CD4+ CAR-T cells exhibited fractions of cycling cells comparable with CD8+ cells in the IP but essentially no CD4+ cells were dividing at day 7 (Fig. 3c), explaining the outgrowth of CD8+ cells. Responders had higher fractions proliferating CD8+ cells in their IPs (two-tailed t-test p=0.007), likely underlying the greater expansion seen at day 7. Meanwhile, axi-cel CD4+ CAR-T cells exhibited similar proliferation rates to CD8+ cells both in the IP and at day 7, consistent with them maintaining similar ratios across timepoints.
By testing for genes associated with response in our pseudobulk framework, we found that the majority of differentially expressed genes (14/17 genes with FDR<10%) were in the CD8+ cells of tisa-cel IPs (Fig. 3d, Supplementary Table 5). Non-responders showed an activated cytotoxic phenotype, with upregulation of genes such as PRF1 (perforin), GZMH, and LAG3. Thus, further differentiation of these cells provides a possible explanation for the lower proliferation and failure of expansion in non-responders. We did not observe differential expression when studying CD8+ axi-cel IPs. Prior work10 studying axi-cel IPs had proposed dysfunctional and memory genes characteristic of non-responders and responders respectively, but examining these genes in our data did not yield a significant separation of patients by response (Extended Data Fig. 3).
To better characterize the differentiation states of these cells, we developed an Expectation-Maximization-based method to estimate CD45RA and CD45RO isoform expression from 5’ scRNA data (Extended Data Fig. 4a,b, Methods). We found in published PBMC datasets with additional feature-barcoding of CD45 isoforms that our RNA-based measurements of these isoforms were highly concordant to the surface protein measurements (Extended Data Fig. 4c), and could be used to define T-cell subsets similar to those from the protein-derived data (Extended Data Fig. 4d–f). We used smoothed expression of these and other common T-cell subset markers (Methods, Supplementary Table 6) to classify the cells into naive (CCR7+CD45RA+), central memory (CM, CCR7+CD45RO+), effector memory (EM, CCR7−CD45RO+), terminally differentiated effector memory re-expressing CD45RA (EMRA, CCR7−CD45RA+), and regulatory T-cells (FOXP3+) (Fig. 3e, Extended Data Fig. 4g, Extended Data Fig. 5a–d). We further distinguished CD4+ cytotoxic cells (CD4+ CTLs, NKG7+), prevalent in our dataset, from other EMs with a more typical helper phenotype (Extended Data Fig. 5b,d).
Tisa-cel IPs were composed primarily of CD4+ cells with a mix of CM and EM phenotypes, with a modest elevation of CMs in non-responders compared to responders (Fig. 3f; median of 24% and 56% cells for responders and non-responders, respectively; two-sided t-test p=0.084). We observed very few cells classified as Naive in either product (Fig. 3f, Extended Data Fig. 4g), in contrast to the median of 13.9% seen in the pivotal axi-cel trial26, though consistent with other studies of these products27,28. Due to the stimulation of IP cells during the course of manufacturing, CD45RA expression may be modulated to an extent that would affect the classification of cells as CM or Naive, particularly when comparing protein-based to our RNA-based methods.
At day 7, CMs were largely replaced by EMs for both products, including CD4+ CTLs in 3 of 8 of the non-responding tisa-cel-treated patients (and seen in 0 of 5 of responders). The previously noted post-treatment expansion of CD8+ cells in tisa-cel took on a primarily CCR7−CD45RO+ EM phenotype regardless of response. We observed cells beginning to re-express CD45RA (EMRA) in several patients (Extended Data Fig. 5e), although other markers of terminal differentiation were not seen to be elevated (Extended Data Fig. 5f), suggesting they may retain functions similar to EMs. In axi-cel-treated patients, an expansion of CD4+ CTLs was also seen following treatment (median of 9.2% and 30% of cells in IP and day 7 CAR-T populations respectively, t-test p=0.0032) in responders and non-responders alike. CAR-negative cells in patients treated with either treatment were a mix of EM and EMRA phenotypes which remained unchanged in frequency from baseline to post-treatment (Fig. 3f). T-cell subset frequencies at baseline were heterogeneous across patients and mostly not associated with tumor burden or timepoint, with the exception of a depletion of TEMRA cells at day 0 (Extended Data Fig. 1f,g, FDR-corrected ranksum q=0.02).
To further dissect these populations in an unsupervised manner, we performed clustering of IP and day 7 CAR-T cells for each treatment and clinical outcome (Fig. 4a, Extended Data Fig. 6a). CD8+ tisa-cel IP cells demonstrated a considerable shift in their distribution across the identified clusters when comparing responders and non-responders (Fig. 4b, Methods, log likelihood ratio 20.3, BH-corrected q=0.060). Tisa-cel responders had more cells from the cluster expressing CM markers CCR7 and LEF1 (two-tailed t-test p=0.0057, Fig. 4c,d), and expressed the transcription factor STAT1. Non-responders had higher frequencies of cells in cluster EM 1 (two-tailed t-test p=0.0062) with markers similar to those observed in our pseudobulk analysis: interferon gamma (IFNG), cytotoxicity (PRF1), and markers of activation/exhaustion LAG3 and HAVCR2 (TIM-3) (Fig. 4c,d). While overall a shift in the subtypes of CD8+ tisa-cel CAR-Ts at day 7 was not observed (log likelihood ratio 0.34, q=0.98), we found that the only non-responder that had >50% CD8+ cells out of their CAR-T cells post-treatment (Tisa-N-31) had a distinct phenotype from the responders in our dataset (Fig. 4e,f). Their cells were distinguished by high expression of KLRG1 and lack of L-selectin (SELL), a phenotype attributed to short-lived effector cells (SLECs)29. Thus these CD8+ cells may not have had the correct phenotype to induce an effective response. This patient had a CD19 positive relapse (Supplementary Table 1), ruling out antigen loss as a potential explanation. The cells of most responders fell into an IL7R+ EM 1 cluster, with the exception of one patient (Tisa-R-22) with a unique CX3CR1+CD27+ phenotype (Fig. 4e, Extended Data Fig. 6b, cluster EM 2).
Figure 4. Tracking temporal evolution of CAR-T clones by TCR sequencing.
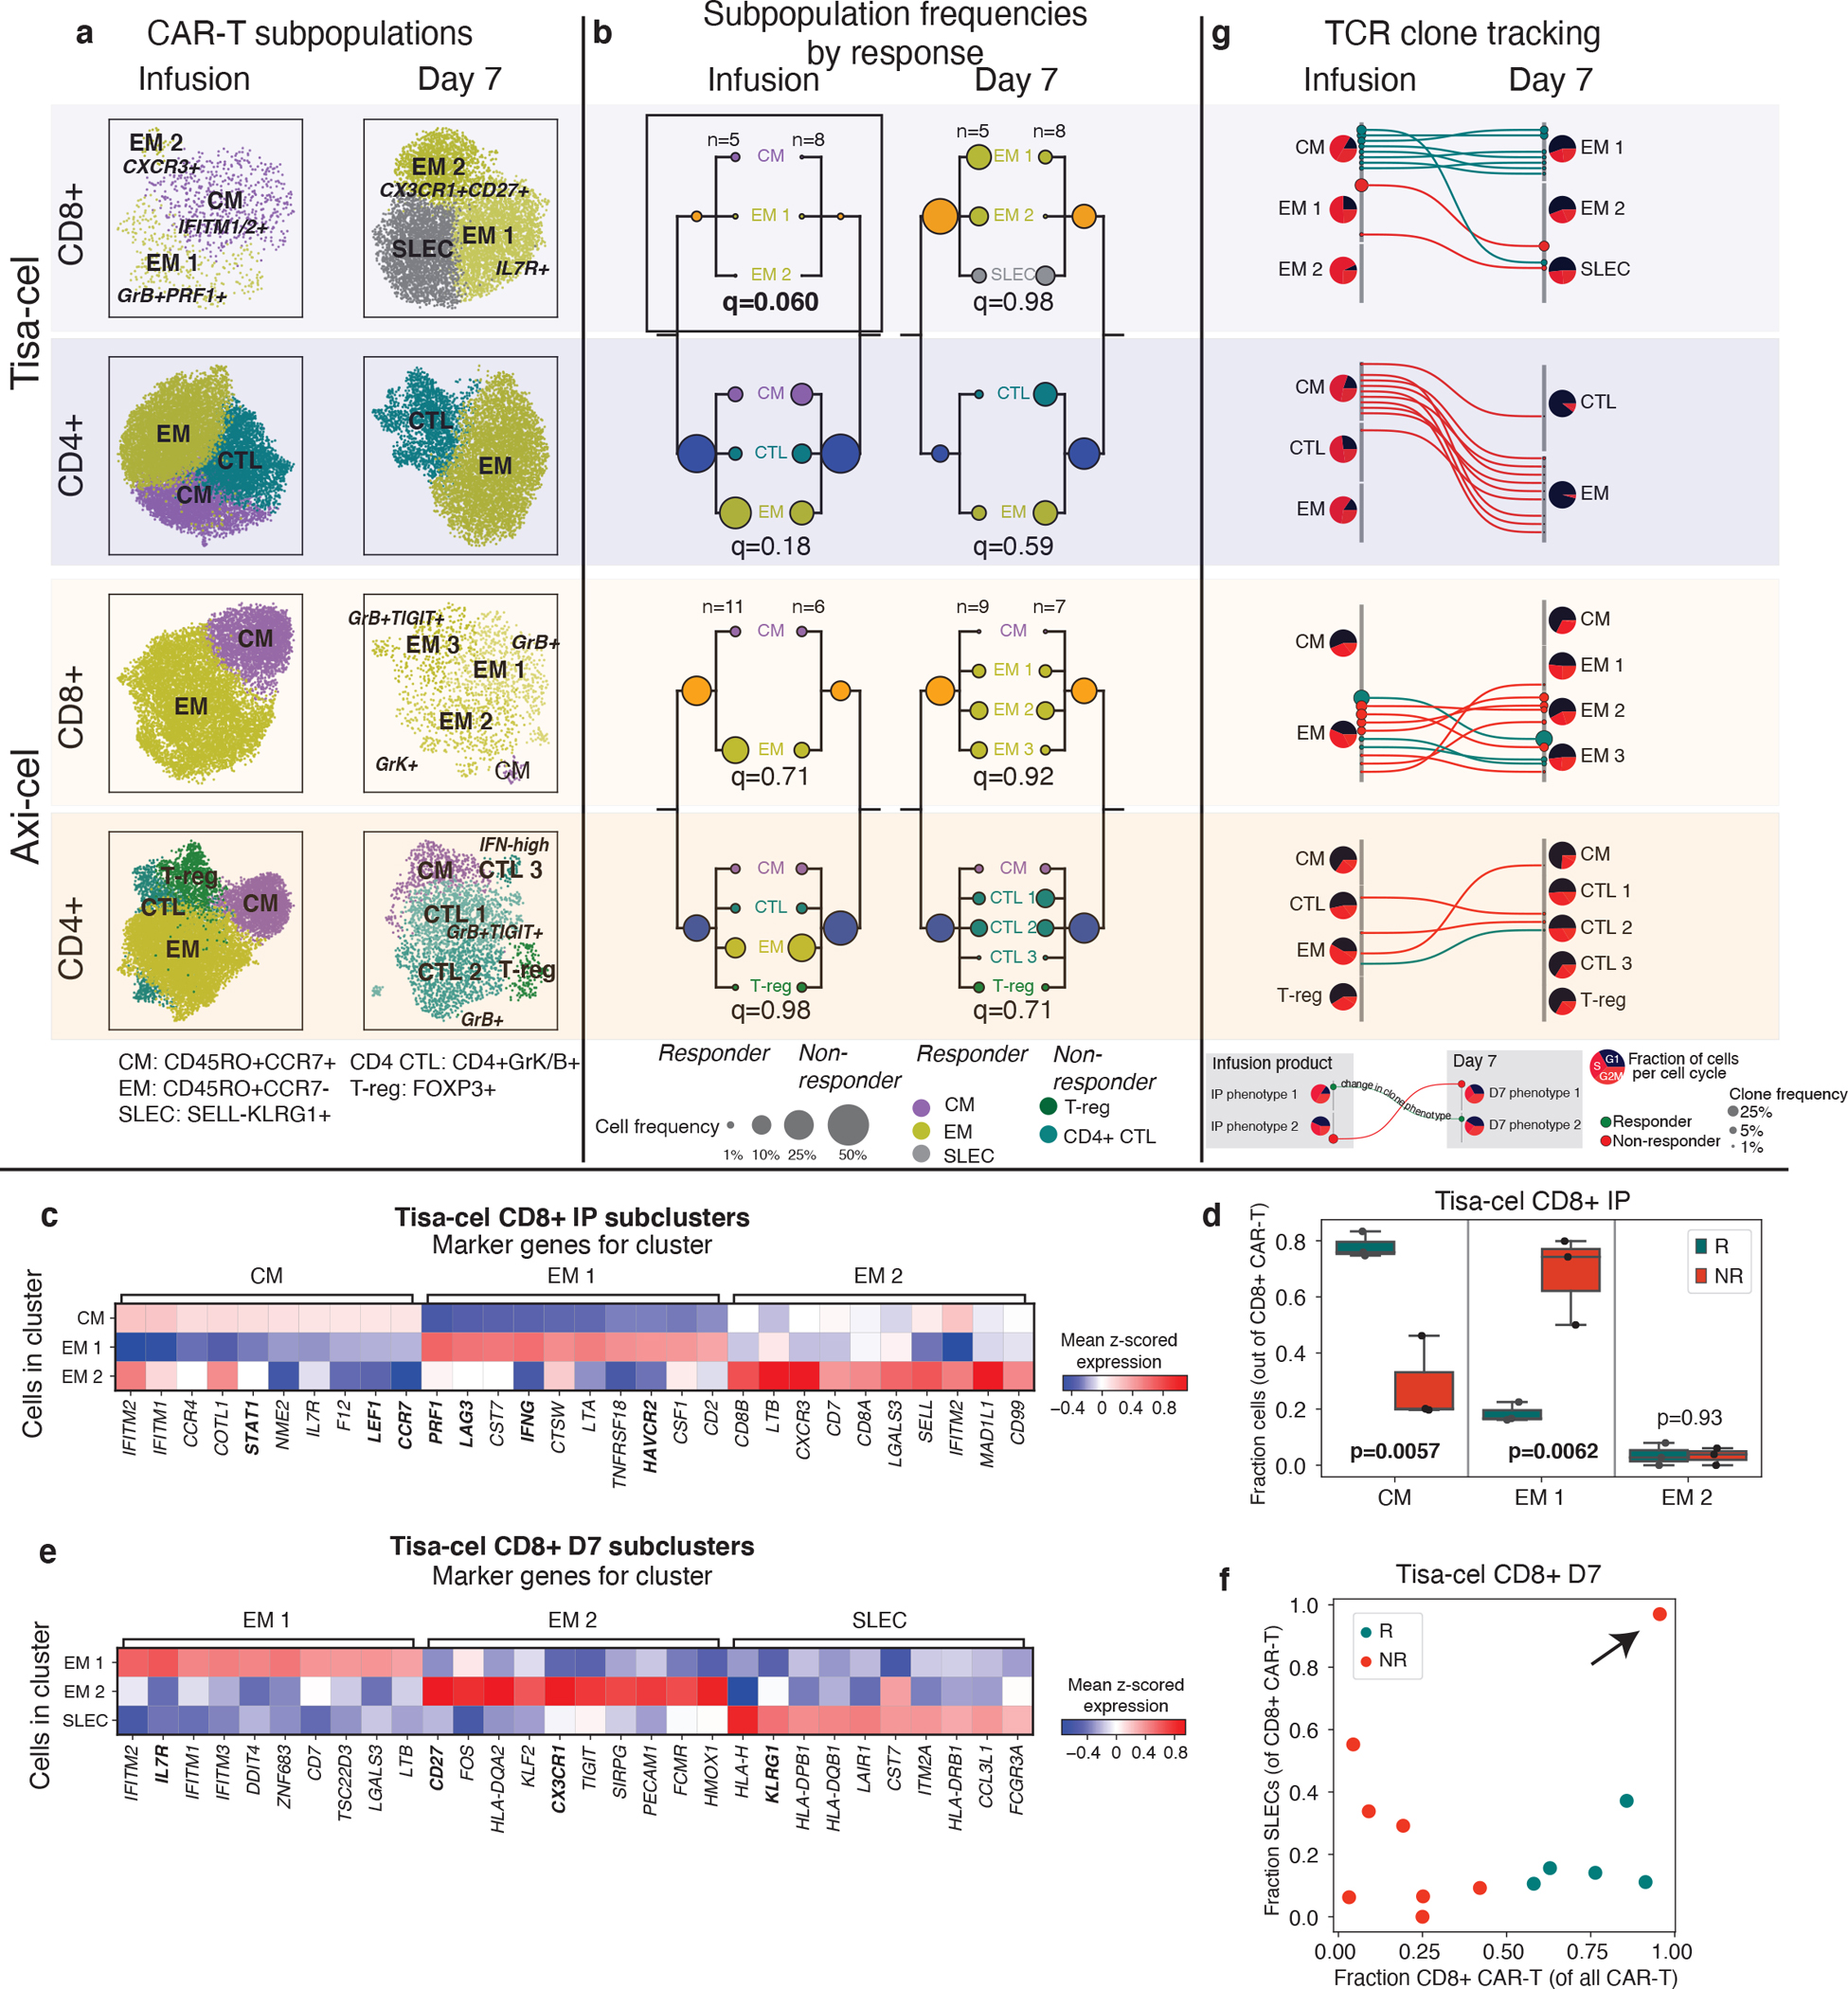
a, u-map plots of CAR-T cells of different treatments and at different timepoints colored by subcluster. b, Frequencies of CAR-T subclusters. Circle area represents the estimated median percentage of cells belonging to the cluster (out of all CAR-T cells) in patients treated with each product and with each response outcome. c, Top 10 differentially expressed genes in each tisa-cel CD8+ IP subcluster, as identified by a t-test. d, Relative frequencies of each tisa-cel CD8+ IP cluster stratified by response. Only samples with at least 25 CD8+ CAR-T cells are shown. e, Top differentially expressed genes in each tisa-cel CD8+ day 7 subcluster, as identified by a two-tailed t-test. Biologically independent samples from n=3 responders and n=3 non-responders are shown. Boxes show the median, interquartile range, and maximum/minimum values. f, Scatter plot of the fraction of CD8+ tisa-cel day 7 cells in each patient that fell into the SLEC cluster (y-axis) vs the overall fraction of CAR-T cells that were CD8+ (x-axis). Arrow highlights the sole non-responder to have predominantly CD8+ cells are day 7. g, Up to 15 of the most prevalent TCR clones identified at both time points are shown for each CAR-T subset. For each, circles show the cluster in Figure 3D to which the clone belongs at each timepoint, with sizes corresponding to the clone frequency in its sample. Pie charts show the distribution of cells in each phase of the cell cycle.
We next used our TCR enrichment libraries to track the temporal evolution of the CAR-T phenotypes. In all tisa-cel responders (and several non-responders), the top CD8+ TCR clones in the IP were found to be increased in frequency at day 7 (Extended Data Fig. 6c). In responders the cluster membership of these clones showed that they primarily originated from CMs in the IP and differentiated into IL7R+ EMs at day 7 (Fig. 4g). Meanwhile clones with a SLEC phenotype at day 7 were inferred to have differentiated from the non-response-associated GZMB+PRF1+ EM population. Axi-cel again showed starkly different dynamics, where CM phenotype cells in the IPs exhibited fewer cells in the cell cycle than other IP subsets, and were not observed to be the primary origin of the CAR-T cells present at day 7 (Fig. 4g), suggesting a less predominant role, at least initially, of these cells compared to tisa-cel.
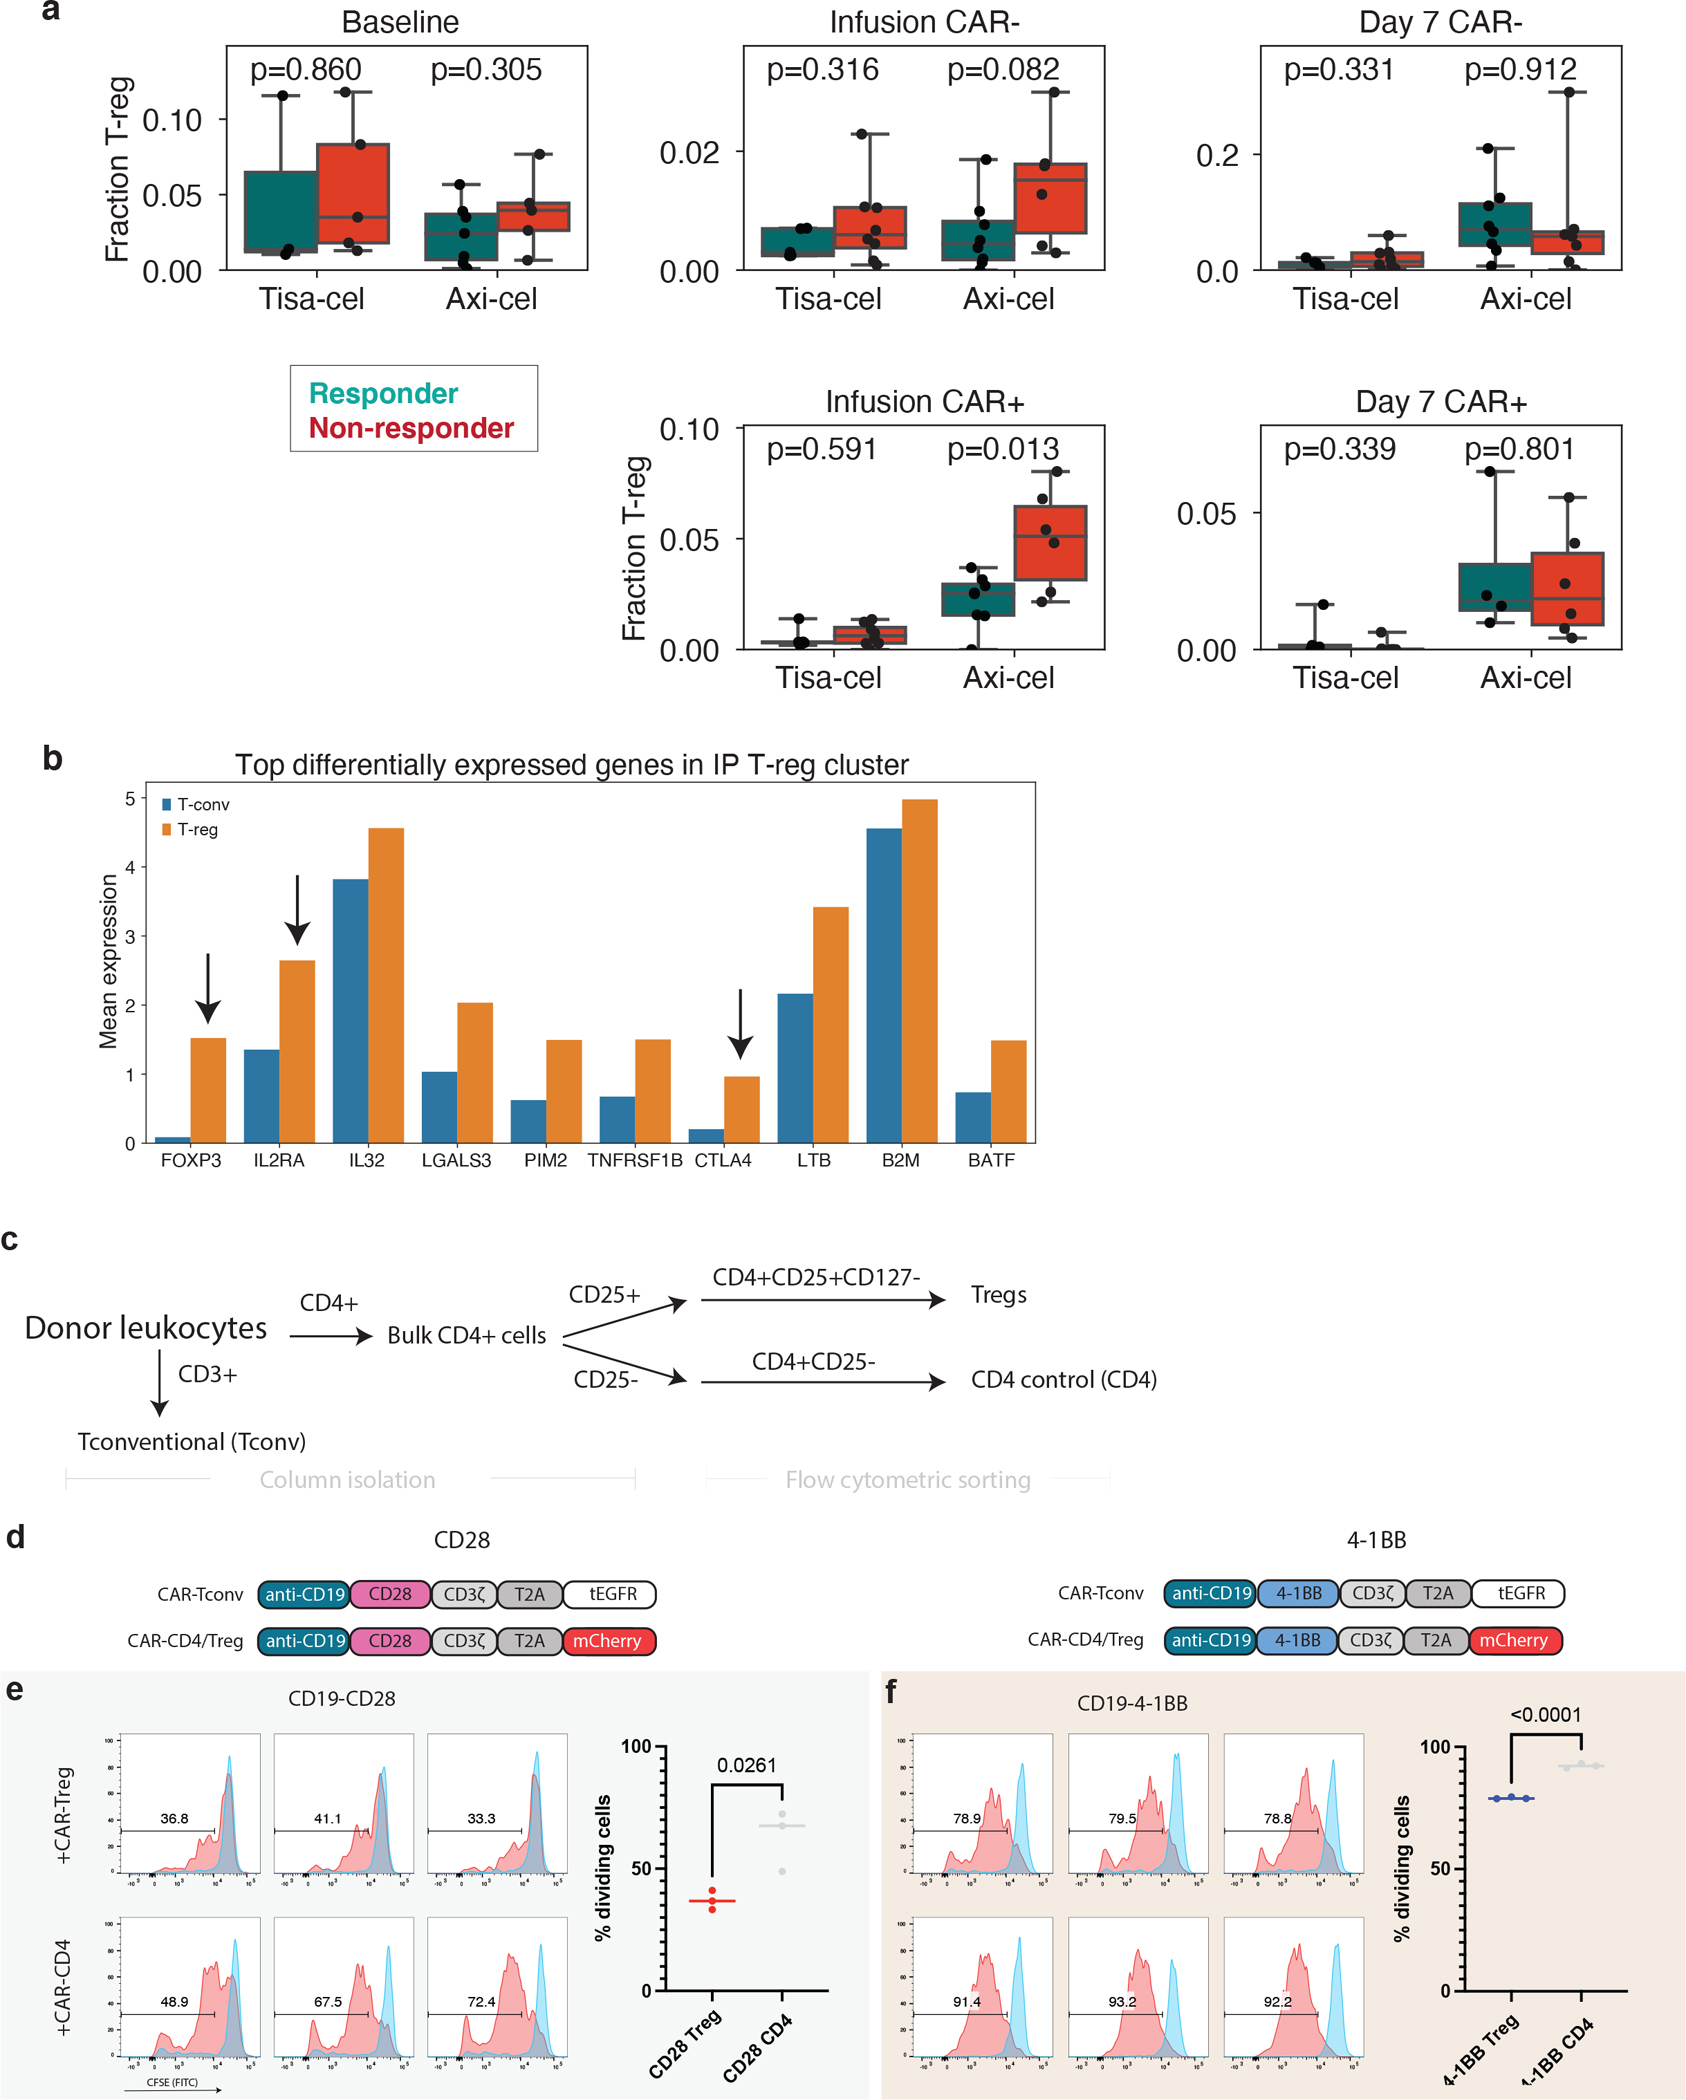
Finally, we identified a population of regulatory T cells with CAR transcripts present (CAR-Tregs) in the IPs, a rare subset of CD4+ circulating lymphocytes that play a critical role in preventing autoimmunity30 but facilitate an immunosuppressive tumor microenvironment in a variety of tumor types, including aggressive lymphomas31–35. However, CAR-Tregs have not yet been shown to play a role in clinical relapse after CAR T cell treatment. Analyzing tisa-cel and axi-cel IPs together with batch correction for inter-product differences, we found CAR-Tregs were significantly rarer in tisa-cel IPs than in axi-cel (Fig. 5a, median 0.3% of all CAR+ cells in tisa-cel vs. 2.7% in axi-cel, two-tailed t-test p=1.3×10⁻⁴). Frequencies of T-regs at baseline were comparable between patients treated with the two products (Extended Data Fig. 7a, median of 3.1% and 2.6% of axi-cel and tisa-cel respectively, t-test p=0.21), suggesting this is not due to pre-existing differences in the patient populations. We also observed other classic markers of T-regs among the top differentially expressed genes including IL2RA (CD25) and CTLA4 (Extended Data Fig. 7b), providing additional evidence these are genuine T-regs.
Figure 5. Mediation of relapse by CAR-Tregs in patients and in vivo validation experiments.
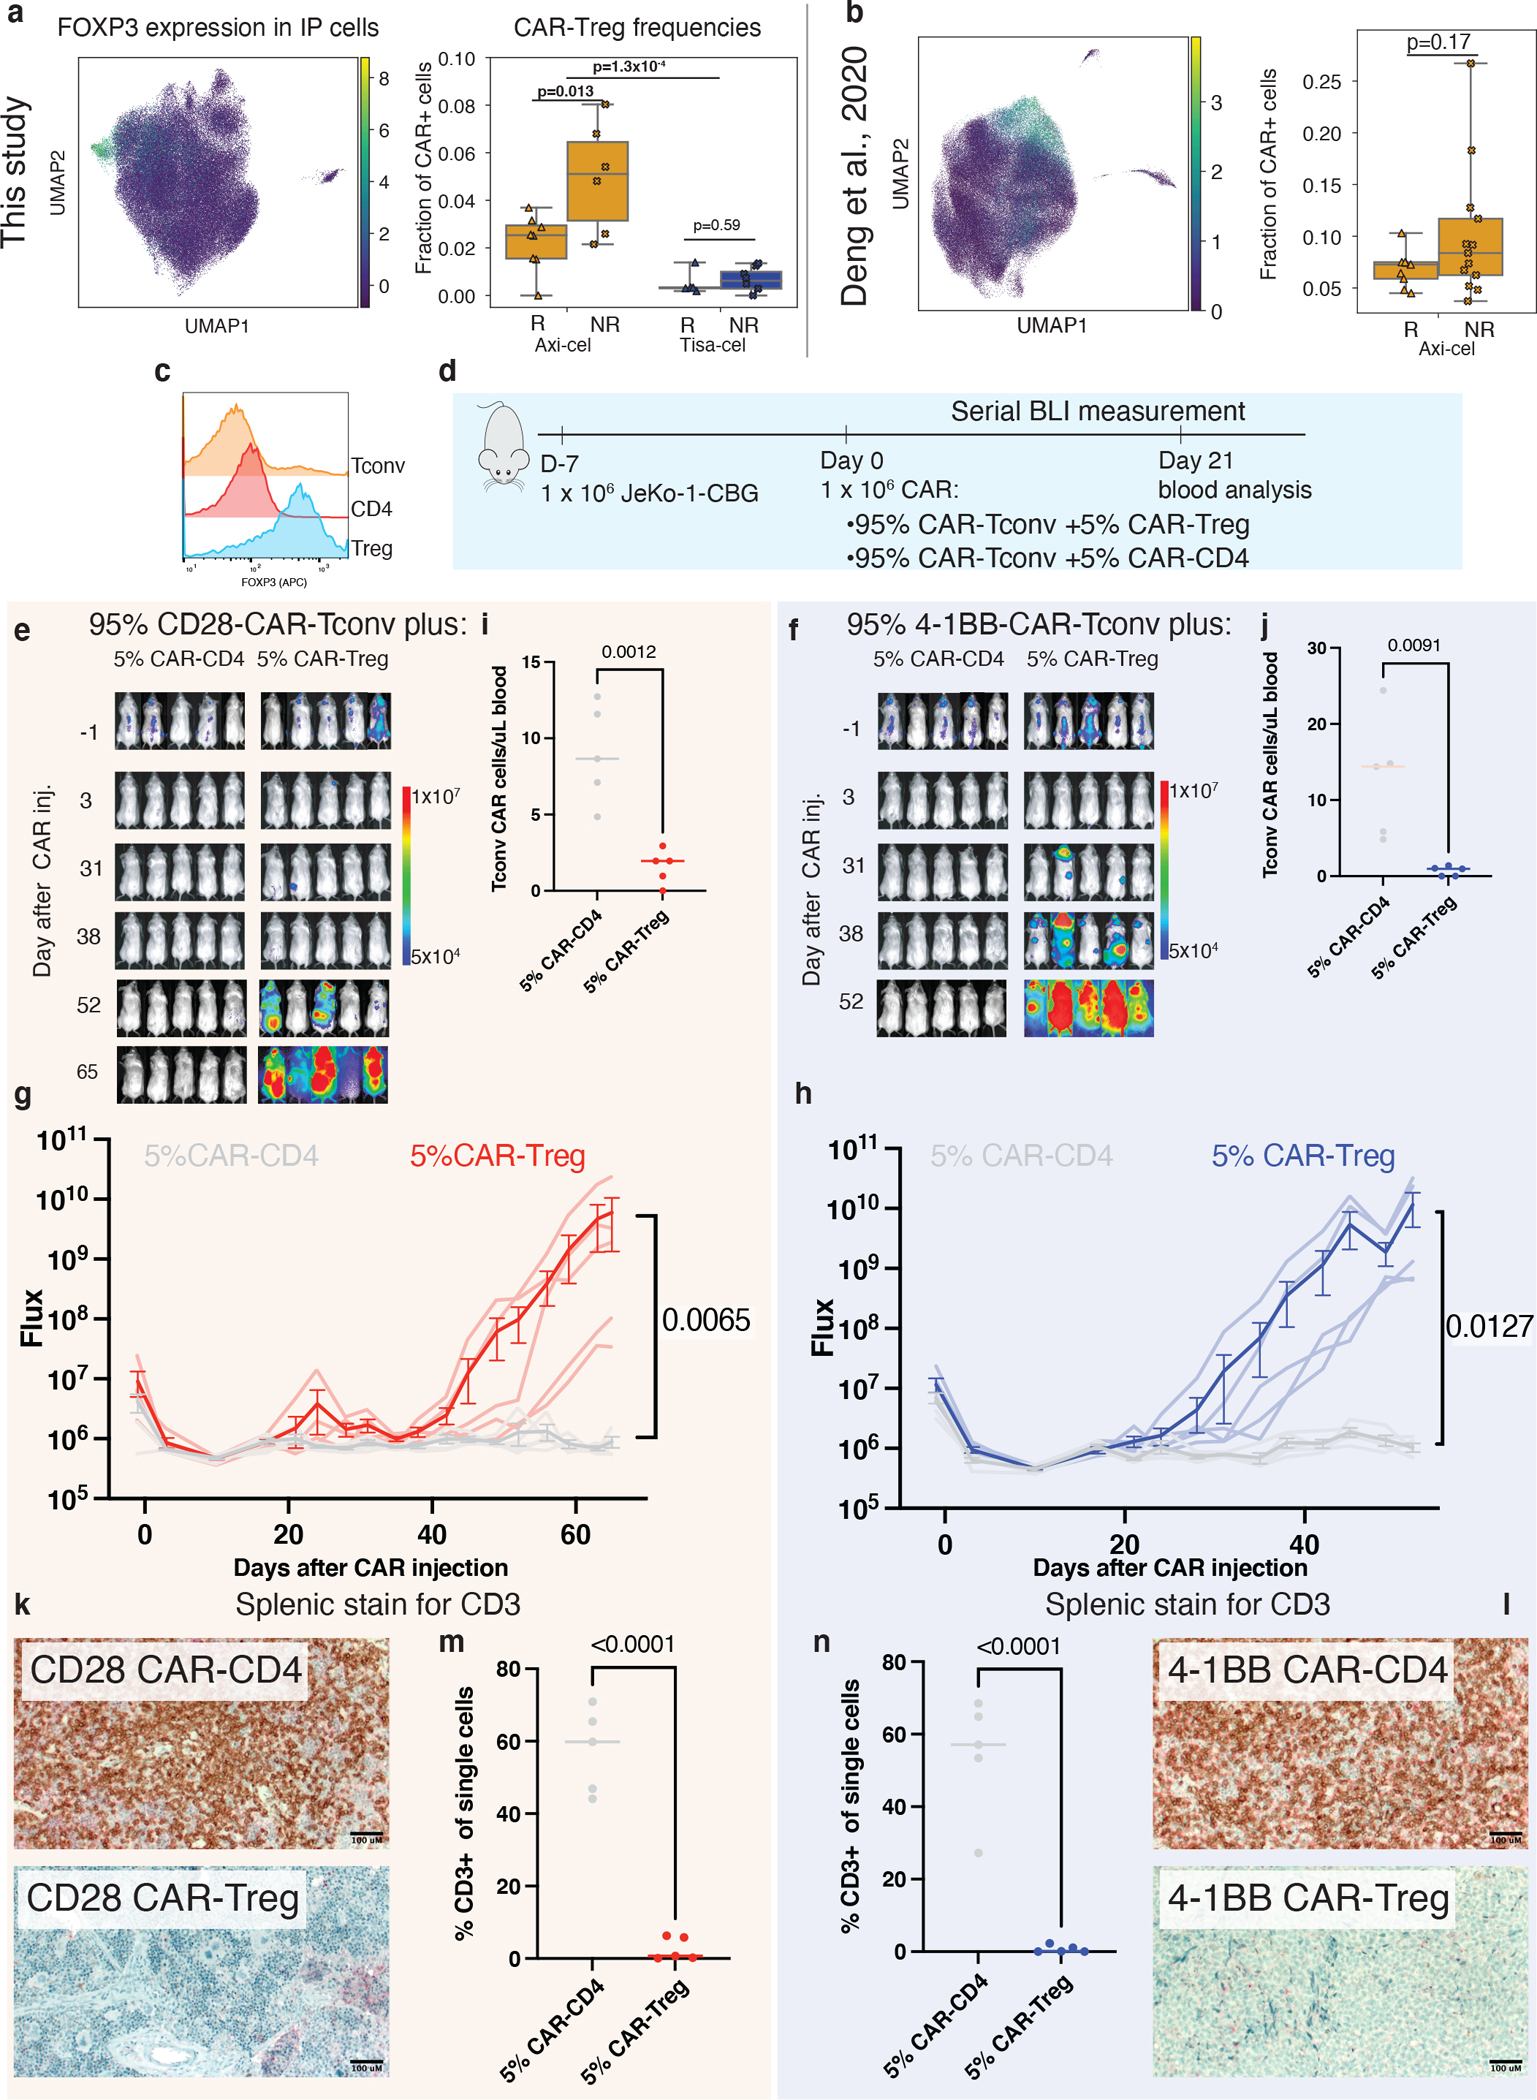
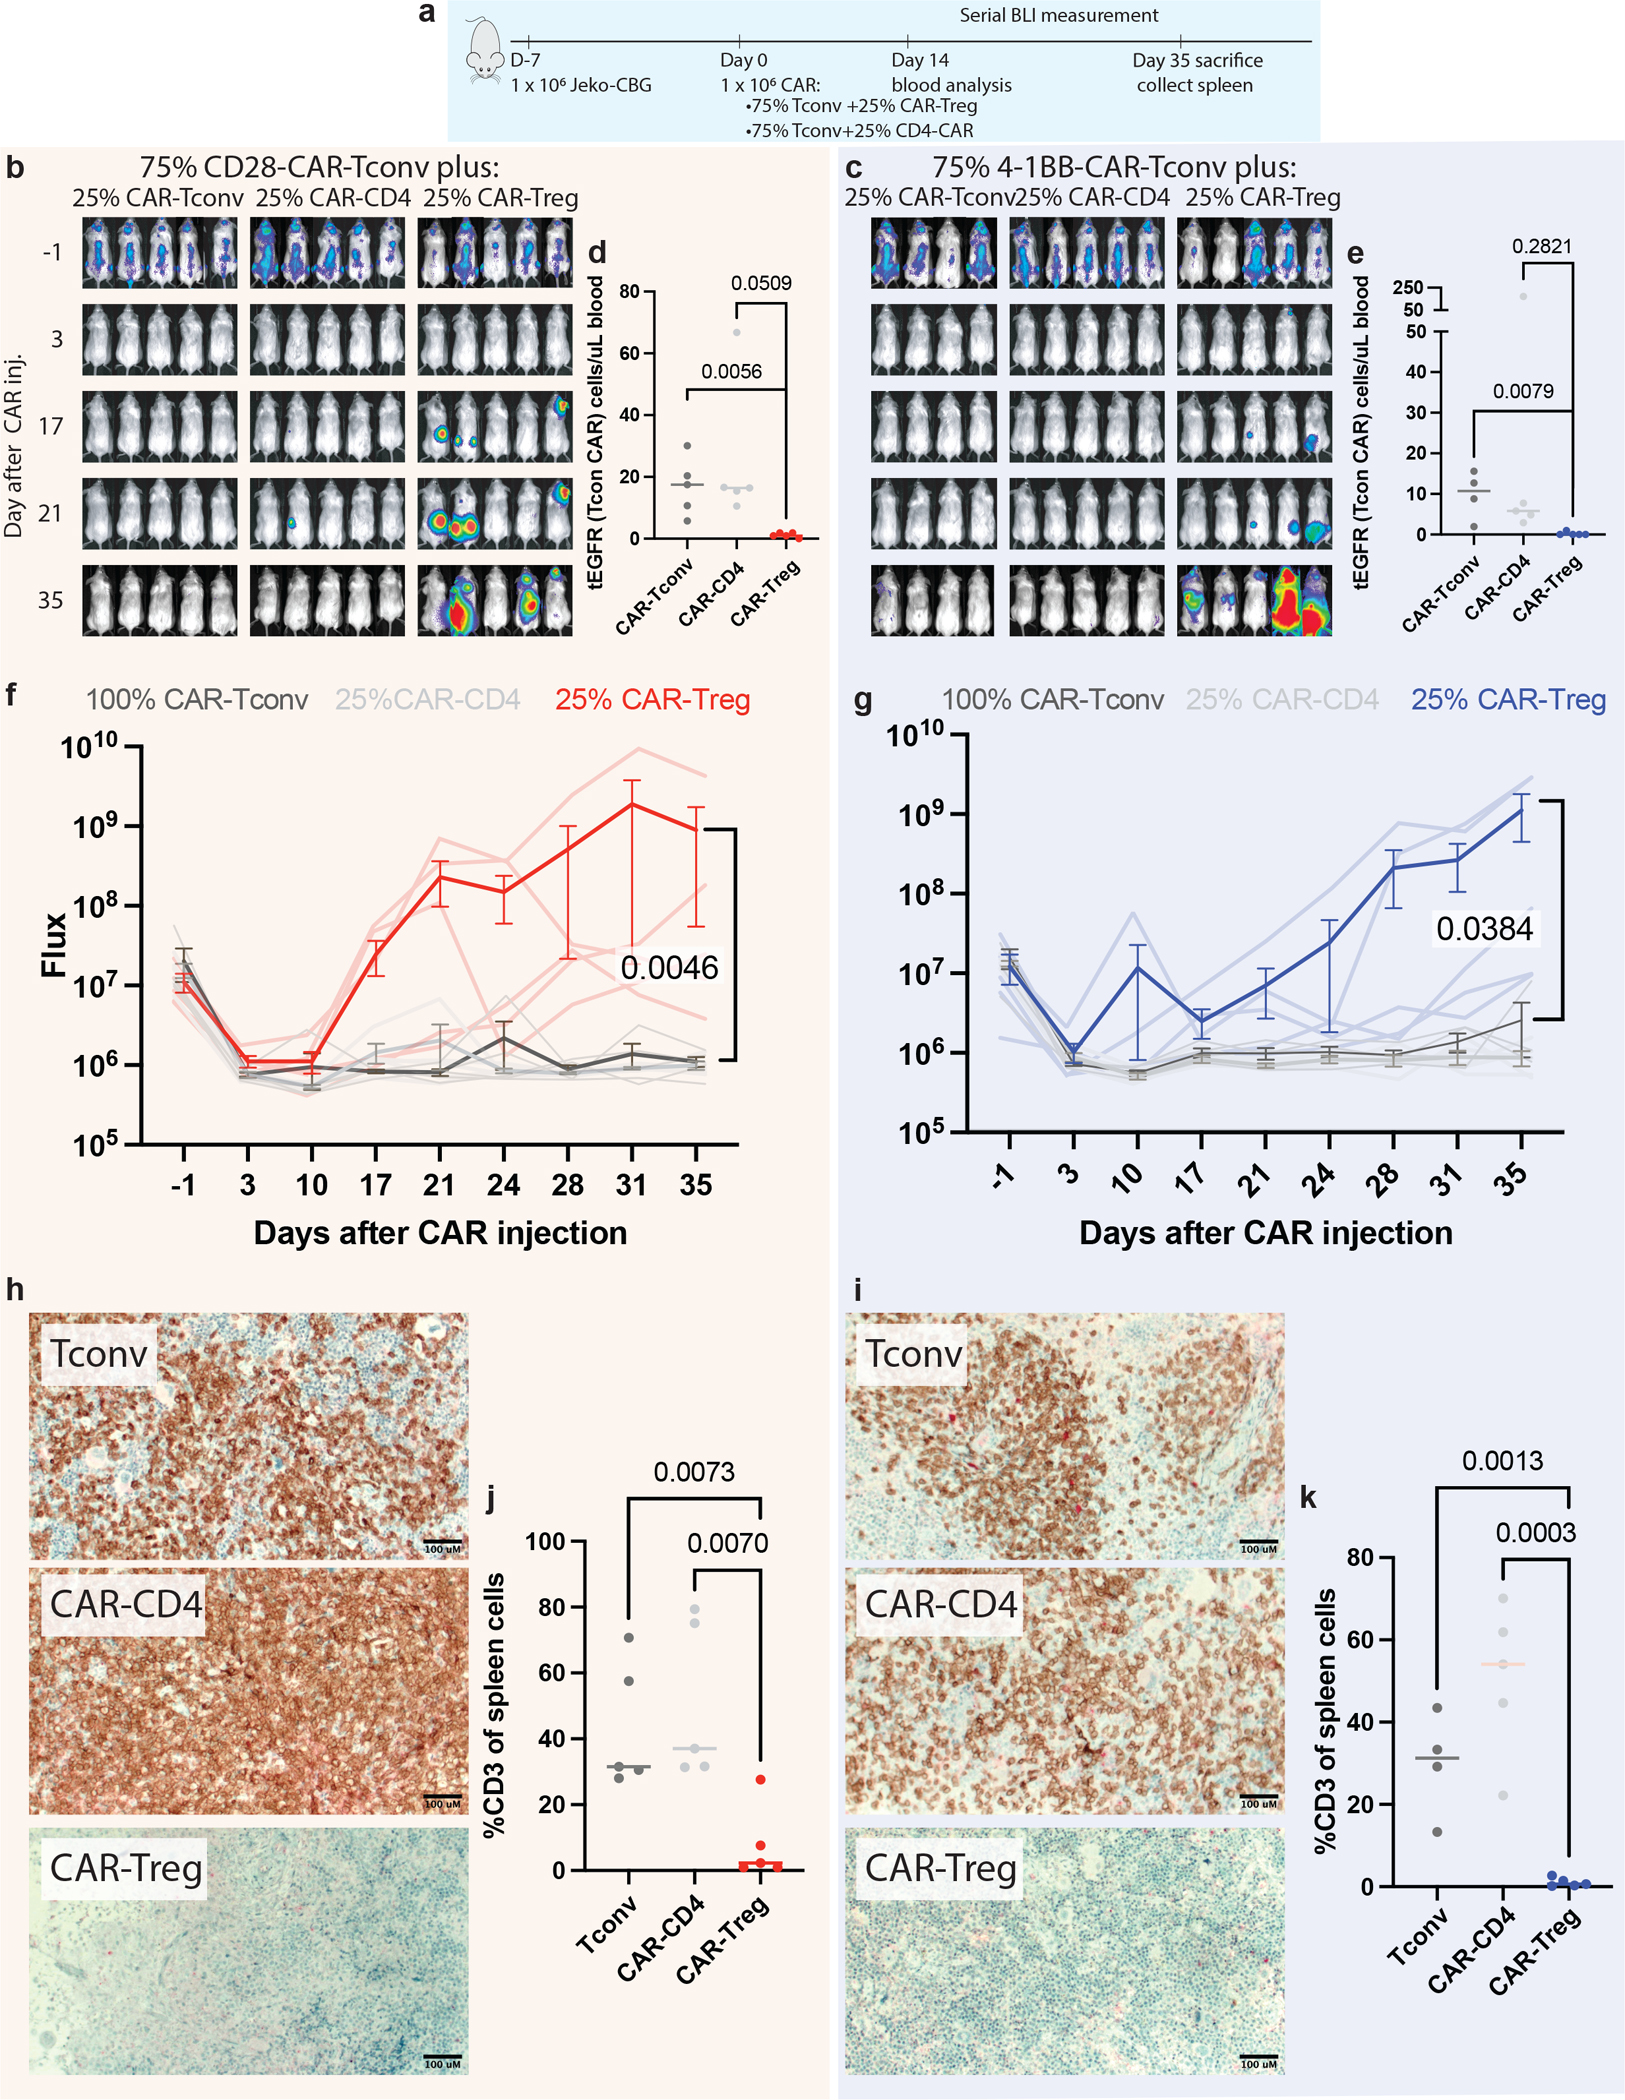
a, Summary of CAR-Treg representation in infusion product cells of this dataset (n=28 biologically independent samples with ≥100 cells) as well as b, an independent set of axi-cel infusion products (n=24 biologically independent samples). Shown are a u-map representation of cells colored by FOXP3 expression (left) and the fraction of identified CAR-Tregs (out of all CAR-T cells) stratified by product and response (right). Boxes show the median, interquartile range, and maximum/minimum values. c, Intracellular flow cytometry staining of FOXP3 staining of donor T-regs, CD4 control T-cells, and Tconv T-cells. d, Schematic of in vivo CAR-Treg validation. NSG mice were injected with 1 × 10⁶ Jeko-CBG lymphoma cells on day −7. On day 0 mice were injected with 1 × 10⁶ CAR-T cells representing 95% CAR-Tconvs with either 5% CAR-Tregs or 5% CD4-CAR-T control cells. Experiment performed with CD19-CD28 (left) or CD19–4-1BB (right) constructs. e,f, Time course tumor radiance (photons/sec/cm2/sr) and g,h, flux (photons/s) for CD28 and 4–1BB experiments respectively. Mean ± SEM overlayed on individual subject curves for n=10 biologically independent animals treated with each construct. P-value represents the result of two-way ANOVA. i,j, Flow cytometric quantification of CAR-Tconv day 14 after CAR injection for n=10 biologically independent animals. P-value represents two-tailed unpaired t-test. A line denoting the median value is shown. k,l, Representative immunohistochemical staining for human CD3 in the spleen. m,n, Flow cytometric quantification of CD3 cells from the spleens of the indicated conditions for n=10 biologically independent animals. P-value represents two-tailed unpaired t-test. A line denoting the median value is drawn.
We found that in axi-cel CAR-Tregs in IPs this population had increased frequency in non-responders (Fig. 5a, two-tailed t-test p=0.013, median of 5.1% and 2.5% with ranges of 2.2–8% and 0–3.7% in non-responders and responders, respectively). T-cells without a detected CAR had lower fractions of T-regs (median 0.6%), and they were present at a higher median level in non-responders (Extended Data Fig. 7a, median 1.5% vs 0.4%, t-test p=0.082). However, due to the lack of definitive flow cytometric isolation of such CAR-negative cells from our IP samples and the sparsity of scRNA-sequencing data, this increase in non-responders could be due to contamination by CAR-transduced cells for which we did not detect a CAR transcript. In exploring an external single-cell data set10 of axi-cel IPs, we also found a trend towards higher T-regulatory cells in non-responders (Fig. 5b, two-tailed t-test p=0.17). Most striking were several nonresponders with very high CAR-Treg frequencies, up to 26.7% of all CAR+ cells (range 4.5–10.3% for responders, and 3.7–26.7% for non-responders).
CAR-Tregs drive lymphoma relapse in vivo
To assess whether CAR-Tregs could drive resistance in aggressive lymphomas at the proportions observed in the IPs, we pursued in vitro and in vivo modeling. We isolated bulk CD3+ conventional T-cells (Tconv), T-regs, and CD4+ T-cells from healthy donor peripheral blood, and transduced these populations with either CD28 or 4–1BB costimulated second-generation CD19-targeted CAR constructs (Fig. 5c, Extended Data Fig. 7c,d). By CFSE staining of the bulk population, a population of 25% CAR-Tregs reduced CAR-Tconv expansion compared to CAR-CD4 controls for both constructs (Extended Data Fig. 7e,f). To assess the contribution of CAR-Tregs to relapse in an in vivo model of lymphoma, we subjected NSG mice engrafted with JeKo-1 lymphoma cells to injection of CAR-T-cells composed of 100% CAR-Tconv, or 75% CAR-Tconv with either 25% CAR-CD4 or 25% CAR-Tregs (Methods, Extended Data Fig. 8a). All mice appeared to rapidly clear tumor by day 3 (Extended Data Fig. 8b,c). However, for both constructs, the overall numbers of CAR-Tconv cells in the peripheral blood at day 14 were suppressed in the CAR-Treg treated mice (Extended Data Fig. 8d,e), and most of the mice treated with products containing CAR-Tregs relapsed, whereas none of the control mice had at the time of euthansia on day 35 (Extended Data Fig. 8f,g). Quantification of CAR-Tconv cells in the spleen at the time of euthanasia revealed high levels in the CAR-CD4 control mice and minimal levels of CAR-Tconv in the mice treated with injections containing CAR-Tregs (CD28 median 37.0 vs. 2.3, p=0.007; 4–1BB median 54.1vs 0.6, p=0.0003, Extended Data Fig. 8h–k).
After demonstrating that 25% CAR-Tregs were sufficient to drive relapse, we next wanted to ascertain if a lower, more physiologically relevant proportion of CAR-Tregs (as seen in our cohort) could also drive relapse. We engrafted NSG mice with JeKo-1 lymphoma cells followed by injection of CAR-T cells 7 days later, composed of 95% CAR-Tconv with either 5% CAR-CD4, or 5% CAR-Tregs (Fig. 5d). Again, after apparent early tumor clearance in all mice by day 3, all CAR-Treg mice developed frank relapse after extended follow up, while no relapses were seen in control mice (Fig. 5e–h). Assessment of peripheral blood CAR-Tconv expansion at day 21 revealed suppression in the CAR-Treg treated mice relative to control mice (CD28 median 8.7 vs 2.0, p=0.0012; 4–1BB 14.4 vs. 0.9 p=0.0091, Fig. 5i,j). At the time of euthansia, splenic CD3 staining was markedly reduced in all CAR-Treg mice by IHC and flow cytometry (CD28 median 59.8 vs. 0.68 p=<0.0001, 4–1BB median 57.1 vs. 0.12, p<0.0001, Fig. 5k–n). Thus, CAR-Tregs making up merely 5% of total infused CAR-T cells were sufficient to drive late tumor relapses and suppress CAR-Tconv expansion.
Differential CAR-T populations in patient with re-infusion
One of the study subjects (Tisa-N-29) that received tisa-cel had a CD19+ relapse 6 months after treatment. This patient was subsequently treated with a second infusion of the same IP and then achieved clinical and radiographic complete remission (last follow up 215 days after infusion; Fig. 6a).
Figure 6. Differential characteristics of tisa-cel expansion in patient with relapse and subsequent retreatment.
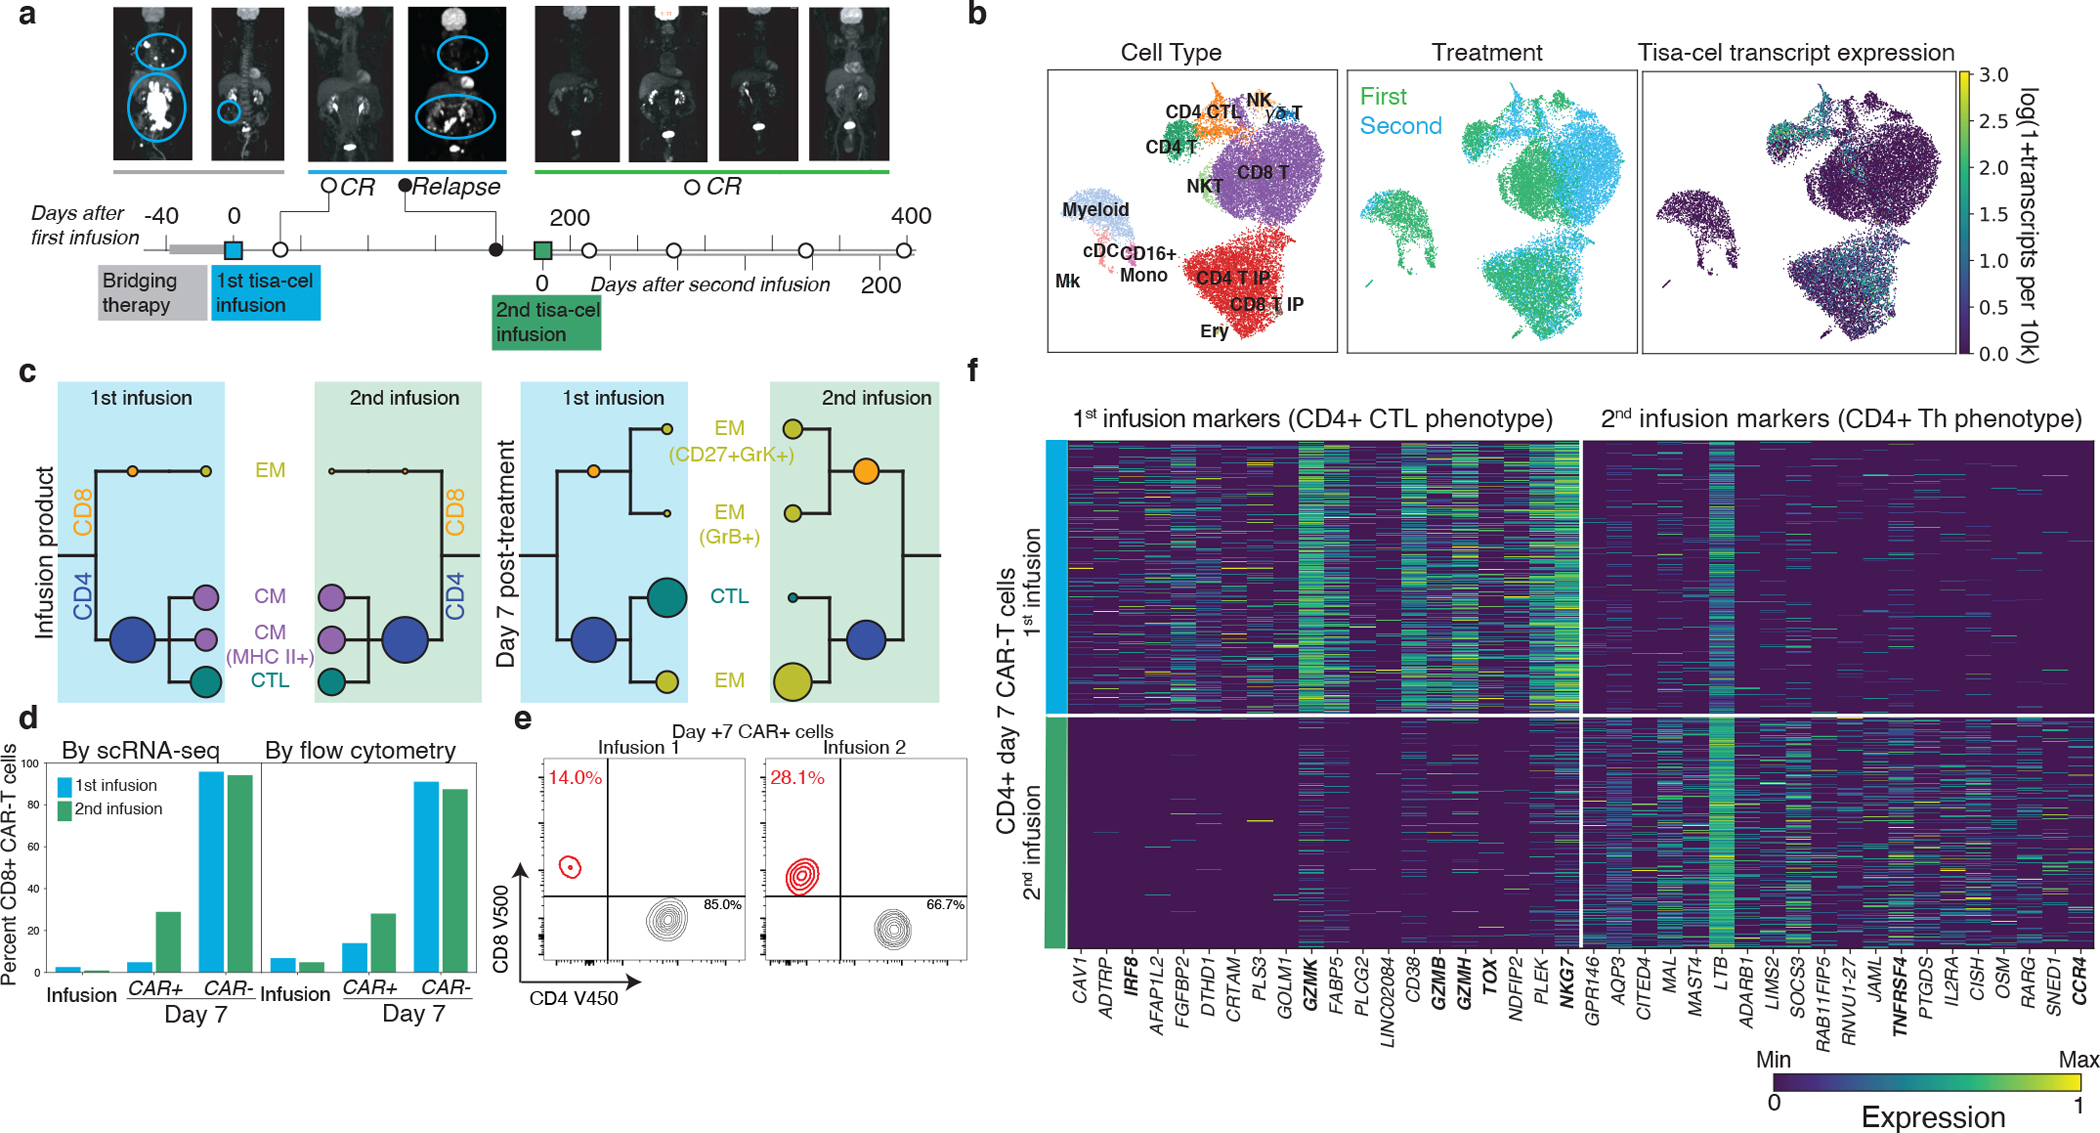
a, PET scans and illustration of treatment timeline for patient with relapse and subsequent re-treatment. b, U-map representation of cells from patient with second treatment colored by cell type, CAR (tisa-cel) expression, and first or second infusion. c, CAR-T subpopulation frequencies using the same visualization described in Fig. 4b. d, Fraction of CD8+ cells found by scRNA and flow-cytometry in different T cell subsets for each treatment. e, Flow cytometric measurements of CD8+ cell fractions in day 7 CAR-T cells. f, Top differentially expressed genes between the two treatments for CD4+ CAR-T cells, as determined by a t-test.
PBMCs collected seven days after re-treatment as well as the re-administered IP were analyzed by scRNA-seq as before (Fig. 6b). As expected, the two IP products lacked any discernible differences in cellular composition (Fig. 6b,c). In contrast, CAR-T cells at day 7 following each of the treatments exhibited marked differences. While few (5%) CD8+ CAR-T cells were detectable seven days after the initial infusion, ~30% (a six fold increase) was observed after the second (Fig. 6d), a finding confirmed by parallel flow cytometry measurements (Fig. 6d,e). Between the two infusions, no differences in phenotype were found in the post-infusion circulating CD8+ CAR-T cells, although statistical power for this comparison was limited by the low frequency of CD8+ T cells after the first treatment. On the other hand, the phenotype of CD4+ CAR-T cells strikingly shifted from one treatment to the other (Fig. 6c,f). The CAR-T cells had a CTL phenotype after the first infusion, with top differentially expressed genes including markers of cytotoxicity (GZMK, GZMB, GZMH, NGK7), the transcription factor IRF8, and the gene TOX, implicated previously in T cell exhaustion36. In contrast, CD4+ cells after the second infusion instead expressed genes more consistent with a helper phenotype such as TNFRSF4 (encoding co-stimulatory molecule OX40) and Th2-marker CCR4.
Differences were also observed in the non-CAR compartment, with the first post-treatment sample being composed of almost exclusively CD8+ T cells, while the second additionally contained myeloid and NK cells (Fig. 6b, Extended Data Fig. 9a, b). The CD8+ non-CAR-T cells exhibited substantial differences in expression between the two timepoints. After the first treatment, these cells expressed CD27 and CXCR3. After the second they expressed higher levels of transcription factor encoding genes GATA3 and TBX21 (t-bet) and increased levels of GNLY (Extended Data Fig. 9c).
Discussion
CD19 CAR-T therapy has provided a cure to roughly 40% of patients with previously incurable lymphomas26,37, but the failure modes in the remaining patients remain incompletely understood38–40. Our study provides important observations of temporal changes in clonal and expression dynamics of the two major CD19 CAR-T designs in use for LBCL (Extended Data Fig. 10). Tisa-cel responses were associated with expansion of central-memory CD8 populations, a phenomenon not seen in axi-cel. Curiously we did not observe the same associations of CM and exhaustion phenotypes with response to axi-cel as found in a prior study10. Larger cohorts will be needed to understand whether this is due to the still relatively small sample sizes attainable with scRNA-sequencing, or the result of genuine differences in the patient populations or clinical practices of our respective hospitals.
A striking feature of our data is the divergent phenotypes and apparent response mechanisms of the two products. The two products have differing designs (4–1BB vs CD28 costimulation, CD8 vs CD28 transmembrane for tisa-cel vs axi-cel), are delivered by different vectors, and have differing manufacturing processes41 (fresh vs frozen apheresis products, activation antibody-coated beads vs soluble antibody and cytokines), although the precise details remain proprietary. Understanding predictive molecular features of response specific to each product will give insights to further optimize their design and manufacturing, and may help identify which product is most likely to succeed in a given patient.
Apart from the CAR-T cells themselves, our case where re-administration of a second infusion of the same tisa-cel IP to a patient resulted in expansion of different immune cell populations after each treatment highlights the importance of CAR-T-extrinsic phenotypes in response. How important is the host immunological milieu for CAR-T cell therapy and to what extent can we optimize it? Do the stochastics of infusing individual unique cells matter more than previously thought? Tumor-intrinsic factors such as overall disease burden may also play a role; however, in this case, tumor burden was higher upon the second infusion (Supplementary Table 1, SPD values of 37.2 and 58.9 cm2 for the first and second dose respectively). Retrospective studies of patients who have received multiple infusions suggest that this successful re-induction of remission is rare42.
Finally, we found that increases in infusional CAR T-regulatory cells (CAR-Tregs) are associated with non-response to axi-cel treatment, and demonstrate similar trends exist in data from a prior study of axi-cel products10. In vivo modeling suggests that this may be sufficient to drive late relapses and suppression of CAR-Tconv expansion in lymphoma, providing the first demonstration that small numbers of CAR-Tregs are capable of driving clinical relapse. Depletion of T-regulatory cells using CD25 selection has been performed at clinical scale in the context of an autologous stem cell transplant for multiple myeloma43, suggesting that such a step could be added to traditional CAR-T manufacturing pipelines. Additionally, while in vivo modeling demonstrated that CAR-Tregs incorporating either costimulatory domain could cause relapse, we observed substantially lower numbers of CAR-Tregs in tisa-cel products.. As axi-cel manufacturing begins from fresh apheresis cells while tisa-cel is derived from frozen cells, we speculate that cryopreservation may serve as a crude depletion of T-regs, which are notoriously intolerant of freezing44–46.
We note several aspects not examined by our current manuscript, including the impact of different times of peak expansion (median of 7 and 9 days for axi-cel and tisa-cel), as well as lengths of persistence, with axi-cel rapidly declining while tisa-cel can be detected for months or years after infusion, particularly in responders26,37,47. Furthermore our study was limited to blood, and future investigation of lymph node biopsies and analysis of tumor-CAR-T interactions remains a fruitful avenue for research.
In summary, we have profiled the transcriptomic evolution of immune cells over the course of treating refractory LBCLs with the first two CD19 CAR-T products. It is our hope that through illumination of the response-associated characteristics of each treatment we can optimize the design of CAR-T therapies, match patients with the treatments most likely to induce a clinical response, and understand strategies for combating relapse.
Methods
Patient samples and cell preparation
All patients were treated with commercial CAR-T cell products; clinical data and blood samples were obtained after written informed consent under an IRB-approved protocols at the Dana-Farber/Harvard Cancer Center (DFHCC #16–206 and 17–561). We complied with all relevant ethical regulations for human research participants. No compensation was provided for participation. Demographic information (age and gender) are provided in Supplementary Table 1. Responders were defined as those without radiographic relapse by 6 months of follow-up. Non-responders were defined as patients whose disease either did not have an initial response at day 28 or who progressed before the 6-month follow-up window. Infusion products were collected from the remnants of infusion bags and cryopreserved in a solution of 10% DMSO in FBS. Tumor burden was assessed using sum of the product diameters (SPD) which is based on revised international working group (IWG) response criteria for malignant lymphoma49,50 and has previously been utilized for tumor burden assessment in lymphoma patients treated with CAR-T cell therapy26,51.
Cryopreserved PBMC from day 7 after CAR-T infusion were thawed and resuspended in FACS buffer (phosphate buffered saline (PBS) with 2% fetal bovine serum (FBS)). 5uL of Fc block (BD Bioscience) was added for 5 minutes followed by addition of the antibodies in BD brilliant stain buffer (BD Bioscience). The cells were stained for 20 minutes at 4°C using the following antibody clones: CD45 (BV786 BD HI30 563716)) used at dilution of 1 in 167, CD3 (APC BD Biosciences 5H9 340661) used at dilution of 1 in 83.5, CD4 (V450 BD Bioscience SK3 651850) used at dilution of 1 in 83.5, CD8 (V500c BD Bioscience SK1 647458) used at dilution of 1 in 83.5, CD14 (FITC BD Bioscience MφP9 347493) used at dilution of 1 in 83.5, sCD19-PE (BioLegend custom conjugation 900002598, lot B324342) used at dilution of 1 in 55.6. Cells were then washed twice and resuspended in FACs buffer followed by addition of 7AAD (BioLegend). Live CAR-T cells and non-CAR-T cells were acquired separately using a BD FACSAria utilizing the gating strategy in Extended Data Fig. 1a with gating based on healthy non-CAR transduced donor PBMC prepared separately for each batch. Samples were resuspended in 0.04% ultrapure bovine serum albumin in PBS at 1000 cells/uL density prior to loading on a 10x Genomics Chromium platform. Infusion product and baseline samples were thawed similarly and combined into batches of up to four samples per 10x channel loaded at a density of 3000 cells/uL. For some infusion product samples with a poor-post thaw viability (<80%), the Miltenyi Dead Cell Removal kit (130–090-101) was used to deplete dead cells prior to scRNAseq.
Single-cell transcriptome sequencing data generation
Viable cells were resuspended in PBS with 0.04% BSA at a cell concentration of 1000 cells/μL. 40,000 cells were loaded onto a 10x Genomics Chromium instrument (10x Genomics) according to the manufacturer’s instructions. The scRNA-seq libraries were processed using Chromium single cell 5’ library & gel bead kit v2 and coupled scTCR-seq libraries were obtained using Chromium single cell V(D)J enrichment kit (human T cell) (10x Genomics). Quality control for amplified cDNA libraries and final sequencing libraries were performed using Bioanalyzer High Sensitivity DNA Kit (Agilent). Both scRNA-seq and scTCR-seq libraries were normalized to 4nM concentration and pooled in a volume ratio of 4:1. The pooled libraries were sequenced on Illumina NovaSeq S4 platform. The sequencing parameters were: Read 1 of 26bp, Read 2 of 90bp, index 1 of 10bp and index 2 of 10bp.
Generation of CAR reference
A custom reference was built using GRCh38 and the Ensembl 100 annotation, supplemented with sequences for both the axi-cel and tisa-cel constructs. To determine the sequence of these constructs, we created an initial reference including the sequences of pELPs 19-BB-z52 for tisa-cel, and msgv-fmc63–28z53 for axi-cel. We then aligned read 2 of four of our infusion product samples (Tisa-R-21, Tisa-N-20, Axi-R-1, Axi-N-14) to this supplemented genome using STAR v2.5.1b. We used the bcftools call tool (v1.11) to identify variants of the true CAR sequence from our initial reference, and the bcftools consensus tool to create an updated fasta file with refined CAR sequences. This was then added to our GRCh38-based reference and prepared with Cellranger mkref (v6.0.1) giving the reference genome used for preprocessing of the full dataset.
Preprocessing of scRNA-seq GEX data.
Raw fastq files for all 10x runs were aligned and quantified using Cellranger v6.0.1 with the expect cells parameter set to 5k per pooled sample (e.g. a run with 5 multiplexed samples was set to 25k) and using the custom reference described above. Gene expression matrices were further filtered for ambient contamination using cellbender v0.2.0.
For all cell multiplexed samples, we ran souporcell v2020.7 to identify genotype clusters using the 1000 genomes common SNP sites. The genotype of every patient at these sites was identified by running bcftools call on the CAR-sorted day 7 samples (since these were not multiplexed). Then the identity of genotype clusters was re-identified by finding the patient with the least discordant genotype calls expected to be in the pool. TCR sequencing data for all runs was processed using cellranger vdj (v6.0.1) and the GRCh38_vdj_v5.0.0 reference package.
Classification of cell types
An initial clustering of the cells was performed using scanpy54 v1.8.1 and a standard single cell workflow. Doublets were filtered by running scrublet55 v0.2.1 on each 10x channel individually for PBMC samples. Cells were filtered for a minimum of 200 genes and <15% mitochondrial RNA transcripts. Data was log-normalized as ln(1+104 ng/N). Variable genes were selected using scanpy’s highly_variable_genes process with a minimum dispersion of .2 and mean expression values between 0.01 and 3. We further blacklisted from clustering consideration the axi-cel and tisa-cel genes, any TCR or BCR variable genes, as well as sex-biased genes XIST, RPS4Y1 and RPS4Y2. We regressed out the effects of total UMI counts and mitochondrial RNA percentages, and then standardized the expression values with a maximum of 10. We performed PCA, then used harmony to integrate our data batches. Nearest-neighbors were computed using the top 18 harmony-adjusted PCs, and UMAP was run to produce the global visualizations shown.
Classification of CD4 and CD8 populations
Due to scRNA sparsity CD4 and CD8 T cells cannot be directly classified by gene expression, and clustering at reasonable resolutions did not always cleanly separate these populations. To overcome this, we computed a nearest-neighbor graph using k=100. We then calculated smoothed expression of CD4 and CD8A by taking the mean across the 100 nearest neighbors of every cell. We then classified CD4 and CD8 T cells by gating on these expression values (Extended Data Fig. 1c).
Quantification of CD45 isoform expression
Because the important splicing events to distinguish CD45RA and CD45RO isoforms occur at the 5’ end of the gene (exons 4–7), we were able to develop an isoform quantification model similar to those commonly employed in bulk RNA sequencing56. First for every read, we calculated a binary matrix of values Cr,i which are 1 if splicing of read r was compatible with each of the six human isoforms i of CD45 (RO, RA, RAB, RB, RBC, RABC). We then calculated what the implied fragment length of the sequencing molecule (Lri) would be for each isoform i as the distance from the start of the gene to the 3’ end of the read (counting only exons included in isoform i). The likelihood of a given read coming from a molecule with a particular isoform i could then be modeled as
The likelihood of a particular transcript t being a certain isoform can be calculated by the product rule over all the reads with that transcript’s UMI
The prior probability of a transcript being of a given class was then modeled with a categorical distribution
Which allows computation of the posterior probability of a transcript being a particular isoform
We then applied Expectation-Maximization by iteratively computing the above quantity (E-step), and applying the following update rules
Where N is the total number of reads in the sample. In our downstream analyses, we then estimated expression of CD45RO and CD45RA (the classification antibody which detects isoforms RA, RAB, and RABC) for every cell c on the same log-transformed scale as our gene expression data by computing:
Supervised classification of T-cell subsets
To label cells, in a fashion consistent with FACS-based literature, we annotated cells based on the expression of commonly used marker genes by thresholding knn-smoothed (k=20) log-normalized expression values as designated in Supplementary Table 6. Conventional T-cells were classified by differentiation state as Naive (CCR7+CD45RA+), CM (CCR7+CD45RA−), EM (CCR7−CD45RA−), and TEMRA (CCR7−CD45RA+). We further distinguished two additional T-cell subsets: T-regs (FOXP3+) and CD4+ CTLs (CD4+NKG7+).
Validation of T-cell subtype classification using 10x demonstration dataset
BAM files, gene expression, and feature barcode matrices for the dataset “PBMCs of a Healthy Donor - 5’ Gene Expression with a Panel of TotalSeq™-C Antibodies” were downloaded from the 10x Genomics website. CD45 isoforms were quantified from the BAM files using our tool described above. Gene expression and feature barcoding data were normalized in units of log-transcripts-per-10k. T-cells were selected as cells with a protein expression of CD3 above 7.5, and then a typical scanpy workflow was used to visualize the data by running PCA followed by U-MAP. Subpopulations were defined by drawing gates to best separate clusters of cells with different combinations of CD4/8 and CD45RA/CCR7 positivity as shown in Extended Data Fig. 4d. In the feature barcoding data CD8+ cells had a higher background signal of CD45RA and thus a higher threshold was needed than for CD4+ cells, where in the RNA data a single cutoff could be used for both.
Sub-clustering of CAR-T populations
We performed sub-clusterings of CAR-T cells for all eight combinations of CD4/8 subtype, IP/D7 timepoint, and tisa/axi-cel product. Harmony batch correction was used to adjust four samples that had been run without the FACS sorting procedure, using all other samples as a reference. Cells were considered CAR-T if at least a single CAR transcript was observed, or if they shared a TCR sequence with another CAR+ cell. Cells were then processed using the same pipeline outlined above, with the exception that we used fewer (15) PCs and regressed out S and G2M scores. For each of the eight sets, we performed Leiden clustering57 to define sub-populations and identified top marker genes with a t-test.
Testing for compositional changes
We tested for changes in PBMC population frequencies between responders and non-responders by running scCODA22 using T-cells as a reference. We fit a model using response and product as predictors, and reported cases found to be credible with >90% inclusion probability (corresponding to a 10% false discovery rate).
When testing overall changes in CAR-T cell populations (Fig. 4b), as a suitable and consistent population to use as a reference is not possible, we used a modified approach. We fit a dirichlet-multinomial model on the cell counts of each patient with parameters αR and αNR for responders and non-responders. We then calculated a log likelihood ratio statistic between the maximum likelihood of this model (L1) and that of a null model fixing αR=αNR (L0).
Finally, we permuted our responder/non-responder labels 100,000 times and computed a null distribution for R, then used this to calculate an empirical p-value. We reported a Benjamini-Hochberg FDR-corrected q-value, correcting across the 8 categories of CAR-T cells analyzed.
Pseudobulk differential expression analysis
To perform differential expression while controlling for the dependence structure on the cell level introduced by inter-individual differences, we applied a pseudobulk method. For each gene, we calculated the total number of UMIs in a given cell population of interest by summing across all cells. Cells from different patients, T cell type (Baseline, Infusion-nonCAR, Infusion-CAR, D7-nonCAR, D7-CAR), and CD4/8 subtype were given separate pseudobulk samples, yielding an X by Y matrix of UMI counts. We then analyzed this using a limma48 workflow using multi-level modeling to account for multiple pseudobulk samples coming from the same patient. Counts data was voom-transformed, and sample dependency correlations were computed using the patient ID as a blocking variable. The voom transform was then recomputed using a model with the blocking structure. The limma model was then fitted using gender as a covariate, and contrasts of interest were compared between populations of interest.
IP cell type identification
In order to identify common cell populations across different types of CAR-T infusion products (IPs), we re-analyzed just the cells from the IP samples. We used the same workflow as above, however with the difference that we performed Harmony batch correction using the patient ID as a batch variable. This removes the (likely biological) differences between the products, but enabled us to identify common populations between the two, more importantly isolating regulatory T cells in tisa-cel products.
Independent T-reg validation
We downloaded scRNA-seq gene expression matrices of previously published axi-cel infusion products10 from the Gene Expression Omnibus (GEO accession GSE151511). We filtered cells with ≤200 genes and ≥10% mitochondrial RNA. Data was processed using the pipeline described above, using 25 PCs and harmony batch correction on the sample level to allow identification of common populations.
CAR-Treg validation
Lentiviral production:
Human embryonic kidney (HEK293T) were purchased from ATCC and expanded in RPMI 1640 media with GlutaMAX and HEPES (ThermoFisher Scientific 72400–120) with 10% FBS (R10). Constructs were synthesized and then cloned into a third-generation lentiviral backbone (GenScript). Replication deficient lentivirus was produced by transfecting plasmids into HEK293T cells. Supernatant was collected at 24 and 48 hours after transfection. Virus was filtered and then concentrated by ultracentrifugation followed by storage at −80C.
Bulk T-cell isolation and CAR production:
Anonymized human healthy donor leukapheresis products were purchased from the Massachusetts General Hospital blood bank using an IRB-approved protocol. CD3+ T-cells were isolated using a T-cell rosette sep isolation kit (STEM CELL Technologies 15061) and then activated using CD3/CD28 Dynabeads at a 3:1 bead:T-cell ratio (Life Technologies 40203D) in R10 with penicillin/streptomycin (Thermo Fisher Scientific 15140122), and 20IU/mL recombinant human IL-2 (Peprotech 200–02). CARs were transduced with lentivirus at a multiplicity of infection (MOI) of 5 on day 1 and expanded with media doubling and IL-2 replacement every 2–3 days. After one week the CARs underwent magnetic debeading, followed by another week of expansion.
Tregulatory cell (Treg) isolation and CAR production:
CD4+ T cells were isolated from the autologous donor leukopak (relative to CD3+ cells) using the Rosette-sep Human CD4+ T cell negative selection isolation kit with a Ficoll gradient (STEMCELL Technologies 15062). Isolated CD4+ cells were then enriched for CD25 using CD25-PE antibody staining (BD Bioscience 2A3) and subsequent anti-PE bead selection (Miltenyi Biotec #130–048-801). The resultant two populations (CD4+CD25high, and CD4+CD25low) were then stained with CD4 (BV510 BD Biosciences SK3 562970) used at a dilution 1 in 20, CD8 (APC-H7 BD Biosciences SK1 560273) used at dilution 1:40, CD127 (BV 711 BD Biosciences HIL-7R-M21 561028) used at dilution of 1 in 20, and DAPI and sorted on a BD FACS Aria for the following populations DAPI-CD4+CD8-CD25high127- (Tregulatory cells) and DAPI-CD4+,CD8-,CD25- (Control CD4s).
Tregs, CD4-control, and bulk-CD3 cells were activated with anti-CD3/anti-CD28 human Treg expander beads (Thermo Fisher Scientific 1129D) in CTS OpTmizer T cell expansion Serum Free Media (Thermo Fisher Scientific #A1048501) with 2% human serum (Access Cell Culture LLC), 1x GlutaMAX (Thermo Fisher Scientific), 100 U/mL penicillin-streptomycin, and recombinant human IL-2 (300 IU/mL for Tregs and 20 IU/mL for CD4-control). One day after sorting T-cells were transduced at an MOI of 5 with lentivirus. After one week the CARs underwent magnetic debeading, followed by another week of expansion. Transduction efficiency was assessed on day 12–14 after transduction, and non-transduced control cells (Tregs, CD4-control, or bulk-CD3) were added to normalize transduction efficiency across the conditions.
FOXP3 staining:
Prior to activation, samples were drawn from the CD4+CD25high127- (Tregulatory cells), CD4+CD25- (Control CD4s), and CD3+ (Bulk-CD3) groups and stained for FOXP3 (APC Invitrogen PCH101 17–4776-42) using the intracellular staining kit (eBioscience 00–5523-00) used at dilution 1 in 20.
JeKo-1 lymphoma model:
NSG (NOD.Cg-PrkdcscidIl2rgtm1Wjl/SzJ) mice were purchased from Jackson Laboratory and bred in pathogen-free conditions at the MGH Center for Cancer Research and all care and conducted experiments were carried out with protocols approved by the Massachusetts General Hospital Institutional Animal Care and Use Committee. Animals were housed at temperatures of 21.1–24.5C (70–76F), 30–70% humidity, and 12:12 light dark cycles. 6 week old female NSG mice were engrafted intravenously with 106 JeKo-1-click beetle green luciferase (CBG) lymphoma cells (ATCC) on day −7. On day 0, a total of 1×10⁶ fresh CAR-T cells were injected intravenously at the ratios of bulk-CD3, CD4-control, and Tregs as indicated. Mice were imaged biweekly using D-Luciferin (Fisher Scientific) in an Ami HT (Spectral Instruments Imaging). Images were analyzed using Aura version 4.0.0 (Spectral Instruments Imaging) Software.
At the time of euthenasia spleens were collected and sectioned. One section was fixed in 10% neutral buffered formalin, while the remainder was mechanically pulverized and filtered. Cells were stained for CD3 and analyzed via flow cytometry. All non-FACS sorting flow cytometry was performed on a BDFortessa X20 utilizing FACSDiva software version 8.0.1.
Formalin fixed tissue was transferred to 70% ethanol and underwent human CD3 (BD Bioscience UCHT1) staining at the MGH histopathology core. Scale bars were added utilizing Fiji ImageJ (continuously updated, open source, downloaded 2020).
All flow cytometry was analyzed utilizing Flowjo version 10.8.1. Validation analyses for in vitro and in vivo experiments utilized GraphPad Prism 9.0 software.
Swimmer plot was generated in RStudio (version 2021.09.1) using the package swimplot (version 1.2.0).
Data visualization
All boxplots presented here show the median, inter-quartile range, and minima/maxima of underlying samples. Overlaid dotplots show individual samples.
Data availability
Gene expression matrices from the scRNA data have been deposited to the Gene Expression Omnibus (GEO accession GSE197268). Raw sequencing data is available on the database of Genotypes and Phenotypes (phs002922.v1.p1). Data from a prior study of axi-cel infusion products is available on GEO at GSE151511.
Code availability
Code for our method for measurement of CD45 isoforms is publicly accessible on github at https://github.com/getzlab/10x-cd45-isoform-quantification. Other code supporting the analyses performed in this paper is available at https://github.com/getzlab/Haradhvala_et_al_2022.
Extended Data
Extended Data Fig. 1. Single-cell isolation and classification.
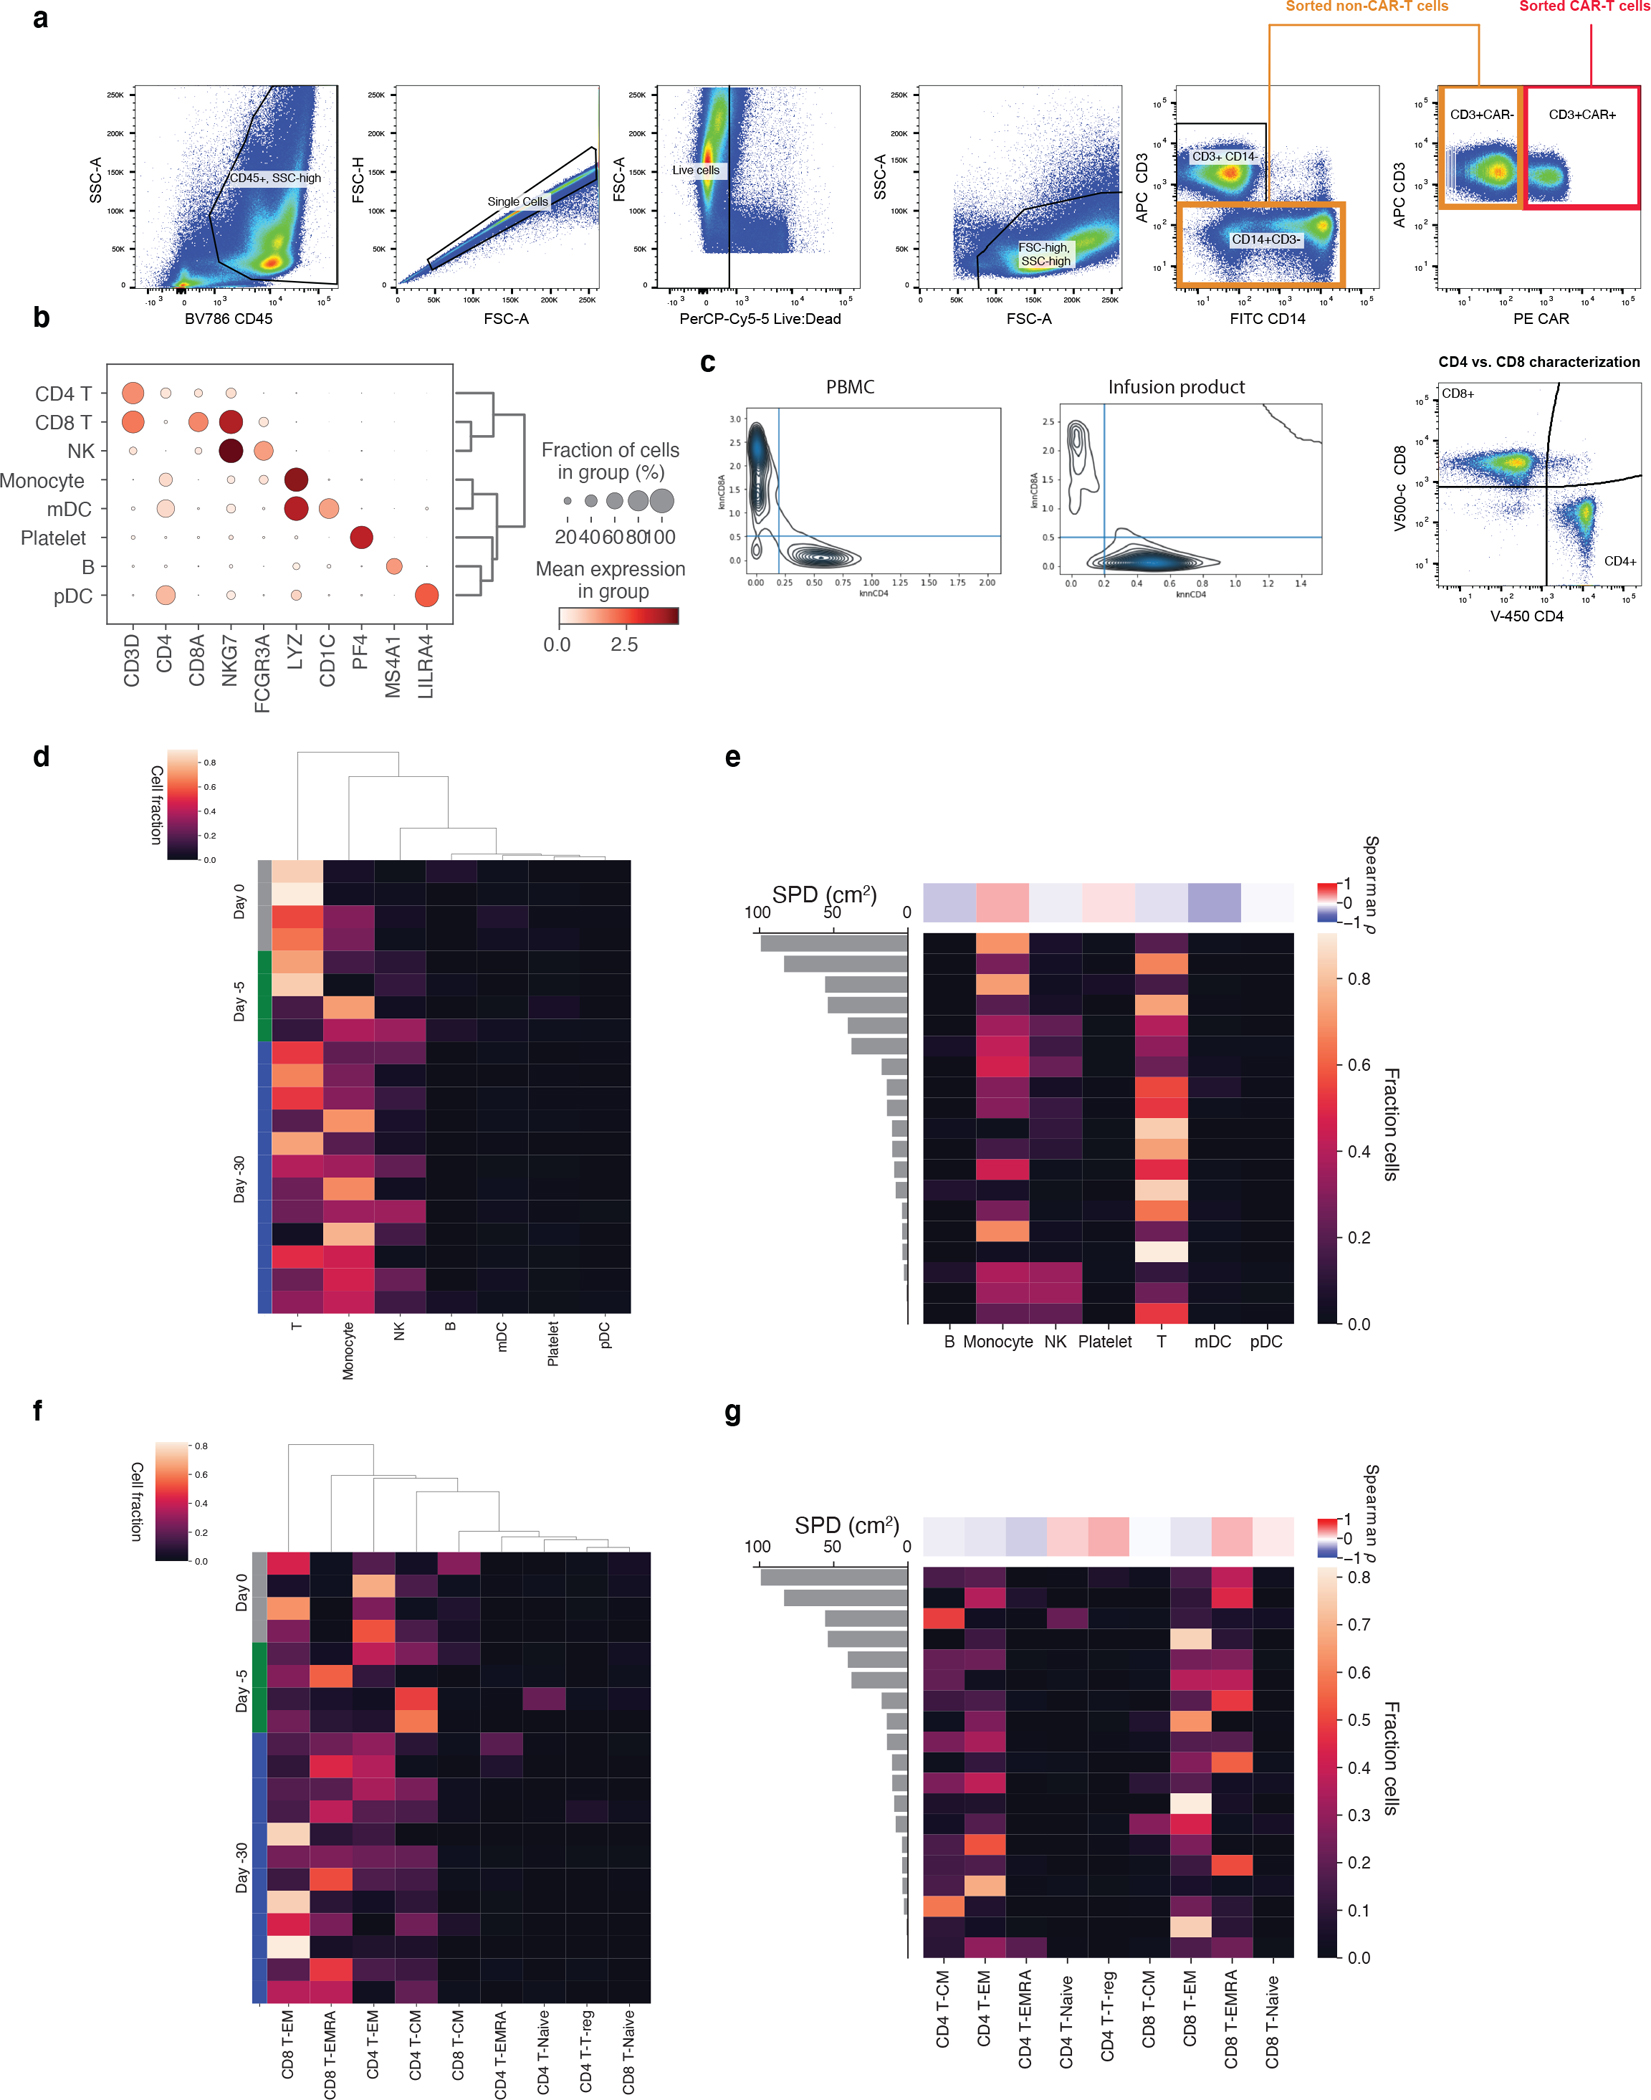
a, Live CD14-CD3+CAR+ cells were isolated as CAR-T cells while CD3+CAR- cells were combined with CD14+CD3- cells as non-CAR-T cells for subsequent scRNAseq workflows. b, Selected marker genes for PBMC cell population identification in scRNA-seq data. c, Kernel density estimate plots of knn-smoothed (k=100) CD4 and CD8A expression across cells at day 7 and in the IP. Lines are drawn for thresholds used for classification. d, Fractions of cells of each coarse cell type for every baseline sample sorted by timepoint of sampling, as well as e, baseline tumor volume, measured by SPD (cm2). The same shown for f,g fine-grained T-cell subsets.
Extended Data Fig. 2. PBMC cell composition differences between responders and non-responders pre- and post-infusion.
a, Boxplots of the cell type frequencies for each cell type stratified by product and response. The final cell type coefficient (with its posterior 95% high density interval) and FDR value (one minus the inclusion probability) estimated by scCODA are shown. Boxes show the median, interquartile range, and maximum/minimum values. n=20 and n=22 biologically independent samples are shown for baseline and D7-CAR-negative samples, respectively. b, Fraction of cells which were CD8+CD4- at baseline, in IPs, and at day 7 in CAR+ and CAR- populations. Boxes show the median, interquartile range, and maximum/minimum values. n=20 baseline, n=30 infusion, n=29 day 7 CAR-negative, and n=29 day 7 CAR-positive independent samples are shown from 31 patients. c, Flow-cytometric measurements for the mean fraction of CAR positive cells which were CD8+CD4- at day 7 for n=27 biologically independent samples. Error bars represent standard deviation. P-values represent two-tailed Mann -Whitney U tests. d, Changes in CD8+ frequencies between IP and day 7 CAR-T cells as shown in Fig. 3b, colored by CD19 status of relapse. Samples with no relapse, or relapse without a biopsy, are grayed out.
Extended Data Fig. 3. Expression of previously proposed axi-cel response genes.
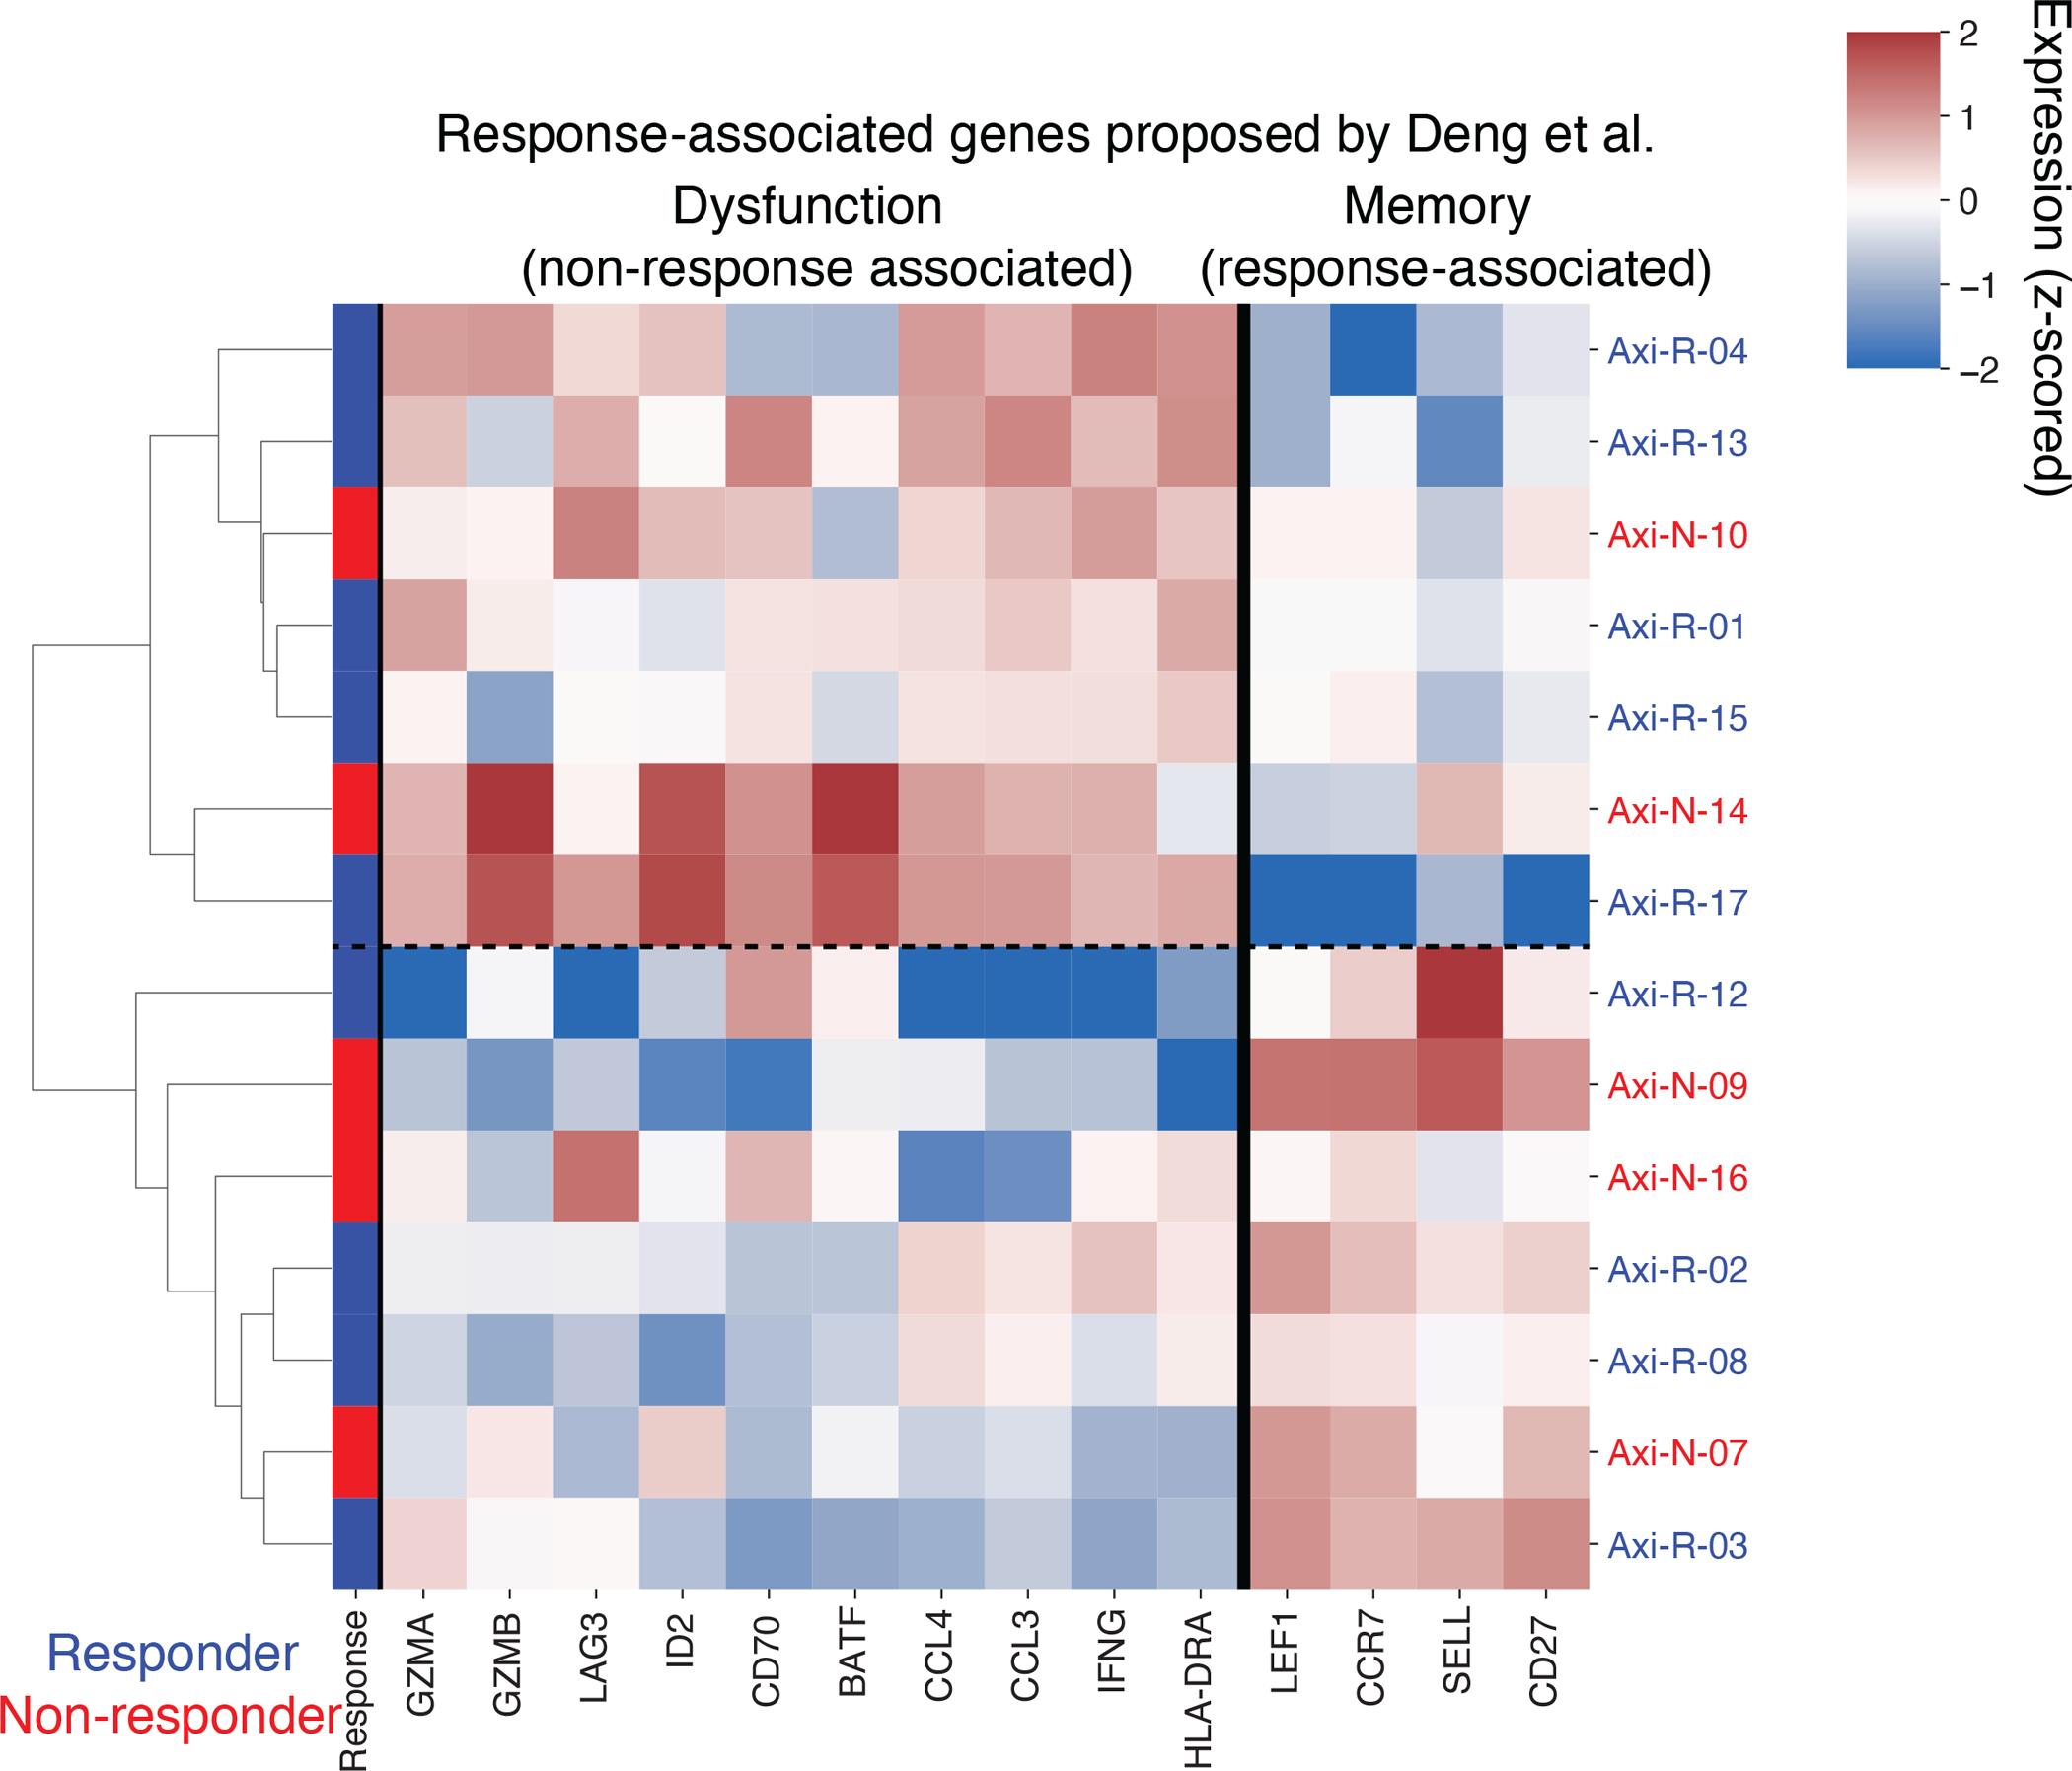
Pseudobulk expression (z-scored log transcripts per million) of CD8+ CAR-T axi-cel IP cells for genes proposed to be response-associated by Deng et al. Fisher Exact test for association between response and denoted two clusters driven by putative memory- and dysfunction-associated genes is p=1.
Extended Data Fig. 4. Detection of CD45 isoforms and T-cell subset classification in 5’ RNA-sequencing data.
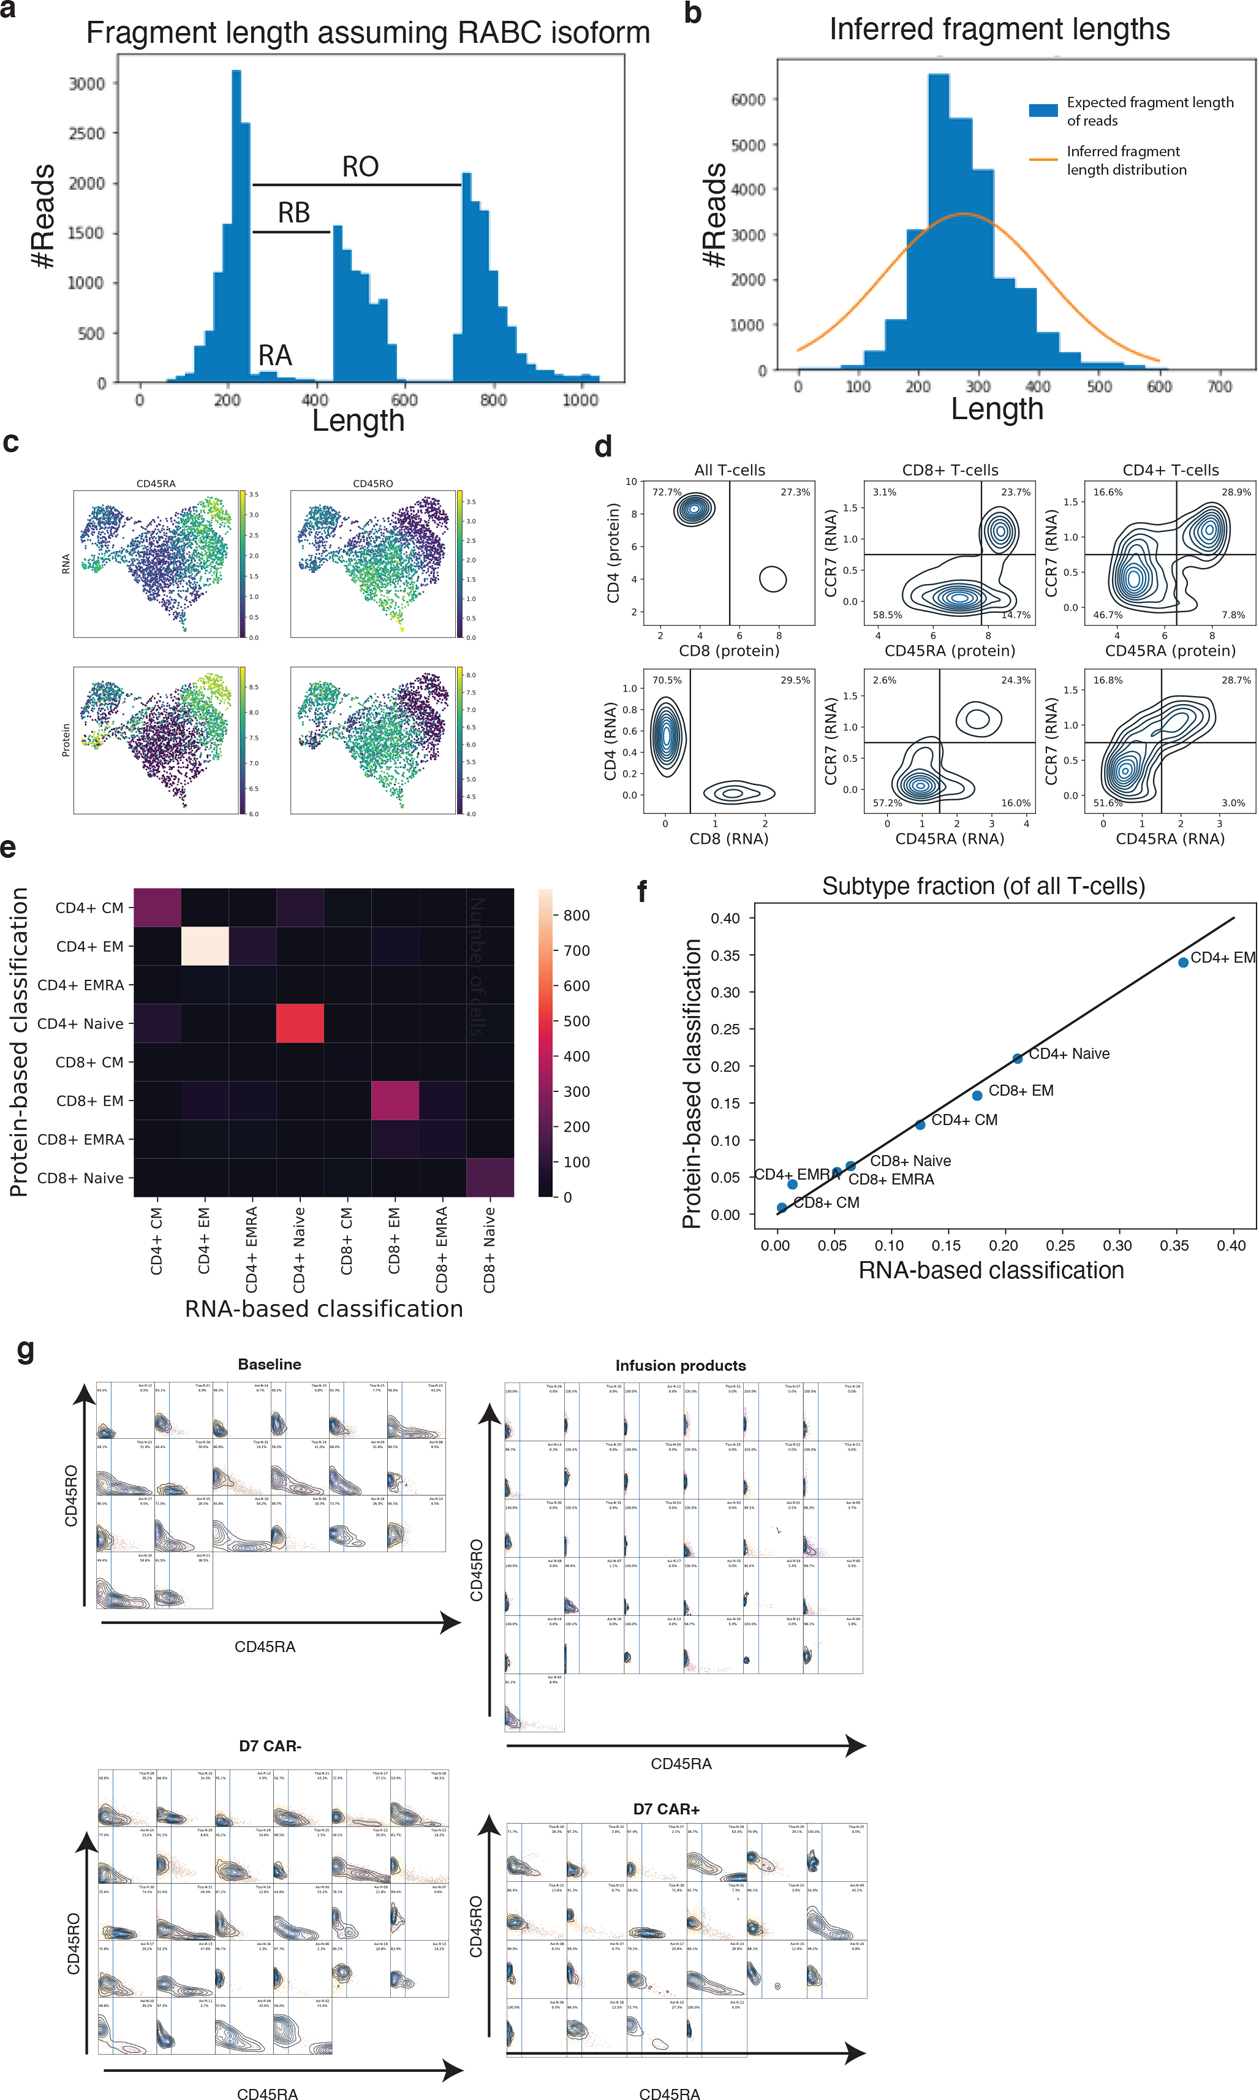
a, Illustration of signal used by CD45 isoform detection model. For each read in an illustrative sample, a histogram of the fragment length assuming no splicing (RABC isoform) is shown. The distribution of reads beyond exon 3 become shifted if they come from an isoform lacking an upstream exon. b, A histogram of the expected fragment length after inference of each read is shown for the same sample in blue. The gaussian distribution modeling fragment lengths inferred by EM is plotted in orange. c, U-MAP representation of T-cells in 10x healthy PBMC demonstration dataset with both RNA-sequencing and feature-barcoding measurements. Dataset is colored by CD45RA and CD45RO expression measured by RNA (top, with k=20 knn smoothing as applied in the paper) and feature barcoding (bottom). d, Kernel density estimate plots sorting plots of cells into different memory subsets. Black lines represent cutoff used for gating. e, Confusion matrix showing concordance of cell classification by protein-based and RNA-based approaches. f, Scatterplot showing similarity of cell fraction measurements using either the RNA-based (x-axis) or protein-based (y-axis) measurements. g, Kernel density estimate distributions of knn-smoothed (k=20) CD45RA (x-axis) and CD45RO (y-axis) expression measurements in our dataset for Baseline T-cells, Infusion products, day 7 CAR− cells and day 7 CAR+ cells. A plot is shown for each sample, and the CD45RA cutoff used for classification is drawn with a blue line. All plots share x and y axis scales.
Extended Data Fig. 5. Classification of T cell subtypes.
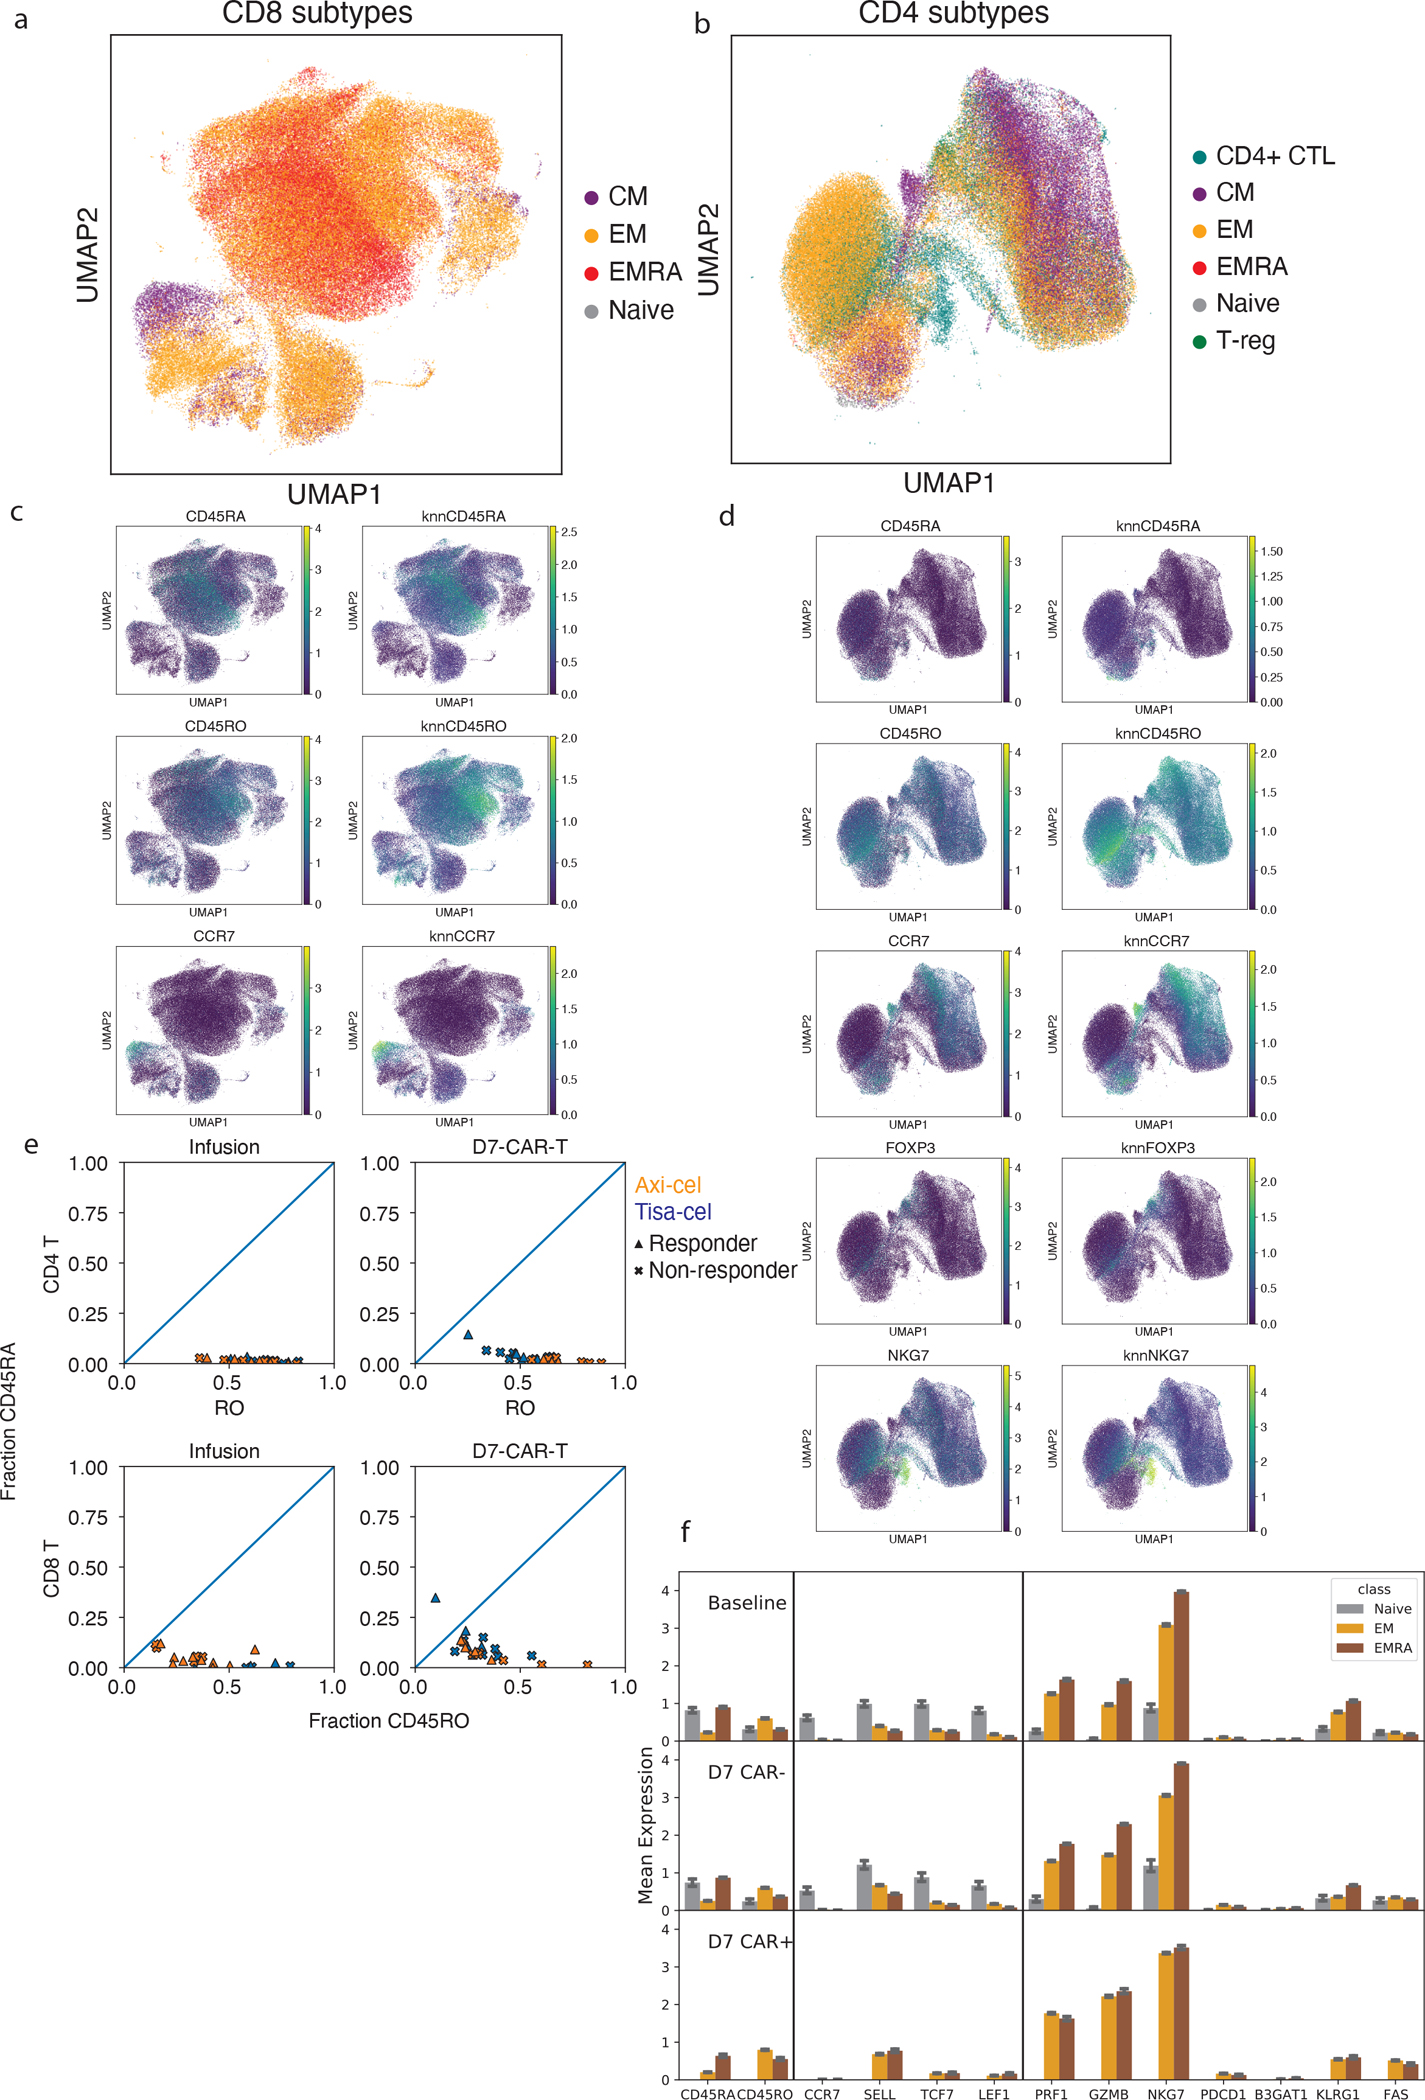
UMAP representations of all a, CD8 and b, CD4 T cells colored by their subtype assignment. Expression of marker genes used for subtype assignment for c, CD8 and d, CD4 cells. For each a knn-smoothed (k=25) estimate is shown (right) alongside the raw measurements (left). e, Estimated fractions of CD45 isoforms that are RO (x-axis) or RA (y-axis) in CAR-T cells from infusion products and at day 7. f, Mean expression of genes related to differentiation state averaged across Naive, EM and TEMRA cells for Baseline T-cells, day 7 CAR-T cells. Naive cells for day 7 CAR+ were omitted as they were not seen in quantities that could be analyzed. Error bars represent 95% confidence intervals derived from bootstrapping cells for 1000 iterations. Shown are n=20,361 baseline (12,799 EM, 7,108 TEMRA, and 454 Naive) cells from 20 individuals, as well as n=46,750 day 7 CAR-negative (24,436 EM, 22,064 TEMRA, and 250 Naive), and n=10,010 day 7 CAR-positive (8,712 EM and 1,298 TEMRA) T-cells from 29 individuals.
Extended Data Fig. 6. CAR-T subclusters and clonal dynamics.
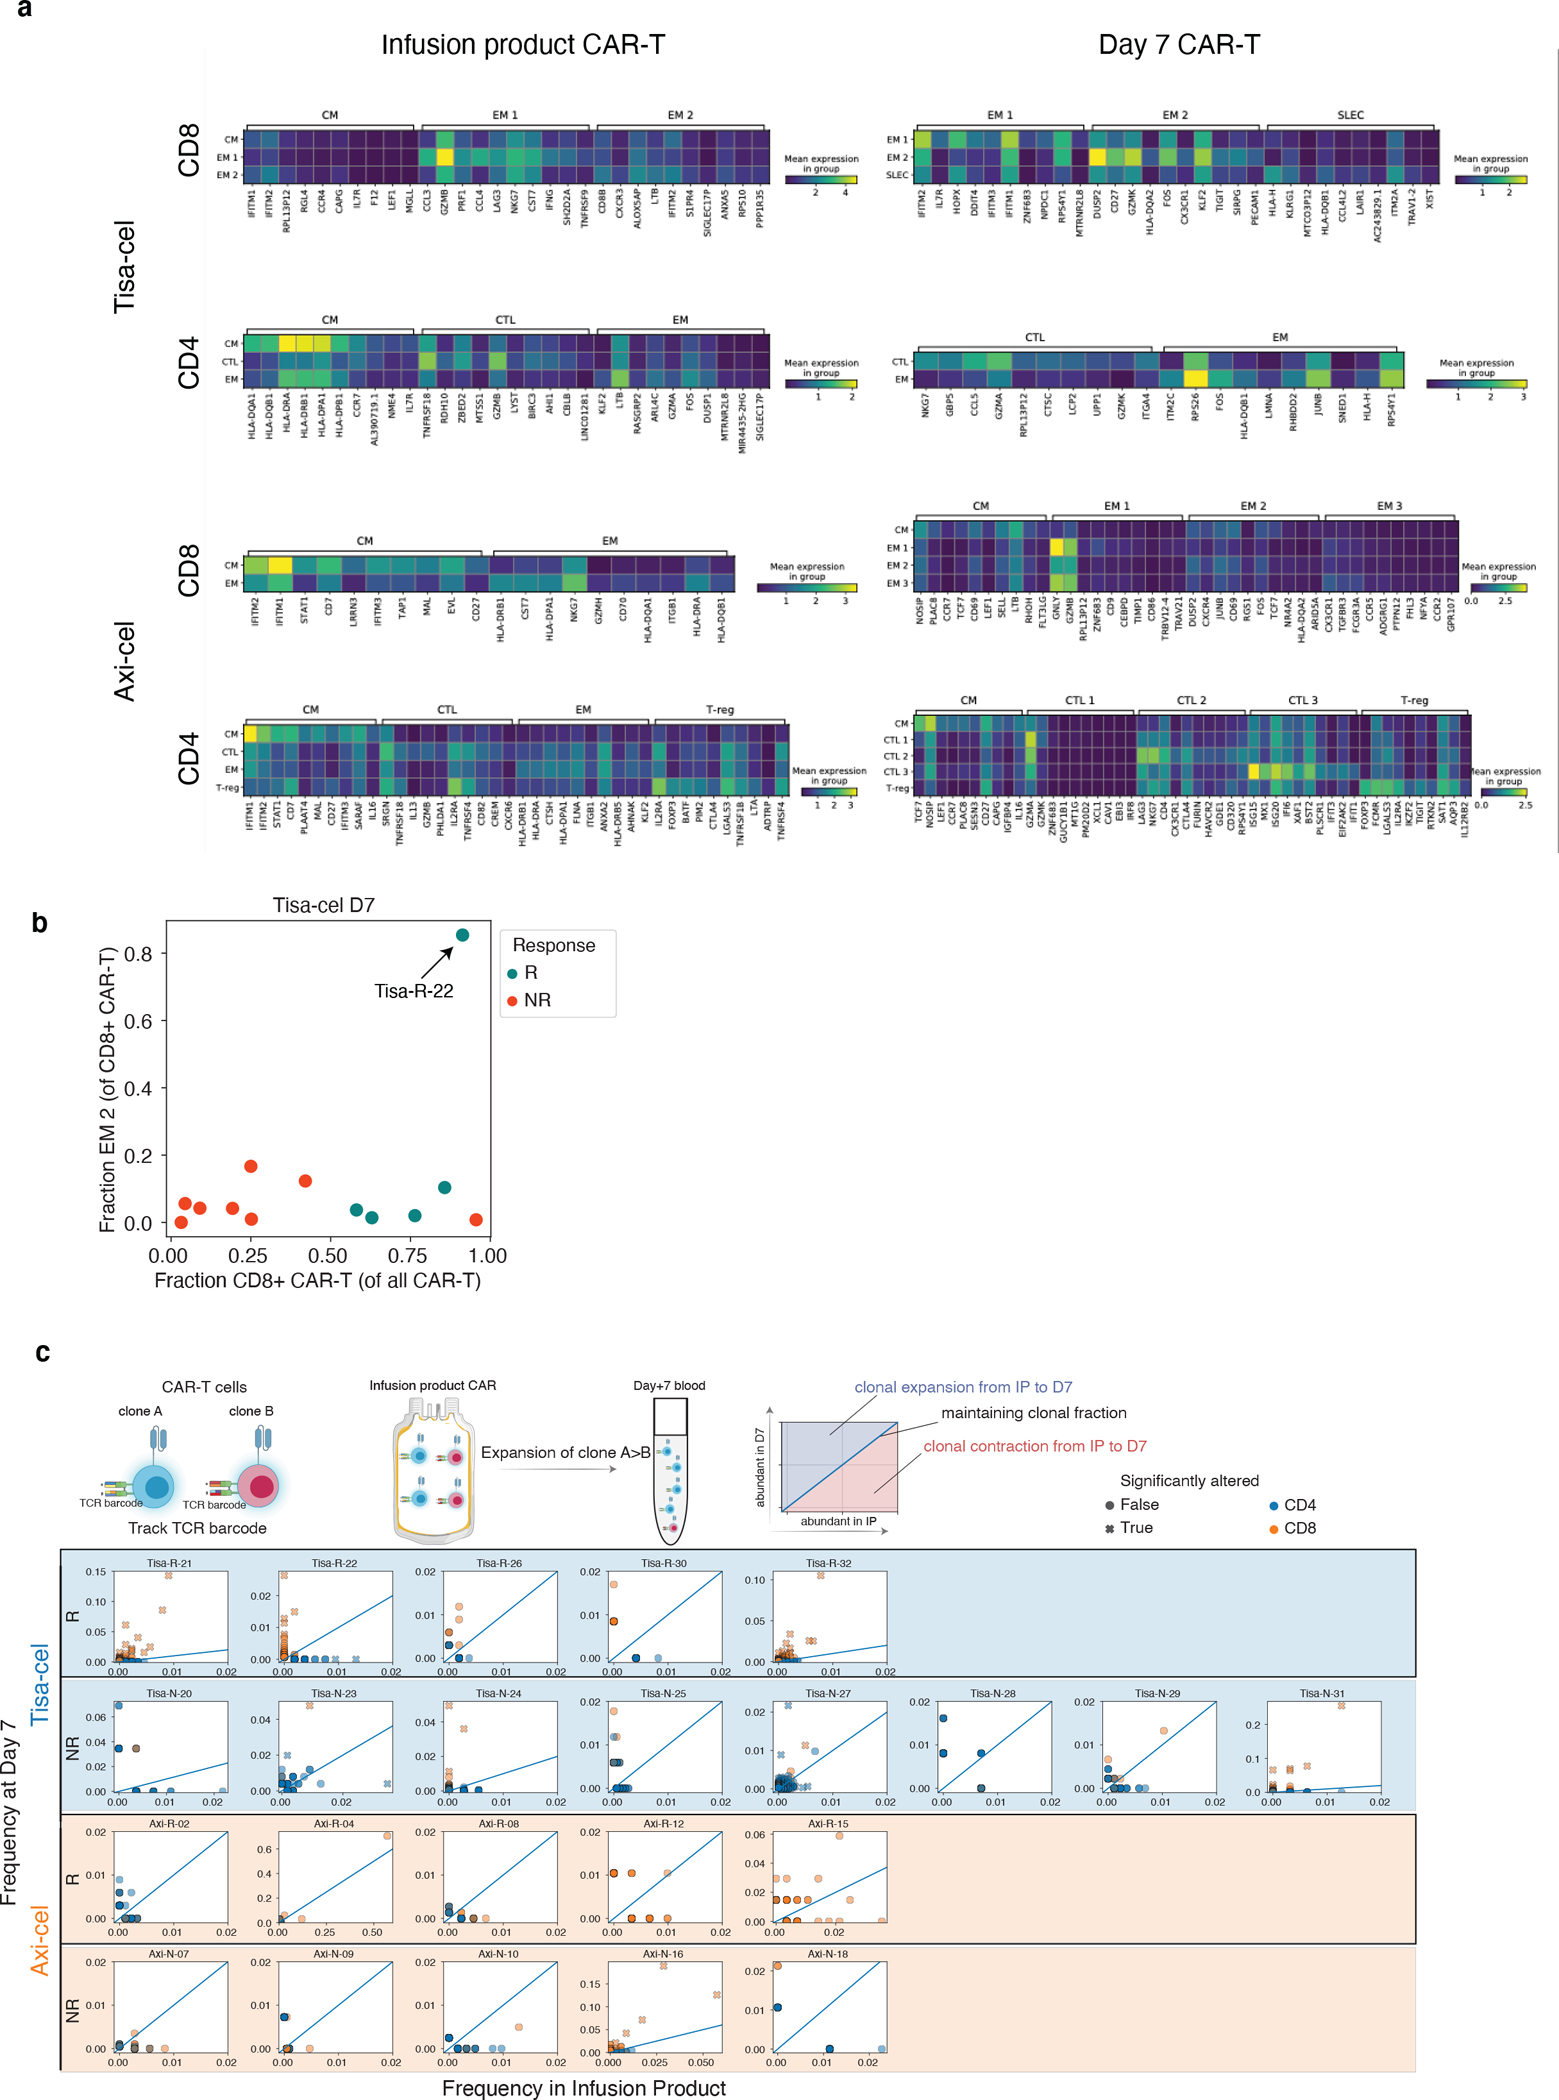
a, Top differentially expressed genes in each CAR-T subcluster, as determined by a t-test. The expression is shown for the top 10 marker genes of each cluster displayed in Figure 4a. b, Demonstration of unique tisa-cel responder with CD8+ cells in cluster EM 2. Shown is a scatter plot of the fraction of CD8+ cells in cluster EM 2 (y-axis) vs the fraction of all CAR-T cells that are CD8+ (x-axis). c, For each patient with at least 25 T cells in both the IP and at day 7, individual TCR clones are plotted by their frequency in the IP (x-axis) and at day 7 (y-axis). Clones are colored by whether they are CD8+ or CD4+, and denoted with an “x” if the two timepoint frequencies are significantly different by a two-tailed fisher exact test p<0.05.
Extended Data Fig. 7. Regulatory T-cells characteristics and in vitro suppression.
a, The fraction of T-cells that are T-regs in samples of each timepoint, separated by CAR+ and CAR- cells. Only samples with at least 100 T-cells of the relevant type are included in the analysis. A total of n=20 baseline, n=27 Infusion CAR-negative, n=27 Infusion CAR-positive, n=28 day 7 CAR-negative and n=22 day 7 CAR-positive biologically independent samples are shown. P-values denote a two-tailed t-test without correction for multiple hypotheses. Boxes show the median, interquartile range, and maximum/minimum values. b, Average expression in IP T-regs (orange) and all other T-cells (T-conv, blue) of the top 10 differentially expressed genes comparing T-regs and T-convs in IP cells. Genes classically associated with T-reg function are highlighted with arrows. c. Schematic for T-reg and CD4 control population isolation from healthy donor PBMC. d, CAR constructs used to identify CAR-Treg/CD4-CAR cells from CAR-Tconv. e,f, CFSE staining of CAR-Tconv cells co-cultured with either 25% CAR-Tregs or CD4-CAR control cells and stimulated at a 1:1 ratio with Jeko tumor targets at 72 hours. Dividing cells (red) are identified relative to unstimulated condition (blue). Each histogram represents an individual replicate, summarized in the plot on the right for all n=3 technical replicates per construct over 1 independent experiment. P-value represents two-tailed unpaired t-test.
Extended Data Fig. 8. Mediation of relapse by CAR-Tregs at 25%via in vivo validation experiments.
a, NSG mice were injected with 1 × 10⁶ Jeko-CBG lymphoma cells on day −7. On day 0 mice were injected with 1 × 10⁶ CAR-T cells representing 100% CAR-T convs or 75% CAR-Tconvs with either 25% CAR-Tregs or 25% CD4-CAR-T control cells. Experiment performed with CD19-CD28 (left) or CD19–4-1BB (right) constructs. b,c Time course tumor radiance (photons/sec/cm2/sr). d,e Flow cytometric quantification of CAR-Tconv day 14 after CAR injection for n =15 biologically independent animals per construct examined over 1 independent experiment. P-value represents two-tailed unpaired t-test. f,g Time course flux (photons/s). Mean ± SEM overlayed on individual subject curves for n =14 biologically independent animals per construct examined over 1 independent experiment. P-value represents the result of two-way ANOVA.. h,i Representative immunohistochemical staining for human CD3 in the spleen. j,k Flow cytometric quantification of CD3 cells from the spleens of the indicated conditions for n=15 (CD28) and n=14 (4–1BB) biologically independent animals examined over 1 independent experiment. P-value represents two-tailed unpaired t-test.
Extended Data Fig. 9. Changes in PBMC populations in patient treated with second infusion of tisa-cel.
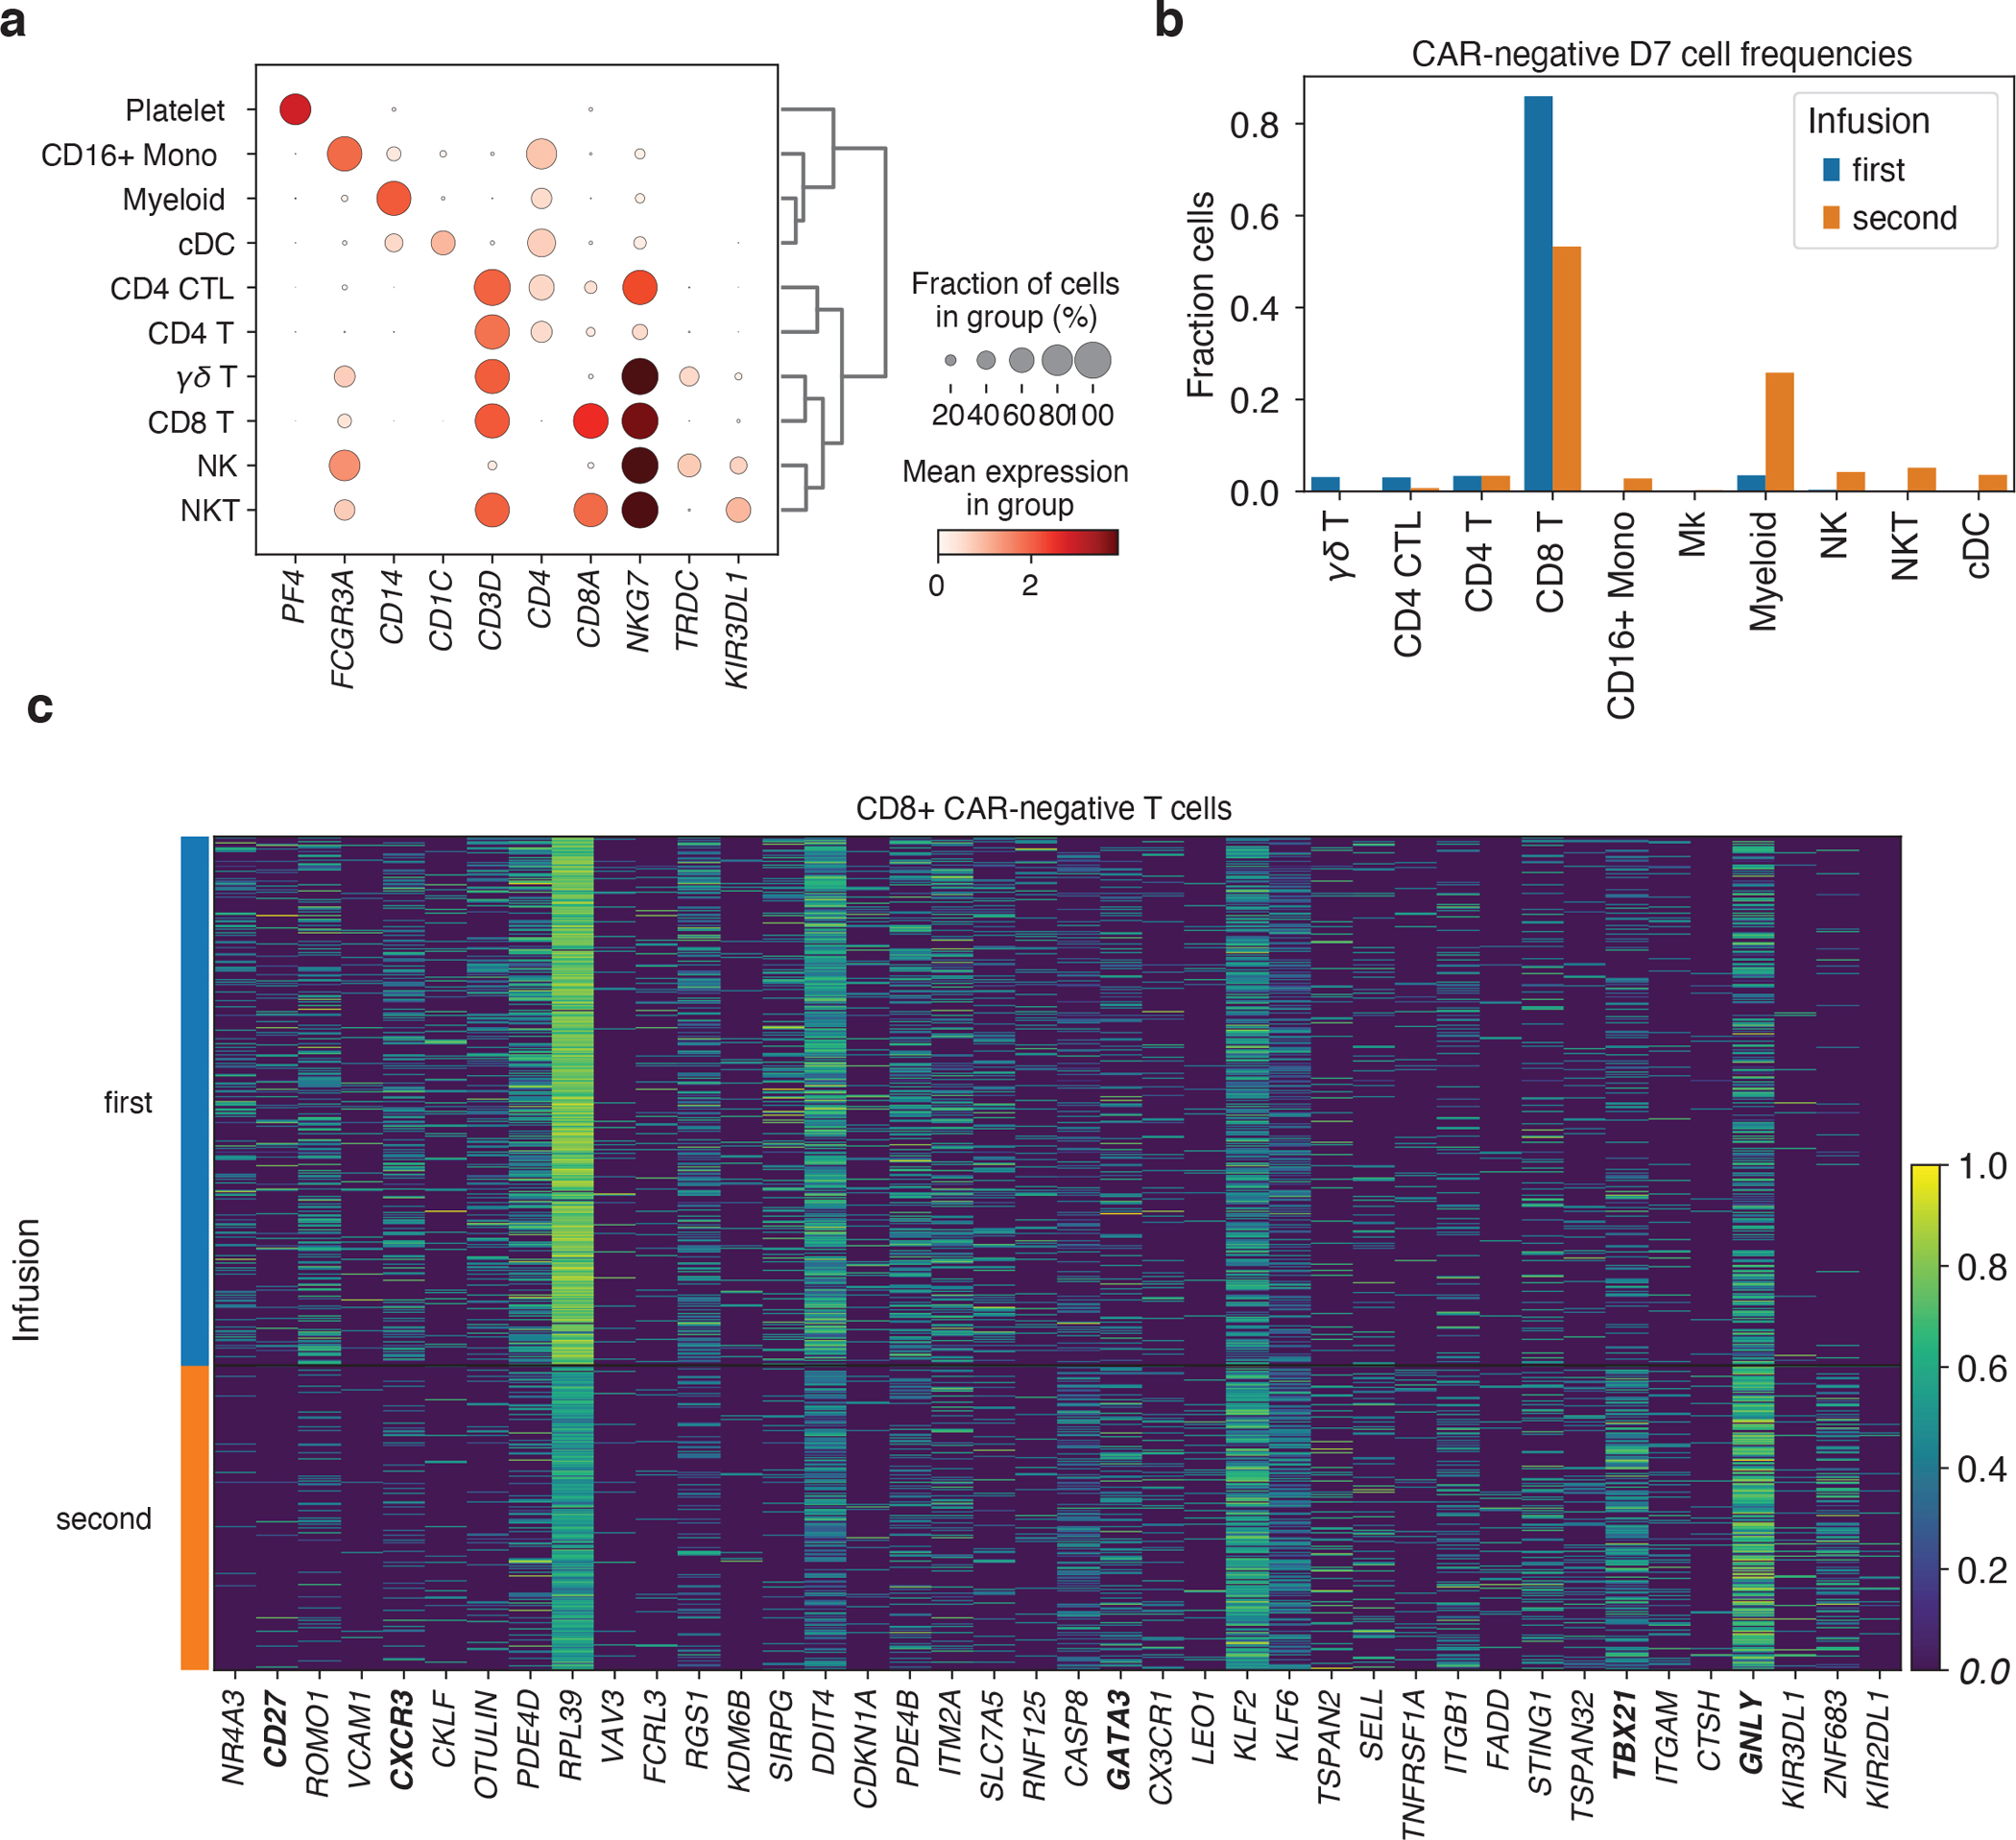
a, Expression of marker genes for PBMC cell type classification. b, Fractions of day 7 CAR-negative cells falling into each cell type cluster, stratified by first and second infusion. c, Top 20 genes differentially increased and decreased (by Mann-Whitney U test) comparing CD8+ CAR-negative T cells between the first and second treatments at day 7.
Extended Data Fig. 10. Summary of cellular and transcriptomic changes associated with clinical outcome and timepoint.
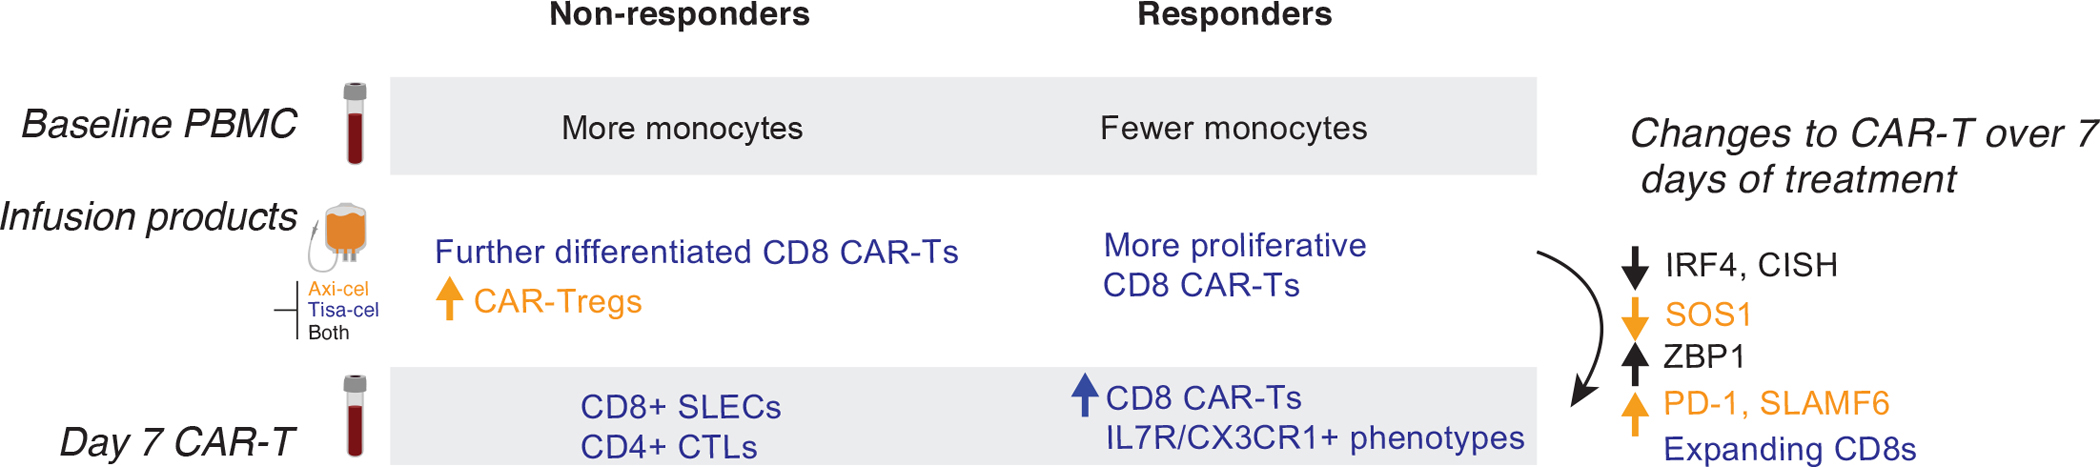
Graphic depicting the cellular associations of response and temporal changes identified in this study.
Supplementary Material
Acknowledgements:
We thank Nena Berg, Mary O’Reilly, and the rest of the Broad Institute Patterns team for their contributions to the figure design. This work was partially supported by the Broad/IBM Cancer Resistance Research Project (PIs: G.G., L.P.) and by NIH R01CA252940 (PIs: M.V.M. and G.G.). A special thank you to Dr. Silvia Arrom and Mr. David Oran for their thoughtful donation which helped to support a portion of this work. N.J.H. was partially funded by the Landry Cancer Biology Consortium fellowship. S.L. is supported by the NCI Research Specialist Award (R50CA251956). R.C.L. is supported by NIH T32 AI007529. Biorender.com was utilized for a portion of some figures.
Footnotes
Competing Interests Statement
N.J.H. is a consultant for MorphoSys. C.J.W. holds equity in BioNTech Inc and receives research funding from Pharmacyclics. S.H.G. holds patents related to adoptive cell therapies, held by University College London and Novalgen Limited. S.H.G. provides consultancy to Novalgen Ltd. G.G. receives research funds from IBM and Pharmacyclics, and is an inventor on patent applications related to MSMuTect, MSMutSig, MSIDetect, POLYSOLVER and SignatureAnalyzer-GPU. G.G. is a founder, consultant and holds privately held equity in Scorpion Therapeutics. M.V.M., M.B.L., and R.C.L. are inventors on patents related to adoptive cell therapies, held by Massachusetts General Hospital. M.V.M. is also an inventor on patents related to CAR-T cell therapies held by the University of Pennsylvania (some licensed to Novartis). M.V.M. is on the Board of Directors of 2SeventyBio, and holds equity in TCR2, Century Therapeutics, Oncternal, and Neximmune, and has served as a consultant for multiple companies involved in cell therapies. The remaining authors declare no competing interests.
Peer review information:
Primary Handling editors: Saheli Sadanand and Joao Monteiro, in collaboration with the Nature Medicine team
Peer review information:
Nature Medicine thanks Sattva Neelapu and the other, anonymous, reviewer(s) for their contribution to the peer review of this work.
References
- 1.Maude SL et al. Chimeric Antigen Receptor T Cells for Sustained Remissions in Leukemia. N. Engl. J. Med. 371, 1507–1517 (2014). [DOI] [PMC free article] [PubMed] [Google Scholar]
- 2.Schuster SJ et al. Chimeric Antigen Receptor T Cells in Refractory B-Cell Lymphomas. N. Engl. J. Med. 377, 2545–2554 (2017). [DOI] [PMC free article] [PubMed] [Google Scholar]
- 3.Singh N et al. Impaired Death Receptor Signaling in Leukemia Causes Antigen-Independent Resistance by Inducing CAR T-cell Dysfunction. Cancer Discov. 10, 552–567 (2020). [DOI] [PMC free article] [PubMed] [Google Scholar]
- 4.Dufva O et al. Integrated drug profiling and CRISPR screening identify essential pathways for CAR T-cell cytotoxicity. Blood 135, 597–609 (2020). [DOI] [PMC free article] [PubMed] [Google Scholar]
- 5.Orlando EJ et al. Genetic mechanisms of target antigen loss in CAR19 therapy of acute lymphoblastic leukemia. Nat. Med. 24, 1504–1506 (2018). [DOI] [PubMed] [Google Scholar]
- 6.Das RK, Vernau L, Grupp SA & Barrett DM Naïve T-cell Deficits at Diagnosis and after Chemotherapy Impair Cell Therapy Potential in Pediatric Cancers. Cancer Discov. 9, 492–499 (2019). [DOI] [PMC free article] [PubMed] [Google Scholar]
- 7.Fraietta JA et al. Determinants of response and resistance to CD19 chimeric antigen receptor (CAR) T cell therapy of chronic lymphocytic leukemia. Nat. Med. 24, 563–571 (2018). [DOI] [PMC free article] [PubMed] [Google Scholar]
- 8.Cappell KM & Kochenderfer JN A comparison of chimeric antigen receptors containing CD28 versus 4–1BB costimulatory domains. Nat. Rev. Clin. Oncol. 18, 715–727 (2021). [DOI] [PubMed] [Google Scholar]
- 9.Plaks V et al. CD19 target evasion as a mechanism of relapse in large B-cell lymphoma treated with axicabtagene ciloleucel. Blood 138, 1081–1085 (2021). [DOI] [PMC free article] [PubMed] [Google Scholar]
- 10.Deng Q et al. Characteristics of anti-CD19 CAR T cell infusion products associated with efficacy and toxicity in patients with large B cell lymphomas. Nat. Med. 26, 1878–1887 (2020). [DOI] [PMC free article] [PubMed] [Google Scholar]
- 11.Squair JW et al. Confronting false discoveries in single-cell differential expression. Nat. Commun. 12, 1–15 (2021). [DOI] [PMC free article] [PubMed] [Google Scholar]
- 12.Boroughs AC et al. A Distinct Transcriptional Program in Human CAR T Cells Bearing the 4–1BB Signaling Domain Revealed by scRNA-Seq. Mol. Ther. 28, 2577–2592 (2020). [DOI] [PMC free article] [PubMed] [Google Scholar]
- 13.Zhao Z et al. Structural Design of Engineered Costimulation Determines Tumor Rejection Kinetics and Persistence of CAR T Cells. Cancer Cell 28, 415–428 (2015). [DOI] [PMC free article] [PubMed] [Google Scholar]
- 14.Salter AI et al. Phosphoproteomic analysis of chimeric antigen receptor signaling reveals kinetic and quantitative differences that affect cell function. Sci. Signal. 11, (2018). [DOI] [PMC free article] [PubMed] [Google Scholar]
- 15.Lindner SE, Johnson SM, Brown CE & Wang LD Chimeric antigen receptor signaling: Functional consequences and design implications. Sci Adv 6, eaaz3223 (2020). [DOI] [PMC free article] [PubMed] [Google Scholar]
- 16.Yigit B et al. SLAMF6 as a Regulator of Exhausted CD8+ T Cells in Cancer. Cancer Immunol Res 7, 1485–1496 (2019). [DOI] [PubMed] [Google Scholar]
- 17.Wang Y et al. Low-dose decitabine priming endows CAR T cells with enhanced and persistent antitumour potential via epigenetic reprogramming. Nat. Commun. 12, 1–18 (2021). [DOI] [PMC free article] [PubMed] [Google Scholar]
- 18.Yang D et al. ZBP1 mediates interferon-induced necroptosis. Cell. Mol. Immunol. 17, 356–368 (2019). [DOI] [PMC free article] [PubMed] [Google Scholar]
- 19.Zhan Y, Carrington EM, Zhang Y, Heinzel S & Lew AM Life and Death of Activated T Cells: How Are They Different from Naïve T Cells? Front. Immunol. 8, 1809 (2017). [DOI] [PMC free article] [PubMed] [Google Scholar]
- 20.Seo H et al. BATF and IRF4 cooperate to counter exhaustion in tumor-infiltrating CAR T cells. Nat. Immunol. 22, 983–995 (2021). [DOI] [PMC free article] [PubMed] [Google Scholar]
- 21.Palmer DC et al. Cish actively silences TCR signaling in CD8+ T cells to maintain tumor tolerance. J. Exp. Med. 212, 2095–2113 (2015). [DOI] [PMC free article] [PubMed] [Google Scholar]
- 22.Büttner M, Ostner J, Müller CL, Theis FJ & Schubert B scCODA is a Bayesian model for compositional single-cell data analysis. Nat. Commun. 12, 1–10 (2021). [DOI] [PMC free article] [PubMed] [Google Scholar]
- 23.Jain MD et al. Tumor interferon signaling and suppressive myeloid cells are associated with CAR T-cell failure in large B-cell lymphoma. Blood 137, 2621–2633 (2021). [DOI] [PMC free article] [PubMed] [Google Scholar]
- 24.Tirosh I et al. Dissecting the multicellular ecosystem of metastatic melanoma by single-cell RNA-seq. Science 352, 189–196 (2016). [DOI] [PMC free article] [PubMed] [Google Scholar]
- 25.Kafri R et al. Dynamics extracted from fixed cells reveal feedback linking cell growth to cell cycle. Nature 494, 480–483 (2013). [DOI] [PMC free article] [PubMed] [Google Scholar]
- 26.Neelapu SS et al. Axicabtagene Ciloleucel CAR T-Cell Therapy in Refractory Large B-Cell Lymphoma. N. Engl. J. Med. 377, 2531–2544 (2017). [DOI] [PMC free article] [PubMed] [Google Scholar]
- 27.Talleur A et al. Preferential expansion of CD8+ CD19-CAR T cells postinfusion and the role of disease burden on outcome in pediatric B-ALL. Blood Adv (2022) doi: 10.1182/bloodadvances.2021006293. [DOI] [PMC free article] [PubMed] [Google Scholar]
- 28.Monfrini C et al. Phenotypic composition of commercial anti-CD19 CAR-T cells affects in vivo expansion and disease response in large B-cell lymphoma patients. Clin. Cancer Res. (2022) doi: 10.1158/1078-0432.CCR-22-0164. [DOI] [PMC free article] [PubMed] [Google Scholar]
- 29.Martin MD & Badovinac VP Defining Memory CD8 T Cell. Front. Immunol. 9, 2692 (2018). [DOI] [PMC free article] [PubMed] [Google Scholar]
- 30.Sakaguchi S, Yamaguchi T, Nomura T & Ono M Regulatory T Cells and Immune Tolerance. Cell 133, 775–787 (2008). [DOI] [PubMed] [Google Scholar]
- 31.Lee JC et al. In vivo inhibition of human CD19-targeted effector T cells by natural T regulatory cells in a xenotransplant murine model of B cell malignancy. Cancer Res. 71, 2871–2881 (2011). [DOI] [PMC free article] [PubMed] [Google Scholar]
- 32.Todo S et al. A pilot study of operational tolerance with a regulatory T-cell-based cell therapy in living donor liver transplantation. Hepatology 64, 632–643 (2016). [DOI] [PubMed] [Google Scholar]
- 33.Chandran S et al. Polyclonal Regulatory T Cell Therapy for Control of Inflammation in Kidney Transplants. Am. J. Transplant 17, 2945–2954 (2017). [DOI] [PMC free article] [PubMed] [Google Scholar]
- 34.Boroughs AC et al. Chimeric antigen receptor costimulation domains modulate human regulatory T cell function. JCI Insight 5, (2019). [DOI] [PMC free article] [PubMed] [Google Scholar]
- 35.Togashi Y, Shitara K & Nishikawa H Regulatory T cells in cancer immunosuppression — implications for anticancer therapy. Nat. Rev. Clin. Oncol. 16, 356–371 (2019). [DOI] [PubMed] [Google Scholar]
- 36.Khan O et al. TOX transcriptionally and epigenetically programs CD8+ T cell exhaustion. Nature 571, 211–218 (2019). [DOI] [PMC free article] [PubMed] [Google Scholar]
- 37.Schuster SJ et al. Tisagenlecleucel in Adult Relapsed or Refractory Diffuse Large B-Cell Lymphoma. N. Engl. J. Med. 380, 45–56 (2019). [DOI] [PubMed] [Google Scholar]
- 38.Shah NN & Fry TJ Mechanisms of resistance to CAR T cell therapy. Nat. Rev. Clin. Oncol. 16, 372–385 (2019). [DOI] [PMC free article] [PubMed] [Google Scholar]
- 39.Brown CE & Mackall CL CAR T cell therapy: inroads to response and resistance. Nat. Rev. Immunol. 19, 73–74 (2019). [DOI] [PubMed] [Google Scholar]
- 40.Larson RC & Maus MV Recent advances and discoveries in the mechanisms and functions of CAR T cells. Nat. Rev. Cancer 21, 145–161 (2021). [DOI] [PMC free article] [PubMed] [Google Scholar]
- 41.Zhang J et al. A Review of Two Regulatory Approved Anti-CD19 CAR T-Cell Therapies in Diffuse Large B-Cell Lymphoma: Why Are Indirect Treatment Comparisons Not Feasible? Adv. Ther. 37, 3040–3058 (2020). [DOI] [PMC free article] [PubMed] [Google Scholar]
- 42.Gauthier J et al. Factors associated with outcomes after a second CD19-targeted CAR T-cell infusion for refractory B-cell malignancies. Blood 137, 323–335 (2021). [DOI] [PMC free article] [PubMed] [Google Scholar]
- 43.Derman BA et al. Regulatory T-cell depletion in the setting of autologous stem cell transplantation for multiple myeloma: pilot study. J Immunother Cancer 8, (2020). [DOI] [PMC free article] [PubMed] [Google Scholar]
- 44.Golab K et al. Challenges in cryopreservation of regulatory T cells (Tregs) for clinical therapeutic applications. Int. Immunopharmacol. 16, 371–375 (2013). [DOI] [PubMed] [Google Scholar]
- 45.Florek M et al. Freeze and Thaw of CD4+CD25+Foxp3+ Regulatory T Cells Results in Loss of CD62L Expression and a Reduced Capacity to Protect against Graft-versus-Host Disease. PLoS One 10, e0145763 (2015). [DOI] [PMC free article] [PubMed] [Google Scholar]
- 46.Gołąb K et al. Cell banking for regulatory T cell-based therapy: strategies to overcome the impact of cryopreservation on the Treg viability and phenotype. Oncotarget 9, 9728–9740 (2018). [DOI] [PMC free article] [PubMed] [Google Scholar]
- 47.Melenhorst JJ et al. Decade-long leukaemia remissions with persistence of CD4+ CAR T cells. Nature 602, 503–509 (2022). [DOI] [PMC free article] [PubMed] [Google Scholar]
- 48.Ritchie ME et al. limma powers differential expression analyses for RNA-sequencing and microarray studies. Nucleic Acids Res. 43, e47–e47 (2015). [DOI] [PMC free article] [PubMed] [Google Scholar]
- 49.Cheson BD et al. Revised response criteria for malignant lymphoma. J. Clin. Oncol. 25, 579–586 (2007). [DOI] [PubMed] [Google Scholar]
- 50.Tirkes T et al. Response criteria in oncologic imaging: review of traditional and new criteria. Radiographics 33, 1323–1341 (2013). [DOI] [PubMed] [Google Scholar]
- 51.Abramson JS et al. Lisocabtagene maraleucel for patients with relapsed or refractory large B-cell lymphomas (TRANSCEND NHL 001): a multicentre seamless design study. Lancet 396, 839–852 (2020). [DOI] [PubMed] [Google Scholar]
- 52.June CH, Levine BL, Porter DL, Kalos MD & Milone MC Use of chimeric antigen receptor-modified t cells to treat cancer. European Patent (2017). [Google Scholar]
- 53.Kochenderfer JN et al. Construction and preclinical evaluation of an anti-CD19 chimeric antigen receptor. J. Immunother. 32, 689–702 (2009). [DOI] [PMC free article] [PubMed] [Google Scholar]
- 54.Wolf FA, Angerer P & Theis FJ SCANPY: large-scale single-cell gene expression data analysis. Genome Biol. 19, 15 (2018). [DOI] [PMC free article] [PubMed] [Google Scholar]
- 55.Wolock SL, Lopez R & Klein AM Scrublet: Computational Identification of Cell Doublets in Single-Cell Transcriptomic Data. Cell Systems 8, 281–291.e9 (2019). [DOI] [PMC free article] [PubMed] [Google Scholar]
- 56.Pachter L Models for transcript quantification from RNA-Seq. (2011).
- 57.Traag VA, Waltman L & van Eck NJ From Louvain to Leiden: guaranteeing well-connected communities. Sci. Rep. 9, 1–12 (2019). [DOI] [PMC free article] [PubMed] [Google Scholar]
Associated Data
This section collects any data citations, data availability statements, or supplementary materials included in this article.
Supplementary Materials
Data Availability Statement
Gene expression matrices from the scRNA data have been deposited to the Gene Expression Omnibus (GEO accession GSE197268). Raw sequencing data is available on the database of Genotypes and Phenotypes (phs002922.v1.p1). Data from a prior study of axi-cel infusion products is available on GEO at GSE151511.