

Abstract
Background:
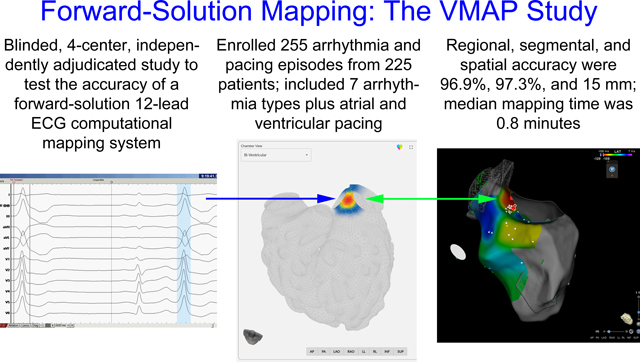
The accuracy of noninvasive arrhythmia source localization using a forward solution computational mapping system has not yet been evaluated in blinded, multicenter analysis. This study tested the hypothesis that a computational mapping system incorporating a comprehensive arrhythmia simulation library would provide accurate localization of the site of origin for atrial and ventricular arrhythmias and pacing using 12-lead ECG data when compared with the gold standard of invasive electrophysiology study and ablation.
Methods:
The VMAP study was a blinded, multicenter evaluation with final data analysis performed by an independent core laboratory. Eligible episodes included atrial and ventricular: tachycardia (VT), fibrillation, pacing, premature complexes (PACs and PVCs); and orthodromic atrioventricular reentrant tachycardia. Mapping system results were compared with the gold standard site of successful ablation or pacing during electrophysiology study and ablation. Mapping time was assessed from time-stamped logs. Pre-specified performance goals were used for statistical comparisons.
Results:
A total of 255 episodes from 225 patients were enrolled from 4 centers. Regional accuracy for VT and PVCs in patients without significant structural heart disease (n=75, primary endpoint) was 98.7% (95% CI: 96.0–100%, p<0.001 to reject predefined H0 <0.80). Regional accuracy for all episodes (secondary endpoint 1) was 96.9% (95% CI: 94.7–99.0%, p<0.001 to reject predefined H0 <0.75). Accuracy for the exact or neighboring segment for all episodes (secondary endpoint 2) was 97.3% (95% CI: 95.2–99.3%, p<0.001 to reject predefined H0 <0.70). Median spatial accuracy was 15 mm (n=255, IQR: 7 – 25 mm). The mapping process was completed in a median of 0.8 minutes (IQR: 0.4 – 1.4 minutes).
Conclusions:
Computational ECG mapping using a forward-solution approach exceeded prespecified accuracy goals for arrhythmia and pacing localization. Spatial accuracy analysis demonstrated clinically actionable results. This rapid, non-invasive mapping technology may facilitate catheter-based and noninvasive targeted arrhythmia therapies.
Keywords: Electrophysiology, Noninvasive Arrhythmia Mapping, Computational Modeling
Graphical Abstract
Background
Intracardiac localization of arrhythmia sources and pacing is essential for the care of electrophysiology patients. Such information may be used to facilitate catheter-based mapping and ablation, determine the location of pacing catheters or pacemaker leads, or to help plan stereotactic ablative radiotherapy1. At present, the most common approaches for site-of-origin analysis involve visual interpretation of the surface ECG2, electrocardiographic imaging3, and invasive catheter mapping4 which may possess limitations in accuracy5, workflow efficiency6, and safety7. A rapid, non-invasive computational tool based upon the 12-lead ECG to assess arrhythmia source and pacing site location would facilitate targeted therapies.
Rapid advancements in computer performance have enabled detailed, physiologically realistic whole-heart simulations of cardiac arrhythmias8, 9 and pacing10. Proof-of-concept work has demonstrated the feasibility of the forward-solution computational mapping approach which compares patient ECG data to a pre-computed set of monodomain model arrhythmia simulations11 to predict sites of origin for refractory ventricular tachycardia1. However, it was uncertain whether such a system could effectively map a spectrum of atrial and ventricular arrhythmias and pacing in patients with and without structural heart disease.
This study tested the hypothesis that a forward-solution, noninvasive mapping system utilizing a comprehensive arrhythmia simulation library would provide accurate localization for nine different atrial and ventricular arrhythmias and pacing using 12-lead ECG data compared with the gold standard of invasive electrophysiology study and ablation.
Methods
The data to support the findings of this study are available from the corresponding author upon reasonable request.
Study Overview
The VMAP (Vectorcardiographic Mapping of Arrhythmogenic Probability) study was a blinded, multicenter clinical study using an independent core laboratory to validate the performance of a forward-solution, noninvasive arrhythmia mapping system in 7 atrial and ventricular arrhythmias plus atrial and ventricular pacing. The study protocol was reviewed and approved by governing Institutional Review Boards at all sites and was conducted in accordance with all applicable human subject research requirements and applicable federal regulations. It consisted of 4 phases (A-D, Figure 1) and was registered on ClinicalTrials.gov (NCT04559061) on September 22, 2020. Please see the Supplemental Methods for additional details.
Figure 1. Study methodology.

Cases are first determined to meet all inclusion and no exclusion criteria (phase A). Electrophysiologist #1 (EP#1) then identifies the 12-lead ECG time segment which contains the target arrhythmia (phase B, top left). Next, EP#1 marks the arrhythmia source or pacing site determined by invasive electrophysiology study (gold standard) on a standard 3-dimensional anatomic model (middle left, red arrow). The ECG and anatomical model with marked arrhythmia or pacing origin are then uploaded into the electronic data capture system. In phase C, cases are randomly assigned to a blinded EP#2, different from EP#1, who marks the ECG (top right, red arrow to blue selected interval) and runs the mapping software to produce the system result (system output, middle right panel, red arrow to hotspot). Mapping system output is then uploaded into the electronic data capture system. In phase D, the core laboratory evaluates the marked anatomic model (gold standard) and system results (system output) to determine accuracy (center bottom panel). All data transfer for the study was performed using a 21 CFR Part 11-compliant electronic data capture system (blue arrows).
Study Design
Four electrophysiology study centers (sites) participated in the study: UC San Diego Health System (UCSD), Mills Peninsula Medical Center (Sutter), Medical University of South Carolina (MUSC), and VA San Diego Health Care (VA). Sites were identified and selected based on qualifying criteria, including volume of targeted cases that met eligibility requirements.
Cases were screened from extant medical records and evaluated to ensure that each dataset met all inclusion criteria and none of the exclusion criteria (phase A). To minimize selection bias, cases were reviewed and identified consecutively in reverse chronological order based on the date of the ablation procedure starting from the date of official site activation. Sites ceased data collection for specific arrhythmia or pacing types once enrollment reached the prespecified number of cases for each type, and overall once study enrollment met or exceeded the target enrollment of 250 samples (please see below for power calculations and determination of sample size), as directed by the study coordinator. Upon documented case eligibility (see below for inclusion and exclusion criteria), the case was assigned a unique identification code and then advanced to study phase B.
Next, the electrophysiologist from the data-originating site (EP#1) identified the digitized ECG segment of interest which contained the target arrhythmia (Figure 1, top left). The electrophysiologist then marked the location or locations of effective ablation or pacing (i.e., the “gold standard”) on a standardized three-dimensional model of four-chamber cardiac anatomy (Figure 1, middle left). If the case was associated with multiple arrhythmia/pacing episodes, the steps were repeated for each episode. Completed arrhythmia/pacing episodes were then uploaded to the 21 CFR Part 11-compliant electronic data capture system (CliniOps, Fremont, CA, USA) and promoted to data processing (phase C).
In phase C, cases were randomly assigned to a blinded electrophysiologist (EP#2), different than the originating physician in phase B, who loaded the ECG into the computational mapping system, marked the target arrhythmia (Figure 1, top right), and ran the software to generate the mapping result for the episode (Figure 1, middle right). The system output, including the mapping hotspot location on the reference geometry, was then uploaded to the electronic data capture system for core laboratory analysis (phase D).
The Cardiovascular Research Foundation (CRF, New York, NY, USA) served as the independent, core laboratory for the study and analyzed results in accordance with the study protocol. CRF compared the gold standard arrhythmia or pacing location from EP#1 versus the mapping system output from EP#2 and determined agreement/non-agreement (Figure 1, bottom center). Center-to-center spatial accuracy and analysis time were computed using automated algorithms for all episodes from uploaded marked anatomical models of arrhythmia source from EP#1, mapping system output from EP#2, and time-stamped analysis logs.
Endpoint Planning and Hierarchical Analysis
This study was planned and statistically powered to assess the primary endpoint, followed by secondary endpoints 1 and 2, stopping if statistical analysis failed to reject the null hypothesis (see below) for pre-specified accuracy goals. Ancillary endpoint analyses were enabled if all primary and secondary endpoints rejected the null hypothesis. Post-hoc analyses were then performed to further investigate performance metrics of interest.
Endpoint Definitions
The primary endpoint was defined as the regional accuracy of the mapping system versus the electrophysiology study-determined site of origin for premature ventricular complexes (PVC) and ventricular tachycardia (VT) in patients without structural heart disease and ventricular scar burden <10% (please see Supplemental Methods for additional endpoint definitions, justification, and details). Secondary endpoint 1 was defined as the regional accuracy for all enrolled episodes. Regions for the primary and secondary endpoint 1 were defined as the following: left atrial or ventricular free wall, atrial or ventricular septum, and right atrial or ventricular free wall.
For the study, we defined 21 atrial segments and 30 ventricular segments based upon prior work12, 13 (Supplemental Figures I and II). Secondary endpoint 2 was defined as the segmental accuracy in correctly identifying the precise or neighboring segment of the arrhythmia source or pacing site for all arrhythmia or pacing episodes. Ancillary endpoint 2 was defined as the segmental accuracy for each of the 9 individual arrhythmia and pacing subtypes.
Ancillary endpoint 3 was defined as the time interval (in minutes) between upload of the digitized ECG into the mapping software and display of the 3-dimensional mapping result. Post-hoc analysis 1 consisted of the spatial accuracy (in mm) between the center of the arrhythmia or pacing origin from EP#1 to the center of the mapping output from EP#2 on a standardized adult heart model1. Post-hoc analysis 2 assessed the accuracy of separating RVOT and LVOT PVCs and VT sources, and post-hoc analyses 3–5 evaluated the accuracy to identify the precise segment of origin for all cases, the precise segment of origin for PVCs and VT originating from any of the LV AHA 17 segments, and the precise segment of origin for PVCs and VT in patients with structural heart disease, respectively.
Mapping Algorithm Details, Verification, and Validation
The computational ECG mapping system compares ECG data from the patient with model-predicted electrograms in a comprehensive library of arrhythmia simulations (Supplemental Figure III) to determine arrhythmia or pacing site of origin. Algorithm methodology and data flow are detailed in Supplemental Methods and Supplemental Figure IV. The arrhythmia library is based on three-dimensional finite element models of monodomain cardiac action potential propagation10, 14 using the Continuity simulation environment15. The models consist of detailed descriptions of cardiac geometry, myofiber orientation, disease substrate (i.e. myocardial scar, borderzone tissue), transmembrane current flow, and myocardial conduction16. The simulation library includes one or more arrhythmia cycles for each of the pre-specified 418,500 variations in cardiac anatomy, physiology, and pathophysiology, incorporating >1 million simulated arrhythmia cycles.
The mapping algorithm compares patient ECG data and relevant arrhythmia simulations for all patients. Highest probability results from this process are used to compose heatmaps illustrating the arrhythmia or pacing site of origin. Please see Supplemental Table I for features mapped by arrhythmia type, and Supplemental Methods for additional details regarding the simulation library and the software verification and validation processes. The cardiac simulation environment Continuity is freely distributed for academic research. The arrhythmia mapping algorithm is proprietary.
Study Population
The study enrolled male and female patients ages 22 to 100 who had successful electrophysiology study and catheter ablation or cardiac pacing including the following pre-specified arrhythmias and pacing: premature atrial and ventricular complexes, atrial and ventricular tachycardia, atrial and ventricular fibrillation, atrioventricular reentrant tachycardia, plus atrial and ventricular pacing. Exclusion criteria included patients with unstable coronary artery disease, intracardiac thrombus, sepsis, complex congenital heart disease, dextrocardia, severe pulmonary hypertension, decompensated heart failure, an existing mechanical heart valve, recent myocardial infarction (within prior 1 month), inability to induce the arrhythmia during the EP study, and poor ECG quality precluding analysis. Please see the Supplemental Methods for additional details regarding the study population and arrhythmia mapping and ablation.
Statistical Analyses
The study defined pre-specified performance goals for the primary and secondary analyses for statistical comparisons based upon prior studies5, 17–19 and results from a 102-sample validation group, separate from the study population (Supplemental Table II). The performance goal for the primary endpoint required that the lower boundary of the 95% confidence interval for regionalization accuracy equal or exceed 80%, based upon prior work17. If this criterion was met, secondary endpoints 1 and 2 were tested in order, stopping if the performance goal at either step was not met, thus preserving study alpha. The pre-specified performance goals for secondary endpoints 1 and 2 required that the confidence interval lower boundaries for accuracy equal or exceed 75% and 70%, respectively, also based upon prior investigations5, 18, 19. All calculations of accuracy include a 95% 2-sided confidence interval. Accuracies were compared using Fischer’s exact test. Statistical analyses were performed by using Stata software, version 16.1 (College Station, TX, USA).
Power Calculation and Determination of Sample Size
The study null hypothesis (H0) was that mapping system performance did not meet or exceed pre-specified performance goals. Assuming a primary endpoint accuracy of 95% based upon prior algorithm validation work using a separate cohort, a minimum of 60 evaluable PVC/VT arrhythmia datasets provided a 90% power to reject the null hypothesis. For secondary endpoint 1, based on the expectation of 83% regionalization accuracy from prior validation work, 250 evaluable patient arrhythmia/pacing datasets provided an 85% power to reject the null hypothesis. For secondary endpoint 2, based on the expectation of 79% accuracy from prior validation work, 250 evaluable patient arrhythmia/pacing datasets provided an 89% power to reject the null hypothesis. Except for PVCs and VTs (discussed above), all arrhythmia and pacing types were to include no less than 20 and no more than 30 samples to adequately power secondary and ancillary analyses. Assuming a 10% attrition rate due to subject dropout following database entry (e.g., poor signal to noise ratio precluding analysis, etc.), up to 25 additional patient arrhythmia/pacing datasets could be evaluated to accommodate dropouts in order to meet or exceed the design sample size of 250 episodes.
Results
The study enrolled 255 arrhythmia and pacing episodes from 225 patients across four investigational sites. Patient demographics for each contributing site and the overall study are shown in Table 1. The study completion date, defined as the date the final case/episode was adjudicated by the core lab, occurred on April 5, 2021. Database lock occurred on April 16, 2021.
Table 1:
Study Demographics
| Characteristic | Investigational Site (Site Number) | ||||
|---|---|---|---|---|---|
| UCSD (01) | VA (02) | Sutter Health (03) | MUSC (04) | TOTAL | |
| Total Cases/Subjects [n (%)] | 117 (52.0%) | 53 (23.6%) | 43 (19.1%) | 12 (5.3%) | 225 (100%) |
| Sex [n (%)] | |||||
| Male | 63 (53.8%) | 48 (90.6%) | 19 (44.2%) | 8 (66.7%) | 138 (61.3%) |
| Female | 54 (46.2%) | 5 (9.4%) | 24 (55.8%) | 4 (33.3%) | 87 (38.7%) |
| Age Range [n (%)] | |||||
| 22–29 years | 17 (14.5%) | 0 (0%) | 2 (4.7%) | 0 (0%) | 19 (8.4%) |
| 30–39 years | 11 (9.4%) | 2 (3.8%) | 5 (11.6%) | 0 (0%) | 18 (8.0%) |
| 40–49 years | 8 (6.8%) | 3 (5.7%) | 1 (2.3%) | 0 (0%) | 12 (5.3%) |
| 50–59 years | 29 (24.8%) | 11 (20.8%) | 5 (11.6%) | 5 (41.7%) | 50 (22.2%) |
| 60–69 years | 29 (24.8%) | 25 (47.2%) | 10 (23.3%) | 3 (25.0%) | 67 (29.8%) |
| 70–79 years | 21 (17.9%) | 11 (20.8%) | 16 (37.2%) | 2 (16.7%) | 50 (22.2%) |
| 80–89 years | 2 (1.7%) | 1 (1.9%) | 4 (9.3%) | 2 (16.7%) | 9 (4.0%) |
| Height, Inches (mean, SD) | 68.3, 4.1 | 69.6, 3.1 | 66.2, 4.2 | 70.5, 5.2 | 68.3, 4.1 |
| Weight, Pounds (mean, SD) | 189.4, 50.2 | 198.6, 38.7 | 180.0, 41.7 | 200.2, 40.8 | 190.3, 45.8 |
| BMI (mean, SD) | 28.4, 6.2 | 28.8, 4.8 | 28.8, 6.2 | 28.5, 6.1 | 28.6, 5.9 |
| Ejection Fraction % (mean, SD) | 55.5, 12.4 | 45.9, 17.5 | 55.3, 12.7[1] | 55.1, 17.7 | 53.2 14.6 |
| NYHA Heart Failure Classification [n (%)] | |||||
| I-II | 99 (84.6%) | 29 (54.7%) | 38 (88.3%) | 10 (83.3%) | 176 (78.2%) |
| III | 13 (11.1%) | 17 (32.1%) | 4 (9.3%) | 1 (8.3%) | 35 (15.6%) |
| IV | 5 (4.3%) | 7 (13.2%) | 1 (2.3%) | 1 (8.3%) | 14 (6.2%) |
| Disease Substrate Type [n (%)] | |||||
| None | 90 (76.9%) | 22 (41.5%) | 35 (81.4%) | 9 (75.0%) | 156 (69.3%) |
| Ischemic Cardiomyopathy | 4 (3.4%) | 16 (30.2%) | 0 (0.0%) | 1 (8.3%) | 21 (9.3%) |
| Non-ischemic Cardiomyopathy | 23 (19.7%) | 15 (28.3%) | 8 (18.6%) | 2 (16.7%) | 48 (21.3%) |
| Amiodarone Use [n (%)] | |||||
| Use Within 21 Days of IP | 5 (4.3%) | 10 (18.9%) | 3 (7.0%) | 1 (8.3%) | 19 (8.4%) |
| No Use Within 21 Days of IP | 112 (95.7%) | 43 (81.1%) | 40 (93.0%) | 11 (91.7%) | 206 (91.6%) |
| Presence of Severe Cardiac Hypertrophy or Dilation [n (%)] | |||||
| No | 108 (92.3%) | 42 (79.2%) | 36 (83.7%) | 10 (83.3%) | 196 (87.1%) |
| Yes | 9 (7.7%) | 11 (20.8%) | 7 (16.3%) | 2 (16.7%) | 29 (12.9%) |
Key: UCSD = University of California San Diego, VA San Diego = Veterans Affairs San Diego Medical Center, MUSC = Medical University of South Carolina, SD = standard deviation, BMI = body mass index, NYHA = New York Heart Association, IP = index procedure.
Regional Accuracy
Regional accuracy for VT and PVCs without structural heart disease and ventricular scar burden <10% (primary endpoint) was 98.7% (74/75 cases, 95% CI: 96.0 – 100%, p<0.001 to reject predefined H0 <0.80). Supplemental Table III shows a breakdown of the primary endpoint analysis across investigational sites; accuracy differences were not statistically significant between institutions (p=0.08). The top row of Figure 2 illustrates accurate source regionalization for a 56-year-old male with coronary artery disease and history of bypass surgery with a 16% PVC burden undergoing ablation.
Figure 2. Mapping ventricular arrhythmia sources.

The top row shows premature ventricular complex (PVC) mapping results in a 56-year-old male with a 16% PVC burden refractory to medical management. Left image shows the recorded ECG with the PVC highlighted (blue box). Middle image shows the system output with the hotspot located in the left ventricular (LV) aorto-mitral continuity. Right image shows the activation map with site of earliest activation and successful ablation in the aorto-mitral continuity (dark red sphere); PVC burden at 15-month follow-up was <1%. Second row show mapping results for ventricular tachycardia (VT) in a 73-year-old male with recurrent VT refractory to sotalol. Left image shows ECG data with a VT QRS complex highlighted. Middle image shows system output with the hotspot in the basal posterolateral left ventricle (LV). Right panel shows the activation map with the exit site and site of successful ablation in the basal posterolateral LV (dark red sphere) with no recurrent VT at 12 month follow up. The corresponding voltage map is shown in supplemental material, Figure S4. The third row shows mapping results for ventricular pacing in a 65-year-old male with symptomatic VT undergoing electrophysiology study and ablation. Left panel shows ECG data with a paced QRS complex highlighted in blue. Middle panel shows system output with the hotspot at the mid lateral LV. Right panel shows the simultaneously recorded electroanatomic map image with the pacing catheter at the mid lateral LV (red arrow). Bottom row shows mapping results for ventricular fibrillation in a 56-year-old male presenting with recurrent, amiodarone-refractory ventricular fibrillation (VF). Left panel shows ECG data during induced VF, with multiple VF cycles selected. Middle panel shows system output, with hotspots in the mid and apical inferoseptal LV. Right panel shows the electroanatomic voltage map with VF electrical substrate ablation lesions in the mid and apical inferoseptal LV (black border regions) which rendered VF non-inducible and resulted in clinical freedom from VF at 13 months follow-up.
For all enrolled cases, regional accuracy (secondary endpoint 1) was 96.9% (247/255 cases, 95% CI: 94.7 – 99.0%, p<0.001 to reject predefined H0 <0.75). The second row of Figure 3 shows the mapping results for focal AT in a 42-year-old female with recurrent palpitations.
Figure 3. Atrial arrhythmia mapping.

Top row shows mapping results for premature atrial complexes (PACs) in a 58-year-old male presenting for symptomatic PAC ablation. Left panel shows ECG data with clinical PAC highlighted. Middle panel illustrates mapping hotspot located at the anterior aspect of the right superior pulmonary vein. Right panel shows electroanatomic activation mapping results with the site of earliest activation and successful ablation at the anterior aspect of the right superior pulmonary vein (red spheres); the patient’s PAC burden at 6-month follow-up was <1%. Second row illustrates mapping results for focal atrial tachycardia (focal AT) in a 42-year-old female with recurrent, symptomatic palpitations. Left panel shows ECG data during focal AT, with P wave highlighted. Middle panel shows mapping output with hotspot in at the anterior base of the left atrial (LA) appendage. Right panel shows electroanatomic mapping results with site of earliest activation and successful ablation at the anterior base of the left atrial appendage (green circle); the patient had no recurrent focal AT at 6 months follow-up. Third row shows mapping results for atrial pacing in a 56-year-old female. Left panel shows ECG data during pacing with P wave highlighted. Middle panel shows system output with hotspot in the lateral right atrium (RA). Right panel shows simultaneous electroanatomic mapping image with the pacing catheter tip (red arrow) at the lateral RA. Fourth row shows mapping results during orthodromic atrioventricular reentrant tachycardia (AVRT) in a 33-year-old male with recurrent, symptomatic tachycardia. Left panel shows ECG during AVRT, with P wave highlighted. Middle panel shows mapping hotspot of probable accessory pathway insertion at the annular posterolateral LA. Right panel shows activation mapping with early activation and site of successful ablation at the annular posterolateral LA (green circle). Bottom row shows mapping results for atrial fibrillation (AF) in a 57-year-old male with recurrent, symptomatic paroxysmal AF. Left panel shows ECG data during AF, with the selection window containing data during AF (final 56 seconds not illustrated for clarity). Middle panel shows mapping output with the highest probability site at the posterior ostium of the left inferior pulmonary vein. Right panel shows the location of ablation which terminated AF at the ostium of the left inferior pulmonary vein (red circle) with no recurrent AF at 3-year follow up.
The individual regional accuracies for each arrhythmia and pacing subtype (ancillary endpoint 1) are shown in Table 2, column 3. All regional accuracies for individual arrhythmia subtypes were greater than 91% with all confidence interval lower boundaries greater than 80%. Pre-specified analysis revealed no subgroups for which regional mapping accuracy was significantly lower than other subgroups (Table 3, columns 3 and 4), including patients with and without structurally normal hearts (96.8% versus 97.3%, P=0.99).
Table 2.
Regional and Segmental Accuracy Results
| Arrhythmia/Pacing Types | Sample Size, Episodes (% of Total) | Regional Accuracy # (%, 95% Confidence Interval) | Segment Accuracy # (%, 95% Confidence Interval) |
|---|---|---|---|
| Total Episodes [n (%)] | 255 (100%) | 247 (96.9%, 94.7 – 99.0%)* | 248 (97.3%, 95.2 – 99.3%)† |
| Ventricular pacing | 22 (8.6%) | 22 (100%, 87 – 100%) | 22 (100%, 87 – 100%) |
| Premature ventricular complex | 73 (28.6%) | 72 (98.6%, 96 – 99.9%) | 73 (100%, 96 – 100%) |
| Ventricular tachycardia | 22 (8.6%) | 22 (100%, 87 – 100%) | 21 (95.5%, 87 – 99.9%) |
| Ventricular fibrillation | 20 (7.8%) | 19 (95.0%, 85 – 99.9%) | 20 (100%, 86 – 100%) |
| Atrioventricular reentrant tachycardia | 24 (9.4%) | 22 (91.7%, 81 – 99.9%) | 23 (95.8%, 88 – 99.9%) |
| Atrial pacing | 28 (11.0%) | 27 (96.4%, 90 – 99.9%) | 28 (100%, 90 – 100%) |
| Atrial fibrillation | 21 (8.2%) | 20 (95.2%, 86 – 99.9%) | 20 (95.2%, 86 – 99.9%) |
| Focal atrial tachycardia | 23 (9.0%) | 22 (95.7%, 87 – 99.9%) | 21 (91.3%, 80 – 99.9%) |
| Premature atrial complex | 22 (8.6%) | 21 (95.5%, 87 – 99.9%) | 20 (90.9%, 79 – 99.9%) |
Pre-specified secondary endpoint 1 (p<0.0001 to reject null hypothesis, CI: [94.7 – 99.0%]).
Pre-specified secondary endpoint 2 (p<0.0001 to reject null hypothesis, CI: [95.2% – 99.3%]).
Table 3.
Mapping Accuracy by Prespecified Subgroups
| Characteristic | Total | Subgroup Regional Accuracy | Subgroup Segmental Accuracy | ||
|---|---|---|---|---|---|
| Agreement | No Agreement | Agreement | No Agreement | ||
| Total Arrhythmia/Pacing Episodes | 255 (100%) | 247 (96.9%) | 8 (3.1%) | 248 (97.3%) | 7 (2.7%) |
| Sex [n (%)] | |||||
| Male | 166 (65.1%) | 160 (96.4%) | 6 (3.6%) | 161 (97.0%) | 5 (3.0%) |
| Female | 89 (34.9%) | 87 (97.8%) | 2 (2.2%) | 87 (97.8%) | 2 (2.2%) |
| Age Range [n (%)] | |||||
| 20–29 | 19 (7.5%) | 18 (94.7%) | 1 (5.3%) | 18 (94.7%) | 1 (5.3%) |
| 30–39 | 18 (7.1%) | 18 (100.0%) | 0 (0.0%) | 18 (100.0%) | 0 (0.0%) |
| 40–49 | 12 (4.7%) | 12 (100.0%) | 0 (0.0%) | 12 (100.0%) | 0 (0.0%) |
| 50–59 | 54 (21.2%) | 51 (94.4%) | 3 (5.6%) | 52 (96.3%) | 2 (3.7%) |
| 60–69 | 81 (31.8%) | 81 (100.0%) | 0 (0.0%) | 79 (97.5%) | 2 (2.5%) |
| 70–79 | 59 (23.1%) | 55 (93.2%) | 4 (6.8%) | 57 (96.6%) | 2 (3.4%) |
| 80–89 | 12 (4.7%) | 12 (100.0%) | 0 (0.0%) | 12 (100.0%) | 0 (0.0%) |
| BMI [n (%)] | |||||
| < 30 | 160 (62.7%) | 154 (96.3%) | 6 (3.8%) | 156 (97.5%) | 4 (2.5%) |
| ≥ 30 | 95 (37.3%) | 93 (97.9%) | 2 (2.1%) | 92 (96.8%) | 3 (3.2%) |
| NYHA Heart Failure Classification [n (%)] | |||||
| I-II | 194 (76.1%) | 187 (96.4%) | 7 (3.6%) | 189 (97.4%) | 5 (2.6%) |
| III | 41 (16.1%) | 40 (97.6%) | 1 (2.4%) | 39 (95.1%) | 2 (4.9%) |
| IV | 20 (7.8%) | 20 (100.0%) | 0 (0.0%) | 20 (100.0%) | 0 (0.0%) |
| Structurally Normal Heart [n (%)] | |||||
| Yes | 217 (85.1%) | 210 (96.8%) | 7 (3.2%) | 210 (96.8%) | 7 (3.2%) |
| No | 38 (14.9%) | 37 (97.4%) | 1 (2.6%) | 38 (100.0%) | 0 (0.0%) |
| Scar Configuration/Lesions (n=255) [n (%)] | |||||
| < 10% Scar | 232 (91.0%) | 226 (97.4%) | 6 (2.6%) | 226 (97.4%) | 6 (2.6%) |
| ≥ 10% Scar | 23 (9.0%) | 21 (91.3%) | 2 (8.7%) | 22 (95.7%) | 1 (4.3%) |
| Geometry Type – Atria (n=118) [n (%)] | |||||
| Normal | 108 (91.5%) | 102 (94.4%) | 6 (5.6%) | 102 (94.4%) | 6 (5.6%) |
| LA Dilation | 6 (5.1%) | 6 (100.0%) | 0 (0.0%) | 6 (100.0%) | 0 (0.0%) |
| Bi-atrial Enlargement | 4 (3.4%) | 4 (100.0%) | 0 (0.0%) | 4 (100.0%) | 0 (0.0%) |
| Geometry Type – Ventricles (n=137) [n (%)] | |||||
| Normal | 118 (86.1%) | 117 (99.2%) | 1 (0.8%) | 117 (99.2%) | 1 (0.8%) |
| LV Dilation | 19 (13.9%) | 18 (94.7%) | 1 (5.3%) | 19 (100.0%) | 0 (0.0%) |
| Scar Configuration/Lesions – Atria (Utah Classification) (n=118) [n (%)] | |||||
| I (<5% enhancement) | 69 (58.5%) | 66 (95.7%) | 3 (4.3%) | 65 (94.2%) | 4 (5.8%) |
| II (5–20% enhancement) | 9 (7.6%) | 9 (100.0%) | 0 (0.0%) | 9 (100.0%) | 0 (0.0%) |
| III (20–30% enhancement) | 3 (2.5%) | 3 (100.0%) | 0 (0.0%) | 3 (100.0%) | 0 (0.0%) |
| IV (>35% enhancement) | 0 (0.0%) | 0 (0.0%) | 0 (0.0%) | 0 (0.0%) | 0 (0.0%) |
| Unknown* | 37 (31.4%) | 34 (91.9%) | 3 (8.1%) | 35 (94.6%) | 2 (5.4%) |
| Scar Configuration/Lesions – Atria (Atrial Prior Ablation Pattern)† (n=118) [n (%)] | |||||
| None | 102 (86.4%) | 97 (95.1%) | 5 (4.9%) | 97 (95.1%) | 5 (4.9%) |
| WACA | 12 (10.2%) | 11 (91.7%) | 1 (8.3%) | 11 (91.7%) | 1 (8.3%) |
| CTI Ablation | 2 (1.7%) | 2 (100.0%) | 0 (0.0%) | 2 (100.0%) | 0 (0.0%) |
| WACA, CTI, LA Roof Ablation | 1 (0.85%) | 1 (100.0%) | 0 (0.0%) | 1 (100.0%) | 0 (0.0%) |
| WACA, MI Posterior Ablation | 1 (0.85%) | 1 (100.0%) | 0 (0.0%) | 1 (100.0%) | 0 (0.0%) |
| Scar Configuration/Lesions – Ventricles (n=137)† [n (%)] | |||||
| None | 122 (89.1%) | 121 (99.2%) | 1 (0.8%) | 121 (99.2%) | 1 (0.8%) |
| LV Anterior | 1 (0.73%) | 1 (100.0%) | 0 (0.0%) | 1 (100.0%) | 0 (0.0%) |
| LV Lateral | 4 (2.9%) | 4 (100.0%) | 0 (0.0%) | 4 (100.0%) | 0 (0.0%) |
| LV Posterior | 8 (5.8%) | 7 (87.5%) | 1 (12.5%) | 8 (100.0%) | 0 (0.0%) |
| LV Septal | 1 (0.73%) | 1 (100.0%) | 0 (0.0%) | 1 (100.0%) | 0 (0.0%) |
Unknown was selected if Utah classification was unavailable.
Up to 3 options could be selected in the user interface.
Key: BMI = body mass index, NYHA = New York Heart Association, LA = left atrial, LV = left ventricular, WACA = wide area circumferential ablation, CTI = cavo-tricuspid isthmus, MI = mitral annular.
There were 53 outflow tract arrhythmias: 20 were ablated from the left ventricular outflow tract (LVOT), 27 from the right (RVOT), and 6 required ablation in both chambers for arrhythmia suppression. Accuracy to identify left, right, or both ventricles was 51/53 (96.2%).
Segmental Accuracy
Accuracy for all enrolled cases in identifying the exact or neighboring segment (secondary endpoint 2) was 97.3% (248/255 cases, 95% CI: 95.2 – 99.3%, p<0.001 to reject predefined H0 <0.70). The bottom row of Figure 3 shows the mapping results for an atrial fibrillation ablation case in a 57-year-old male with recurrent, symptomatic paroxysmal atrial fibrillation and a normal left atrial diameter.
The individual arrhythmia and pacing subtype segmental accuracies (ancillary endpoint 2) are shown in Table 2, column 4. All accuracies were greater than 90% with all confidence interval lower boundaries greater than 78%. The bottom row of Figure 2 highlights the mapping results for VF in a 56-year-old male with ischemic cardiomyopathy, LV ejection fraction 16% who presented with recurrent ICD shocks for VF refractory to amiodarone. Pre-specified analysis revealed no subgroups for which segmental mapping accuracy was significantly lower than other subgroups (Table 3, columns 5 and 6), including for patients with versus without structurally normal hearts (96.8% versus 100%, P=0.60).
Accuracy for the exact segment of arrhythmia source or pacing for all enrolled cases was 76% (194/255 cases, 95% CI: 70.4 – 81.2%). For VT and PVCs in patients with structural heart disease, exact segment accuracy was 84% (31/37 cases); in the subset of VT or PVCs which originated from regions of the LV corresponding to the 17 AHA LV segments, exact segment accuracy was 100% (14/14 cases).
Spatial Accuracy
Center-to-center absolute spatial accuracy across all arrhythmia subgroups was 15 mm [IQR: 7 – 25 mm] (Figure 4). Table 4 shows the spatial accuracies for each arrhythmia and pacing subtype. The top row of Figure 3 shows the PAC mapping results for a 58-year-old male with coronary artery disease, paroxysmal AF and PACs presenting for ablation. The left image shows the ECG tracing with the PAC highlighted; center-to-center spatial accuracy was 4 mm.
Figure 4. Graphical depiction of study results.

Panel A shows the accuracy results for the primary endpoint (98.7%, 95% confidence interval (CI): 96.0 – 99.9%, p<0.001 to reject null hypothesis), secondary endpoint 1 (96.9%, 95% CI: 94.7 – 99.0%, p<0.001), and secondary endpoint 2 (97.3%, 95% CI: 95.2 – 99.3%, p<0.001). Panel B shows the spatial accuracy results, with a median accuracy for all enrolled cases (n=255) of 15 mm [IQR: 7–25 mm]. Panel C shows analysis time results with medial analysis time of 0.8 minutes [IQR: 0.4–1.4 minutes].
Table 4.
Spatial Accuracy
| Arrhythmia/Pacing Types | Sample Size, Number (% of Total) | Spatial Accuracy, Absolute Distance (median) | Interquartile Range [25% – 75%] |
|---|---|---|---|
| Total Episodes [n (%)] | 255 (100%) | 15 mm | [7 – 25 mm] |
| Premature ventricular complex | 73 (28.6%) | 11 mm | [5 – 22 mm] |
| Ventricular tachycardia | 22 (8.6%) | 14 mm | [6 – 24 mm] |
| Ventricular pacing | 22 (8.6%) | 9 mm | [7 – 17 mm] |
| Ventricular fibrillation | 20 (7.8%) | 12 mm | [8 – 25 mm] |
| Premature atrial complex | 22 (8.6%) | 24 mm | [14 – 31 mm] |
| Focal atrial tachycardia | 23 (9.0%) | 17 mm | [9 – 36 mm] |
| Atrial pacing | 28 (11.0%) | 16 mm | [10 – 26 mm] |
| Atrioventricular reentrant tachycardia | 24 (9.4%) | 16 mm | [10 – 26 mm] |
| Atrial fibrillation | 21 (8.2%) | 21 mm | [17 – 24 mm] |
The spatial accuracy for VT and PVCs in patients with ischemic or nonischemic structural heart disease (n=37) was 11 mm [IQR: 5 – 21 mm]. The second row of Figure 2 illustrates the VT mapping results for a 73-year-old male with ischemic cardiomyopathy and symptomatic VT refractory to sotalol presenting for VT ablation. Supplemental Figure V shows the corresponding voltage map for the patient, which demonstrates a large posterior scar from prior myocardial infarction. “LV posterior scar” was selected from the “ventricular scar location” menu for mapping system analysis; center-to-center spatial accuracy was 5 mm.
Analysis Time
The median analysis time from ECG data upload into the system and ending with display of the mapping results was 0.8 minutes (IQR: 0.4 – 1.4 minutes).
Discussion
The are several important findings from the present study. First, a noninvasive mapping process based upon forward, three-dimensional computational models of electrophysiology to predict arrhythmia origin activation sites met or exceeded all prespecified accuracy endpoints in a blinded, multicenter, independently adjudicated study. Second, the spatial accuracy demonstrated sufficient precision to facilitate targeted therapies such as catheter-based mapping and ablation or SAbR therapy. Finally, the brief analysis times required for use are amenable to repeated mappings in the clinical electrophysiology setting. These findings demonstrate several advantages of the forward solution approach and provide support for additional studies using the mapping system to facilitate targeted arrhythmia therapy.
Forward Solution for Arrhythmia Mapping
Estimation of the cardiac electrical activity from body surface recordings is defined as the electrocardiographic inverse problem. Extant solutions have relied upon elegant approaches in which high-density electrical recordings are mathematically transformed onto a reconstructed three-dimensional model of the epicardium, often referred to as the inverse solution. This approach requires patient-specific cardiac and torso geometry creation from computed tomography imaging, precise measurement of surface lead locations, and sophisticated numerical regularization schemes to prevent measurement errors from being amplified in the analysis20. In contrast, the approach tested here compares patient electrograms with electrograms computed from numerous three-dimensional forward electrophysiological simulations of cardiac arrhythmias8, 9 and pacing11 in which the arrhythmia source location is determined by the model initial conditions. This approach is referred to as the forward solution to the inverse problem, and has been incorporated in other fields of bioengineering21 but not yet widely demonstrated in cardiac mapping applications.
The forward-solution mapping methodology involves creation of a large, comprehensive library of arrhythmia simulations to accommodate patient-specific variations in anatomy and physiology. Presently, the library incorporates 418,500 variations in model anatomy, pathophysiology, source location, and arrhythmia mechanism, with each variation run for up to several seconds of simulated time creating one or more arrhythmia cycles from each variation; more than 1 million simulated arrhythmia cycles are currently available within the library as the “learning set” for the mapping process. For this work, the library was completed and “locked” prior to study initiation. In addition to arrhythmia libraries in structurally normal atrial and ventricular anatomies, many sub-libraries were generated to accommodate patients with significant structural heart disease. For example, sub-libraries were created a priori to accommodate patients who had experienced prior myocardial infarction with significant scarring of the posterior left ventricle, such as the patient in the second row of Figure 2 and Supplemental Figure V. For these simulations, a virtual scar was created in the posterior wall of left ventricle and the arrhythmia simulations performed, thus accounting for the impact of this structural abnormality on cardiac electrical activity. Similar sub-libraries were created in anticipation of patients with significant anterior, lateral, and septal LV wall scars, and all combinations of these conditions. These pre-generated sub-libraries are then leveraged for the mapping process based upon combinations of input parameters in the menu-driven interface prior to analysis1.
There are several advantages to the forward solution in the clinical arrhythmia context. One is the ability to perform detailed mapping using a smaller data sample from the patient’s body surface, which in this study was the 12-lead ECG. A second advantage is the accelerated workflow, providing mapping output approximately 1 minute after data upload.
Disadvantages of the forward solution include, first, the need to pre-simulate enough variations in anatomy, physiology, and pathophysiology to account for variations in anatomy and pathophysiology seen clinically. In our laboratory, we used a 102-arrhythmia sample validation cohort, separate from the patients in this study, to assess when the number of simulation variations provided sufficient accuracy to allow mapping of unselected patients in the clinical electrophysiology setting. The second disadvantage is the computational cost both in processor time and memory requirements to compute the pre-specified simulations and their solutions. This limitation was overcome using a distributed computing approach, the description of which is beyond the scope of the present manuscript.
This pilot study is the first blinded, multicenter, independently adjudicated study of a forward solution approach to map a broad spectrum of clinical arrhythmias and pacing. By refining the models and expanding the reference simulation library, additional improvements in localization accuracy may be possible.
Utility of Regional and Lateralization Accuracy
The ability to correctly identify the region and chamber of origin of clinical arrhythmias may facilitate planning electrophysiology care5, providing guidance for pre-procedural catheter selection and vascular access, informing patient discussions regarding procedural risks and benefits, and better anticipating anesthesia requirements for right versus left atrial and ventricular arrhythmias. Prior seminal work demonstrated that ECGi was able to correctly separate right versus left ventricular origins in VT and PVCs in 20 of 22 arrhythmias (91%)22. Separately, ECGi was able to determine the correct region of origin of 23 of 24 samples (96%) of VT or PVCs originating from the ventricular outflow tracts17. In the present study, the system was able to identify the correct chamber of origin for 51 of 53 (96%) ventricular outflow tract arrhythmias. Overall regionalization accuracy was 247/255 (97%), demonstrating robust regionalization and laterization accuracy for studied arrhythmias and pacing. Future studies will examine improvements in mapping and total procedure duration, particularly when unexpected or previously unmapped arrhythmias are encountered.
Importance of Segmental Accuracy
Segmental accuracy provides increased precision for potential targeted therapies such as Stereotactic Ablative Radiotherapy (SAbR)23 for which target volumes larger than catheter ablation are utilized24. In prior work2, a novel 3-step process to visually identify the segment of origin for PVCs and VT within the American Heart Association 17 segment model achieved an exact segment accuracy of 82% in patients with structural heart disease, and a 96% exact plus neighboring segment accuracy. In a separate analysis, ECGi provided an exact segment accuracy of 83%25 for VT originating from any of the 17 AHA LV segments.
Previously, the forward-solution algorithm evaluated in this work was able to guide SAbR therapy in 6 patients with refractory VT achieving a 97% reduction in arrhythmia burden1, although segmental accuracy for a broad spectrum of arrhythmias and pacing was unknown. In a 30 segment bi-ventricular heart model, the algorithm yielded an exact segment accuracy of 84% for VT and PVCs in patients with structural heart disease. For VT and PVCs originating from any of the 17 AHA LV segments, exact segment accuracy was 14 of 14 cases (100%). Across 30 bi-ventricular and 21 bi-atrial segments, the algorithm demonstrated a 97.3% exact plus neighboring segment accuracy and a 76% exact segment accuracy across all 255 enrolled cases, potentially facilitating invasive or noninvasive therapies for arrhythmias beyond VT and PVCs.
Assessment of Spatial Accuracy
Spatial accuracy analysis provides an estimate of the probability for arrhythmia sources to lie within given radii from mapping results. Prior accuracy assessment for ECGi has demonstrated a median spatial accuracy of 10 mm in a canine model26. More recent clinical work has demonstrated a median accuracy for ECGi of 13.2 mm in epicardial ventricular pacing27 and 22.6 mm for unstable VT in patients with structural heart disease25.
In this study, median spatial accuracy was 15 mm for all arrhythmia and pacing episodes and 11 mm for patients with ischemic or nonischemic cardiomyopathy. These accuracy results demonstrate that relevant noninvasive mapping is possible using a forward solution approach which is not patient-specific, but rather highly patient-relevant because of user input to the mapping algorithm. These inputs regarding the presence and location of patient-specific disease characteristics allow algorithm-based selection of more relevant simulation sub-libraries for the mapping process. The results of the study also support that the vectorcardiographic mapping approach provides adequate detail to assess cardiac activation via comparisons with computational arrhythmia simulations. Future work is required to determine whether increasing the number and type of simulations in the library may further increase localization accuracy.
Limitations
There are several limitations to consider for the present study. First, the computational models are not patient specific. Conditions which may not yet be well-represented in the simulation library including dextrocardia, complex congenital heart disease, and severe pulmonary hypertension were excluded from the study; use of the system in these groups may result in suboptimal accuracy and is not recommended. Second, multiple arrhythmia types were not included in the current study including typical atrial flutter, atypical atrial flutter, atrioventricular nodal reentrant tachycardia, and junctional tachycardia; use of the system for these arrhythmias is not advised. Third, arrhythmia source or pacing site documentation involved a board-certified electrophysiologist marking the site of origin on a standard three-dimensional computational cardiac model. This transposition process to the standard model may have introduced error, estimated as 5±3 mm from sensitivity testing (detailed in the Supplemental Methods). Fourth, the spatial accuracy analysis was not patient specific; distances were measured by computer using the study adult cardiac model, although exploratory analysis in a subset of enrolled patients showed good correlation with actual spatial error (Supplemental Figure VI). Larger patient cardiac anatomies may experience a proportionally greater error in mapping results. Fifth, although the learning set of 1 million arrhythmia simulations is sizable, it does not yet account for all combinations of patient anatomy and pathophysiology. Additional learning samples are required to accommodate groups excluded from this study. Sixth, the VMAP study did not specify ECG electrode positioning during the electrophysiology study. Electrode positions may be altered by the placement of defibrillator or mapping patches, which may have negatively impacted mapping accuracy. Future studies are required to determine whether accuracy may be further enhanced with a pre-specified ECG electrode placement protocol. Seventh, the primary endpoint was assessed in patients without structural heart disease and ventricular scar burden <10%. Eighth, the algorithm is not able to separate endocardial versus epicardial sources; work is ongoing to assess the feasibility of this analysis.
Conclusions
In conclusion, computational ECG mapping exceeded pre-specified performance goals for regional and segmental accuracy. The mapping process was temporally efficient and provided spatial accuracy which is clinically relevant for facilitating catheter-based mapping and ablation, determining the location of pacing catheters or pacemaker leads, or to helping plan stereotactic ablative radiotherapy.
Supplementary Material
What is Known:
Current approaches for arrhythmia site-of-origin analysis include visual interpretation of the surface ECG, electrocardiographic imaging, and invasive catheter mapping which may possess limitations in accuracy, workflow efficiency, and safety.
What the Study Adds:
The accuracy of a forward-solution mapping algorithm using the standard 12-lead ECG in 7 different atrial and ventricular arrhythmias plus atrial and ventricular pacing was evaluated in this blinded, multicenter, independently adjudicated study.
In 255 arrhythmia and pacing episodes from 225 patients across 4 study centers, regional, segmental, and spatial accuracies were 96.9%, 97.3%, and 15 mm for all episodes compared to the gold standard of electrophysiology study and ablation.
The mapping process was completed in a median of 0.8 minutes using a menu-driven interface and without the need for additional imaging.
Acknowledgments:
The authors would like to thank Mike Billig, Genice Gallegos, Zane Liu, Katherine Lau, Kit Cariquitan, and Ron Warren from Experien Group, LLC for their assistance planning and managing the clinical study.
Sources of Funding:
Dr. Krummen has received grant support from the American Heart Association (10 BGIA 3500045), UCSD Galvanizing Engineering in Medicine (GEM) Grant, University of California Center for Accelerated Innovation Grant, and a UCSD Rady Meet Grant relevant to this study. Dr. Ho has received grant funding from the American Heart Association (AHA 19CDA34760021) and the National Institutes of Health (NIH 1KL2TR001444) relevant to this study. Dr. McCulloch is supported by grants from the NIH (HL131753, HL121754) and AHA (AWS 4.0 DGP) and the Saving Tiny Hearts Society.
Disclosures:
Dr. Han was the overall study PI and site PI for both UCSD and VA San Diego; he reports honoraria and research support from Abbott Laboratories, unrelated to this work. Dr. Schricker and Dr. Field were site PIs for Mills Peninsula Medical Center and Medical University of South Carolina, respectively, and report no conflict of interest relevant to the study. Dr. Sung, Dr. Kacena, Dr. Martinson, and Dr. Raissi report no conflict of interest. Dr. Krummen, Dr. Villongco, Dr. Ho, and Dr. McCulloch report equity in Vektor Medical and intellectual property, assigned to UCSD. Dr. Hoffmayer and Dr. Feld report equity interest in Vektor Medical. Dr. Hsu reports receiving honoraria from Medtronic, Abbott, Boston Scientific, Biotronik, Janssen Pharmaceuticals, Bristol-Myers Squibb, Pfizer, Sanofi, Hillrom, Baylis Medical, Acutus Medical, iRhythm, Zoll Medical, and Biosense-Webster, research grants from Biotronik and Biosense-Webster, and has equity interest in Vektor Medical. Dr. McCulloch also reports equity in Insilicomed, Inc.
Nonstandard Abbreviations and Acronyms:
- AF
Atrial Fibrillation
- AVRT
Atrio-Ventricular Reentrant Tachycardia
- Focal AT
Focal Atrial Tachycardia
- PAC
Premature Atrial Complex
- PVC
Premature Ventricular Complex
- VF
Ventricular Fibrillation
- VT
Ventricular Tachycardia
- EPS
Electrophysiology Study
- RA/RV
Right Atrium/Right Ventricle
- LA/LV
Left Atrium/Left Ventricle
- VMAP
Vectorcardiographic Mapping of Arrhythmogenic Probability
Footnotes
Clinical Trial Registration: https://www.clinicaltrials.gov; NCT04559061.
References:
- 1.Ho G, Atwood TF, Bruggeman AR, Moore KL, McVeigh E, Villongco CT, Han FT, Hsu JC, Hoffmayer KS, Raissi F, et al. Computational ECG mapping and respiratory gating to optimize stereotactic ablative radiotherapy workflow for refractory ventricular tachycardia. Heart Rhythm O2. 2021;2:511–520. [DOI] [PMC free article] [PubMed] [Google Scholar]
- 2.Andreu D, Fernandez-Armenta J, Acosta J, Penela D, Jauregui B, Soto-Iglesias D, Syrovnev V, Arbelo E, Tolosana JM and Berruezo A. A QRS axis-based algorithm to identify the origin of scar-related ventricular tachycardia in the 17-segment American Heart Association model. Heart Rhythm. 2018;15:1491–1497. [DOI] [PubMed] [Google Scholar]
- 3.Cuculich PS, Wang Y, Lindsay BD, Faddis MN, Schuessler RB, Damiano RJ Jr., Li L and Rudy Y. Noninvasive Characterization of Epicardial Activation in Humans With Diverse Atrial Fibrillation Patterns. Circulation. 2010;122:1364–72. [DOI] [PMC free article] [PubMed] [Google Scholar]
- 4.Proietti R, Dowd R, Gee LV, Yusuf S, Panikker S, Hayat S, Osman F, Patel K, Salim H, Aldhoon B, et al. Impact of a high-density grid catheter on long-term outcomes for structural heart disease ventricular tachycardia ablation. J Interv Card Electrophysiol. 2021;62:519–529. [DOI] [PMC free article] [PubMed] [Google Scholar]
- 5.Miller JM, Jain R, Dandamudi G and Kambur TR. Electrocardiographic Localization of Ventricular Tachycardia in Patients with Structural Heart Disease. Card Electrophysiol Clin. 2017;9:1–10. [DOI] [PubMed] [Google Scholar]
- 6.Haissaguerre M, Hocini M, Denis A, Shah AJ, Komatsu Y, Yamashita S, Daly M, Amraoui S, Zellerhoff S, Picat MQ, et al. Driver domains in persistent atrial fibrillation. Circulation. 2014;130:530–8. [DOI] [PubMed] [Google Scholar]
- 7.Kesek M, Englund A, Jensen SM and Jensen-Urstad M. Entrapment of circular mapping catheter in the mitral valve. Heart Rhythm. 2007;4:17–9. [DOI] [PubMed] [Google Scholar]
- 8.Gonzales MJ, Vincent KP, Rappel WJ, Narayan SM and McCulloch AD. Structural contributions to fibrillatory rotors in a patient-derived computational model of the atria. Europace. 2014;16 Suppl 4:iv3–iv10. [DOI] [PMC free article] [PubMed] [Google Scholar]
- 9.Ho G, Villongco CT, Yousefian O, Bradshaw A, Nguyen A, Faiwiszewski Y, Hayase J, Rappel WJ, McCulloch AD and Krummen DE. Rotors exhibit greater surface ECG variation during ventricular fibrillation than focal sources due to wavebreak, secondary rotors, and meander. J Cardiovasc Electrophysiol. 2017;28:1158–1166. [DOI] [PMC free article] [PubMed] [Google Scholar]
- 10.Villongco CT, Krummen DE, Stark P, Omens JH and McCulloch AD. Patient-specific modeling of ventricular activation pattern using surface ECG-derived vectorcardiogram in bundle branch block. Prog Biophys Mol Biol. 2014;115:305–13. [DOI] [PMC free article] [PubMed] [Google Scholar]
- 11.Villongco CT, Krummen DE, Omens JH and McCulloch AD. Non-invasive, model-based measures of ventricular electrical dyssynchrony for predicting CRT outcomes. Europace. 2016;18:iv104–iv112. [DOI] [PMC free article] [PubMed] [Google Scholar]
- 12.Sohns C, Lemes C, Metzner A, Fink T, Chmelevsky M, Maurer T, Budanova M, Solntsev V, Schulze WHW, Staab W, et al. First-in-Man Analysis of the Relationship Between Electrical Rotors From Noninvasive Panoramic Mapping and Atrial Fibrosis From Magnetic Resonance Imaging in Patients With Persistent Atrial Fibrillation. Circ Arrhythm Electrophysiol. 2017;10:e004419. [DOI] [PubMed] [Google Scholar]
- 13.Plaisier AS, Burgmans MC, Vonken EP, Prakken NH, Cox MG, Hauer RN, Velthuis BK and Cramer MJ. Image quality assessment of the right ventricle with three different delayed enhancement sequences in patients suspected of ARVC/D. Int J Cardiovasc Imaging. 2012;28:595–601. [DOI] [PMC free article] [PubMed] [Google Scholar]
- 14.Gonzales MJ, Sturgeon G, Krishnamurthy A, Hake J, Jonas R, Stark P, Rappel WJ, Narayan SM, Zhang Y, Segars WP, et al. A three-dimensional finite element model of human atrial anatomy: new methods for cubic Hermite meshes with extraordinary vertices. Med Image Anal. 2013;17:525–37. [DOI] [PMC free article] [PubMed] [Google Scholar]
- 15.Vincent KP, Gonzales MJ, Gillette AK, Villongco CT, Pezzuto S, Omens JH, Holst MJ and McCulloch AD. High-order finite element methods for cardiac monodomain simulations. Front Physiol. 2015;6:217. [DOI] [PMC free article] [PubMed] [Google Scholar]
- 16.Krishnamurthy A, Villongco CT, Chuang J, Frank LR, Nigam V, Belezzuoli E, Stark P, Krummen DE, Narayan S, Omens JH, et al. Patient-Specific Models of Cardiac Biomechanics. J Comput Phys. 2013;244:4–21. [DOI] [PMC free article] [PubMed] [Google Scholar]
- 17.Jamil-Copley S, Bokan R, Kojodjojo P, Qureshi N, Koa-Wing M, Hayat S, Kyriacou A, Sandler B, Sohaib A, Wright I, et al. Noninvasive electrocardiographic mapping to guide ablation of outflow tract ventricular arrhythmias. Heart Rhythm. 2014;11:587–94. [DOI] [PMC free article] [PubMed] [Google Scholar]
- 18.Kuchar DL, Ruskin JN and Garan H. Electrocardiographic localization of the site of origin of ventricular tachycardia in patients with prior myocardial infarction. J Am Coll Cardiol. 1989;13:893–903. [DOI] [PubMed] [Google Scholar]
- 19.Yokokawa M, Liu TY, Yoshida K, Scott C, Hero A, Good E, Morady F and Bogun F. Automated analysis of the 12-lead electrocardiogram to identify the exit site of postinfarction ventricular tachycardia. Heart Rhythm. 2012;9:330–4. [DOI] [PubMed] [Google Scholar]
- 20.Oster HS, Taccardi B, Lux RL, Ershler PR and Rudy Y. Electrocardiographic imaging: Noninvasive characterization of intramural myocardial activation from inverse-reconstructed epicardial potentials and electrograms. Circulation. 1998;97:1496–507. [DOI] [PubMed] [Google Scholar]
- 21.Baxter WW and McCulloch AD. In vivo finite element model-based image analysis of pacemaker lead mechanics. Med Image Anal. 2001;5:255–70. [DOI] [PubMed] [Google Scholar]
- 22.Misra S, van Dam P, Chrispin J, Assis F, Keramati A, Kolandaivelu A, Berger R and Tandri H. Initial validation of a novel ECGI system for localization of premature ventricular contractions and ventricular tachycardia in structurally normal and abnormal hearts. J Electrocardiol. 2018;51:801–808. [DOI] [PubMed] [Google Scholar]
- 23.Cuculich PS and Robinson CG. Noninvasive Ablation of Ventricular Tachycardia. N Engl J Med. 2018;378:1651–1652. [DOI] [PubMed] [Google Scholar]
- 24.Robinson CG, Samson PP, Moore KMS, Hugo GD, Knutson N, Mutic S, Goddu SM, Lang A, Cooper DH, Faddis M, et al. Phase I/II Trial of Electrophysiology-Guided Noninvasive Cardiac Radioablation for Ventricular Tachycardia. Circulation. 2019;139:313–321. [DOI] [PMC free article] [PubMed] [Google Scholar]
- 25.Graham AJ, Orini M, Zacur E, Dhillon G, Daw H, Srinivasan NT, Martin C, Lane J, Mansell JS, Cambridge A, et al. Evaluation of ECG Imaging to Map Hemodynamically Stable and Unstable Ventricular Arrhythmias. Circ Arrhythm Electrophysiol. 2020;13:e007377. [DOI] [PubMed] [Google Scholar]
- 26.Cluitmans MJM, Bonizzi P, Karel JMH, Das M, Kietselaer B, de Jong MMJ, Prinzen FW, Peeters RLM, Westra RL and Volders PGA. In Vivo Validation of Electrocardiographic Imaging. JACC Clin Electrophysiol. 2017;3:232–242. [DOI] [PubMed] [Google Scholar]
- 27.Graham AJ, Orini M, Zacur E, Dhillon G, Daw H, Srinivasan NT, Lane JD, Cambridge A, Garcia J, O’Reilly NJ, et al. Simultaneous Comparison of Electrocardiographic Imaging and Epicardial Contact Mapping in Structural Heart Disease. Circ Arrhythm Electrophysiol. 2019;12:e007120. [DOI] [PubMed] [Google Scholar]
- 28.Narayan SM, Krummen DE, Shivkumar K, Clopton P, Rappel WJ and Miller JM. Treatment of atrial fibrillation by the ablation of localized sources: CONFIRM (Conventional Ablation for Atrial Fibrillation With or Without Focal Impulse and Rotor Modulation) trial. J Am Coll Cardiol. 2012;60:628–36. [DOI] [PMC free article] [PubMed] [Google Scholar]
- 29.Krummen DE, Ho G, Hoffmayer KS, Schweis FN, Baykaner T, Rogers AJ, Han FT, Hsu JC, Viswanathan MN, Wang PJ, et al. Electrical Substrate Ablation for Refractory Ventricular Fibrillation: Results of the AVATAR Study. Circ Arrhythm Electrophysiol. 2021;14:e008868. [DOI] [PMC free article] [PubMed] [Google Scholar]
- 30.Betensky BP, Park RE, Marchlinski FE, Hutchinson MD, Garcia FC, Dixit S, Callans DJ, Cooper JM, Bala R, Lin D, et al. The V(2) transition ratio: a new electrocardiographic criterion for distinguishing left from right ventricular outflow tract tachycardia origin. J Am Coll Cardiol. 2011;57:2255–62. [DOI] [PubMed] [Google Scholar]
- 31.Griffith DA. The boundary value problem in spatial statistical analysis. Journal of Regional Science. 1983;23:377–87. [DOI] [PubMed] [Google Scholar]
- 32.Martin RJ. Some Comments on Correction Techniques for Boundary Effects and Missing Value Techniques. Geographical Analysis. 1987;19:273–82. [Google Scholar]
- 33.Aguado-Sierra J, Krishnamurthy A, Villongco C, Chuang J, Howard E, Gonzales MJ, Omens J, Krummen DE, Narayan S, Kerckhoffs RC, et al. Patient-specific modeling of dyssynchronous heart failure: a case study. Prog Biophys Mol Biol. 2011;107:147–55. [DOI] [PMC free article] [PubMed] [Google Scholar]
- 34.Casaclang-Verzosa G, Gersh BJ and Tsang TS. Structural and functional remodeling of the left atrium: clinical and therapeutic implications for atrial fibrillation. J Am Coll Cardiol. 2008;51:1–11. [DOI] [PubMed] [Google Scholar]
- 35.St John Sutton M, Lee D, Rouleau JL, Goldman S, Plappert T, Braunwald E and Pfeffer MA. Left ventricular remodeling and ventricular arrhythmias after myocardial infarction. Circulation. 2003;107:2577–82. [DOI] [PubMed] [Google Scholar]
- 36.Wang K, Ho SY, Gibson DG and Anderson RH. Architecture of Atrial Musculature in Humans. Brit Heart J. 1995;73:559–565. [DOI] [PMC free article] [PubMed] [Google Scholar]
- 37.Strauss DG and Selvester RH. The QRS complex--a biomarker that “images” the heart: QRS scores to quantify myocardial scar in the presence of normal and abnormal ventricular conduction. J Electrocardiol. 2009;42:85–96. [DOI] [PubMed] [Google Scholar]
- 38.Nguyen UC, Claridge S, Vernooy K, Engels EB, Razavi R, Rinaldi CA, Chen Z and Prinzen FW. Relationship between vectorcardiographic QRSarea, myocardial scar quantification, and response to cardiac resynchronization therapy. J Electrocardiol. 2018;51:457–463. [DOI] [PubMed] [Google Scholar]
- 39.Akoum N, Daccarett M, McGann C, Segerson N, Vergara G, Kuppahally S, Badger T, Burgon N, Haslam T, Kholmovski E, et al. Atrial fibrosis helps select the appropriate patient and strategy in catheter ablation of atrial fibrillation: a DE-MRI guided approach. Journal of cardiovascular electrophysiology. 2011;22:16–22. [DOI] [PMC free article] [PubMed] [Google Scholar]
- 40.Arentz T, Weber R, Burkle G, Herrera C, Blum T, Stockinger J, Minners J, Neumann FJ and Kalusche D. Small or large isolation areas around the pulmonary veins for the treatment of atrial fibrillation? Results from a prospective randomized study. Circulation. 2007;115:3057–63. [DOI] [PubMed] [Google Scholar]
- 41.Verma A, Jiang CY, Betts TR, Chen J, Deisenhofer I, Mantovan R, Macle L, Morillo CA, Haverkamp W, Weerasooriya R, et al. Approaches to catheter ablation for persistent atrial fibrillation. The New England journal of medicine. 2015;372:1812–22. [DOI] [PubMed] [Google Scholar]
- 42.Feld GK, Fleck RP, Chen PS, Boyce K, Bahnson TD, Stein JB, Calisi CM and Ibarra M. Radiofrequency catheter ablation for the treatment of human type 1 atrial flutter. Identification of a critical zone in the reentrant circuit by endocardial mapping techniques. Circulation. 1992;86:1233–40. [DOI] [PubMed] [Google Scholar]
- 43.Gray RA, Pertsov AM and Jalife J. Spatial and temporal organization during cardiac fibrillation. Nature. 1998;392:75–8. [DOI] [PubMed] [Google Scholar]
- 44.Haissaguerre M, Hocini M, Cheniti G, Duchateau J, Sacher F, Puyo S, Cochet H, Takigawa M, Denis A, Martin R, et al. Localized Structural Alterations Underlying a Subset of Unexplained Sudden Cardiac Death. Circ Arrhythm Electrophysiol. 2018;11:e006120. [DOI] [PMC free article] [PubMed] [Google Scholar]
- 45.ten Tusscher KH, Noble D, Noble PJ and Panfilov AV. A model for human ventricular tissue. American journal of physiology Heart and circulatory physiology. 2004;286:H1573–89. [DOI] [PubMed] [Google Scholar]
- 46.Koivumaki JT, Korhonen T and Tavi P. Impact of sarcoplasmic reticulum calcium release on calcium dynamics and action potential morphology in human atrial myocytes: a computational study. PLoS Comput Biol. 2011;7:e1001067. [DOI] [PMC free article] [PubMed] [Google Scholar]
- 47.Niederer SA, Kerfoot E, Benson AP, Bernabeu MO, Bernus O, Bradley C, Cherry EM, Clayton R, Fenton FH, Garny A, et al. Verification of cardiac tissue electrophysiology simulators using an N-version benchmark. Philos T R Soc A. 2011;369:4331–4351. [DOI] [PMC free article] [PubMed] [Google Scholar]
- 48.Narayan SM, Patel J, Mulpuru S and Krummen DE. Focal impulse and rotor modulation ablation of sustaining rotors abruptly terminates persistent atrial fibrillation to sinus rhythm with elimination on follow-up: a video case study. Heart Rhythm. 2012;9:1436–9. [DOI] [PMC free article] [PubMed] [Google Scholar]
- 49.Tison GH, Sanchez JM, Ballinger B, Singh A, Olgin JE, Pletcher MJ, Vittinghoff E, Lee ES, Fan SM, Gladstone RA, et al. Passive Detection of Atrial Fibrillation Using a Commercially Available Smartwatch. JAMA Cardiol. 2018;3:409–416. [DOI] [PMC free article] [PubMed] [Google Scholar]
- 50.Rogers AJ, Selvalingam A, Alhusseini MI, Krummen DE, Corrado C, Abuzaid F, Baykaner T, Meyer C, Clopton P, Giles W, et al. Machine Learned Cellular Phenotypes in Cardiomyopathy Predict Sudden Death. Circ Res. 2021;128:172–184. [DOI] [PMC free article] [PubMed] [Google Scholar]
- 51.Jalaleddine SM, Hutchens CG, Strattan RD and Coberly WA. ECG data compression techniques--a unified approach. IEEE Trans Biomed Eng. 1990;37:329–43. [DOI] [PubMed] [Google Scholar]
Associated Data
This section collects any data citations, data availability statements, or supplementary materials included in this article.