Abstract
A gene designated varR (for virginiae antibiotic resistance regulator) was identified in Streptomyces virginiae 89 bp downstream of a varS gene encoding a virginiamycin S (VS)-specific transporter. The deduced varR product showed high homology to repressors of the TetR family with a conserved helix-turn-helix DNA binding motif. Purified recombinant VarR protein was present as a dimer in vitro and showed clear DNA binding activity toward the varS promoter region. This binding was abolished by the presence of VS, suggesting that VarR regulates transcription of varS in a VS-dependent manner. Northern blot analysis revealed that varR was cotranscribed with upstream varS as a 2.4-kb transcript and that VS acted as an inducer of bicistronic transcription. Deletion analysis of the varS promoter region clarified two adjacent VarR binding sites in the varS promoter.
Streptomyces species are gram-positive filamentous bacteria that are well-known for producing a vast array of bioactive compounds, including more than 70% of the commercially important antibiotics. The production of antibiotics by these organisms is regulated by a variety of physiological and nutritional conditions, often coordinated with processes of morphological differentiation, such as formation of aerial mycelia and spores. A detailed knowledge of the signal cascade and the genetic components involved in antibiotic production will enable the construction of strains that can overproduce these commercially important compounds.
Previous studies have shown that antibiotic production and/or morphological differentiation is controlled in some Streptomyces species by low-molecular-weight compounds called γ-butyrolactone autoregulators (28, 34). Because the γ-butyrolactone autoregulators are effective at an extremely low concentration and their signal is transmitted into cells by binding to specific cytoplasmic receptor proteins, the autoregulators are regarded as Streptomyces hormones. To date, 10 γ-butyrolactone autoregulators have been isolated and have had their structures chemically identified (33). Among the γ-butyrolactone autoregulators and receptor proteins identified so far, virginiae butanolides (VBs) of Streptomyces virginiae (18, 26, 32) and the VB receptor protein (BarA) (16, 23) are two of the most frequently studied, and the VB-BarA system has been confirmed to regulate the coordinate production of two structurally different compounds, virginiamycin M1 (VM1) and virginiamycin S (VS), a pair of antibiotics that show strong synergistic bactericidal activity (22).
Previous in vitro (16) and in vivo analyses (16, 22) have demonstrated that the VB receptor BarA is a DNA binding transcriptional repressor. In the absence of VB, BarA binds to the specific DNA sequences in the promoter region of a target gene(s) and/or operon(s), which represses the transcription. When VB is produced, binding of VB to DNA-bound BarA results in the dissociation of BarA from the promoter region, which initiates the transcription of the target gene and/or operon. In our previous study, a target operon designated barB-varS was located immediately downstream of the barA gene, and the varS gene was shown to encode a VS-specific efflux protein taking part in virginiamycin resistance (20). In the course of this earlier study, it was noticed that varS was also transcribed with the downstream region, and the transcript was increased by the presence of VS, suggesting the presence of complex regulation on virginiamycin resistance.
In this study, to clarify the overall regulation mechanism governing virginiamycin resistance, the varS downstream region was sequenced and an open reading frame (ORF) (varR) encoding a TetR-type repressor was identified. A transcriptional analysis of varR, as well as an in vitro gel-shift analysis using the recombinant VarR protein, demonstrated that VarR is a DNA binding regulator which mediates the VS-dependent transcription of the varS gene.
MATERIALS AND METHODS
Strains, growth conditions, and plasmids.
S. virginiae (strain MAFF 10-06014; National Food Research Institute, Ministry of Agriculture, Forestry, and Fisheries, Tsukuba, Japan) was grown at 28°C as described previously (15, 32). pUC18 and pUC19 were used for genetic manipulation in Escherichia coli, and pUC19 was used for DNA sequencing. For the genetic manipulation in E. coli, strain DH5 α (10) was used. DNA manipulations in E. coli were performed as described by Sambrook et al. (27).
Chemicals.
All chemicals were of reagent or high-performance liquid chromatography (HPLC) grade and were purchased from either Nacalai Tesque (Osaka, Japan), Takara Shuzo (Shiga, Japan), or Wako Pure Chemical Industries, Ltd. (Osaka, Japan). The RNA ladder was obtained from GIBCO BRL (Gaithersburg, Md.). [α-32P]dCTP was purchased from ICN Biomedicals Inc. (Costa Mesa, Calif.). VM1 and VS were purified by a previously described method (19).
DNA sequencing and sequence analysis.
The nucleotide sequence was determined for both strands using an ALF red DNA sequencer (Amersham Pharmacia Biotech, Tokyo, Japan). Sequencing reactions were carried out with a Thermo sequencing kit (Amersham Pharmacia Biotech) according to the manufacturer's instructions. Homology searches were carried out using the programs BLAST (1) and FASTA (25).
RNA preparation and Northern blot analysis.
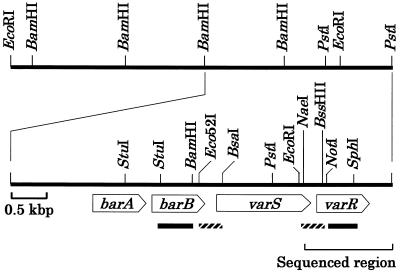
Total RNA was isolated by the method of Kirby et al. (17), with modifications by Hopwood et al. (13), and was quantified by absorbance at 260 nm. RNA (10 μg) was loaded on each lane, electrophoresed on a 1.2% agarose gel, and transferred to Hybond-N+ (Amersham Pharmacia Biotech) according to the manufacturer's recommendations. Hybridization was carried out at 65°C for 1 h in Rapid-hyb buffer (Amersham Pharmacia Biotech) followed by washing of the blot three times at 50°C for 10 min with 2× SSC (1× SSC contains 0.015 M sodium citrate and 0.15 M NaCl [pH 7.7]) containing 0.1% sodium dodecyl sulfate (SDS). The NotI-SphI and StuI-BamHI fragments were used as specific probes against varR and barB, respectively (Fig. 1). The DNA fragments were labeled with [α-32P]dCTP by using the random primer DNA labeling kit (version 2) (Takara Shuzo Co.).
FIG. 1.
Gene organization in the 6.8-kb BamHI-PstI region containing varS in S. virginiae. Probes used for the Northern blot analysis of barB (StuI-BamHI fragment) and varR (NotI-SphI fragment) are indicated by solid boxes. Intergenic regions between barB and varS (Eco52I-BsaI fragment; SVK14.2 in Fig. 5A) and between varS and varR (NaeI-BssHII fragment; SVK13.1 in Fig. 5A) used for the gel-shift assay are indicated by shaded boxes. These fragments were cloned in pUC19 and were FITC labeled as described in Materials and Methods.
Overexpression of varR and purification of recombinant VarR protein (rVarR).
varR was amplified by PCR using oligonucleotides 5′-ATACATATGTGGCCGCCAAGCGCGC-3′ and 5′-TATGGATCCCAGTCACACATGCCGGC-3′ containing artificial NdeI and BamHI recognition sites, respectively. The amplified product was digested with NdeI and BamHI and was ligated into NdeI-BamHI-digested pET32a(+) (Novagen, Madison, Wis.), resulting in six surplus His codons at the 3′ end of varR. This plasmid (pVN303) was introduced into E. coli BL21(DE3)/pLysS, and the transformed cells were cultured in Luria broth containing ampicillin (25 μg/ml) and chloramphenicol (25 μg/ml). When growth reached an absorbance of 0.6 at 600 nm, isopropyl-β-d-thiogalactopyranoside (IPTG) (final concentration of 1 mM) was added to the culture, followed by a further 2 h of cultivation. Cells were harvested by centrifugation at 7,000 × g for 15 min at 4°C, washed with 0.05 M triethanolamine-HCl (pH 7), and resuspended in buffer A [0.05 M triethanolamine-HCl (pH 7) containing 0.2 M KCl, 20% (vol/vol) glycerol, 5 mM dithiothreitol (DTT), and 0.5 mM p-amidinophenylmethanesulfonyl fluoride]. The cells were disrupted by sonication for 2 min at 25% duty cycle (Branson Sonifier 250) in an ice bath, followed by centrifugation at 10,000 × g for 15 min at 4°C to obtain a supernatant as crude lysate.
The crude lysate was applied to a DEAE-Sephacel column, and the adsorbed proteins were eluted with a linear gradient of KCl concentrations from 0.1 to 0.5 M in 50 mM triethanolamine-HCl containing 20% (vol/vol) glycerol (pH 7). Fractions containing rVarR were mixed and loaded on a Ni-NTA column (Qiagen, Tokyo, Japan). Unbound proteins were washed out with buffer A (minus DTT) containing 0.1 mM imidazole, and rVarR was eluted with buffer A (minus DTT) containing 10 mM imidazole.
Preparation of crude lysate from S. virginiae.
The S. virginiae culture was initiated by inoculating 2.1 ml of preculture into 70 ml of f medium (15) in a 500-ml baffled flask. After cultivation at 28°C for 14 h on a reciprocating shaker (120 strokes per min), cells were harvested by centrifugation (3,000 × g, 10 min, 4°C). The cells were suspended in buffer A and were disrupted by sonication as described above. After centrifugation, the supernatant was stored at −20°C and was used as the source of native VarR of S. virginiae.
Gel-shift assay.
The binding mixture consisted of a protein sample (100 μg of crude lysate or 20 μg of purified rVarR) and 0.5 nM fluorescein isothiocyanate (FITC)-labeled fragment in 1× binding buffer [50 mM triethanolamine-HCl (pH 7.0) containing 0.2 M KCl, 10% (vol/vol) glycerol, and 1.5 μg of poly(dI-dC) · poly(dI-dC)] in a total volume of 20 μl. After incubation at 25°C for 10 min, the reaction mixture was separated at 4°C by electrophoresis on a high-ionic-strength gel containing 5% acrylamide and 0.167% N, N′-methylenebisacrylamide with a running buffer of 50 mM Tris-HCl (pH 8.5) containing 380 mM glycine and 2 mM EDTA. The DNA fragments in the gel were detected by a fluorometry scanner (FMBIO; Hitachi). The FITC labeling was performed by PCR on fragments subcloned in pUC19 as templates, using an FITC-labeled forward primer (5′ FITC-CGCCAGGGTTTTCCCAGTCACGAC-3′) and a reverse primer (5′ FITC-TTTCACACAGGAAACAGCTATGAC-3′).
Nucleotide sequence accession number.
The nucleotide sequence data reported in this paper has been submitted to the DDBJ/EMBL/GenBank data bank as accession number AB046994.
RESULTS AND DISCUSSION
Sequence of the varS downstream region and identification of the varR gene.
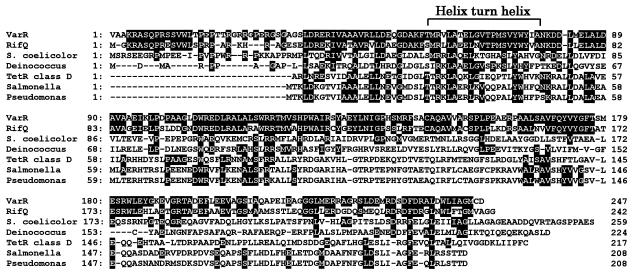
To search for regulatory genes responsible for the VS-dependent increase in the varS transcript, the 0.9-kb region downstream of varS was sequenced. FRAME analysis (3) of the region identified a 744-bp ORF starting 89 bp downstream of the varS stop codon in the same direction as varS (Fig. 1). The ORF product (247 amino acids, Mr = 27,296) showed significant homology with Amycolatopsis mediterranei RifQ (63% identity, 78% similarity), a transcriptional repressor for the rifamycin efflux protein RifP (2). Moderate homology of 33 to 38% identity was also observed with several transcriptional repressors, such as a class D tetracycline repressor of E. coli (TetR) or a TetR homolog of Streptomyces coelicolor. Multiple alignment of the deduced ORF product with the member repressors of the TetR family revealed that the most significant identity exists at an amino-terminal region containing a helix-turn-helix DNA binding motif (Fig. 2). The presence of the helix-turn-helix structure was also supported by the high score (SD score of 5.18) for the prediction of the motif (7). Thus, the ORF can be assumed to encode a DNA binding regulator and was designated varR (for virginiae antibiotic resistance regulator) due to its regulatory function on varS transcription (described in detail below).
FIG. 2.
Multiple alignment of VarR and several repressors of the TetR family, including a repressor of rifamycin resistance from A. mediterranei (RifQ) (2, 14), a TetR homolog from S. coelicolor (8), a transcriptional regulator of Deinococcus radiodurans (Deinococcus) (31), a class D tetracycline repressor of E. coli (TetR class D) (30), TetR of Salmonella enterica serovar Typhimurium DT104 (Salmonella) (5), and TetR of Pseudomonas sp. (Pseudomonas) (29). Identical residues are indicated by white letters in black boxes.
Transcriptional analysis of the varR gene.
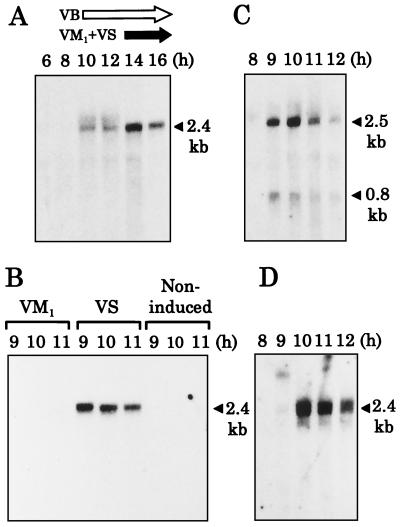
To deduce the in vivo function of varR, the time course of the transcription was investigated by Northern blot analysis using the varR-coding region as a probe against RNA samples from 8- to 16-h cultures of S. virginiae (Fig. 3A). Although the signals were faint, varR transcript was detected as a 2.4-kb band in the 10- and 12-h samples, and the signal intensity reached a maximum at 14 h of cultivation, which agreed well with the onset of virginiamycin production in S. virginiae (16). Because the size of the transcript (2.4 kb) was far larger than that of varR alone (0.7 kb), and because the upstream varS-specific probe hybridized to the same band (20) while the probe covering the downstream region did not (data not shown), we concluded that varR formed an operon with the upstream varS gene. This conclusion agreed well with the lack of typical promoter sequences in the 5′ untranslated region of varR and the presence of an inverted repeat in the 3′ region of varR (ΔG = −9.1 kcal) as a plausible transcriptional terminator.
FIG. 3.
Northern blot hybridization analysis of varR transcription. (A) varR transcription during cultivation of S. virginiae. Total RNA was extracted from cells cultivated for the indicated period at 28°C. Under the experimental conditions, the production of VB and virginiamycin started at 10 and 14 h of cultivation, respectively, as shown by arrows above the lanes. (B) The effect of virginiamycin addition on the transcription of varR. VM1 (10 μg/ml) or VS (10 μg/ml) was added to the culture at 8 h of cultivation. The term noninduced indicates that virginiamycin was not added. (C and D) Effect of VB addition on the transcription of barB (C) and varR (D). RNA was prepared from cells with VB (VB-C6, 300 nM) added at 8 h of cultivation. A varR-specific probe (NotI-SphI fragment, shown in Fig. 1) was used in panels A, B, and D to detect the 2.4-kb varS-varR transcript, and a barB-specific probe (StuI-BamHI fragment, shown in Fig. 1) was used in panel C to detect the 2.5-kb barB-varS transcript.
Our previous analysis of the barB-varS operon (20) and the present data on the varS-varR operon indicated that the varS gene is transcribed in three different ways: as a monocistronic transcript (1.6 kb) (20), as a bicistronic barB-varS transcript (2.5 kb) (20), and as a bicistronic varS-varR transcript (2.4 kb). The presence of a perfectly matched inverted repeat sequence 10 bp downstream of the varS stop codon seems to dictate that the transcriptional termination is after varS. Although the barB-varS transcript and the varS-varR transcript are very similar in size, they can be easily distinguished by use of specific probes, such as those internal to barB and varR. Just as in a previous study, where the use of the varS-specific probe confirmed that the 2.4-kb bicistronic transcription was induced by the presence of VS (20), in the present study the varR-specific probe confirmed that the transcription of the varS-varR operon was induced by the addition of VS at 8 h of cultivation but not by VM1 (a synergistic counterpart of VS in the virginiamycin mixture) (Fig. 3B).
The effect of VB on the transcription of the varS-varR operon was also investigated by adding VB at 8 h of cultivation (Fig. 3C and D). Just as in our previous study (20), we observed a large increase of the 2.5-kb barB-varS bicistronic transcript 1 h after the VB addition (Fig. 3C), which is the typical induction pattern under the direct control of the VB-BarA system. The 0.8-kb band seemed to be the degradation product from the 2.5-kb transcript by posttranscriptional processing. With regard to the 2.4-kb varS-varR bicistronic transcript, however, induction was observed only 2 h after the VB addition (10 h of cultivation) (Fig. 3D), which suggests that the VB-BarA system does not directly control the varS-varR transcription.
Overproduction and purification of rVarR.
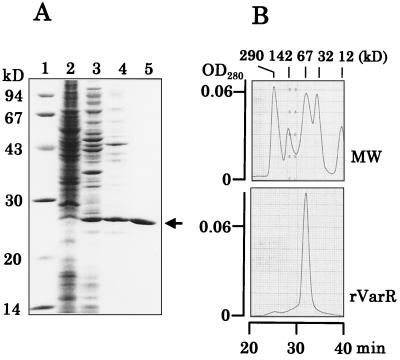
To evaluate the actual function of VarR, we overexpressed rVarR in E. coli. rVarR with six surplus histidine residues at the C terminus was purified with successive chromatographies on a DEAE-Sephacel and a Ni-NTA column, and the purity was confirmed by SDS-polyacrylamide gel electrophoresis (Fig. 4A). A protein of 27 kDa was observed in the extracts of IPTG-induced cells carrying the varR gene in pET32a(+) (pVN303; see Materials and Methods for its construction), whereas the corresponding band was absent in the extracts of cells carrying vector pET32a(+). The molecular mass of 27 kDa agreed well with that calculated from the nucleotide sequence (Mr = 27,296), and N-terminal amino sequencing of the purified sample confirmed that the 27-kDa protein is rVarR (data not shown). The native molecular size of the purified rVarR was determined to be 67 kDa by molecular-sieve HPLC on a TSK gel G3000SWXL (TOSO) column (Fig. 4B). Therefore, we concluded that rVarR existed as a dimer consisting of two 27-kDa subunits, similar to the cases of other member repressors of the TetR family (5, 12, 29, 30).
FIG. 4.
(A) Overexpression and purification of rVarR. A sample from each purification step was separated on an SDS–10% polyacrylamide gel and was stained with Coomassie brilliant blue R-250 (27). Lane 1, molecular mass protein standard; lane 2, crude lysate (10 μg) of E. coli BL21(DE3)/pLysS containing pET32a as a negative control; lane 3, crude lysate (10 μg) of E. coli BL21(DE3)/pLysS containing pVN303; lane 4, eluate (7 μg) from DEAE-Sephacel chromatography; lane 5, eluate (7 μg) from Ni-NTA affinity chromatography. The arrow indicates the position of rVarR. (B) The elution profile of the purified rVarR from the molecular-sieve HPLC on a TSK gel G3000SWXL (TOSO) column. MW indicates the elution profiles of the standard proteins having the molecular masses shown above the figure. OD280, optical density at 280 nm.
In vitro functional analysis of VarR.
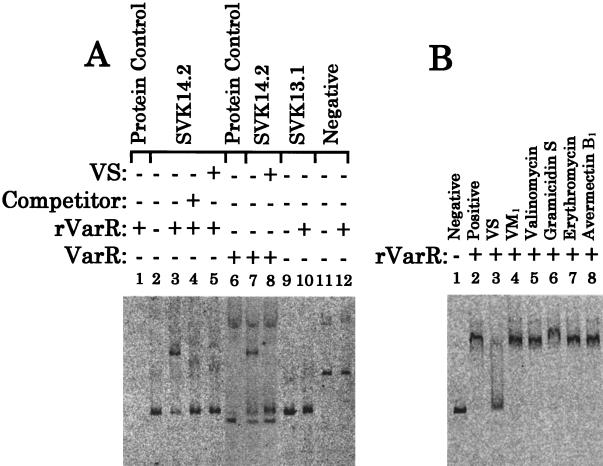
To clarify the function of VarR, the DNA binding ability of both the purified rVarR and the natural VarR of S. virginiae was assessed by gel-shift assay (Fig. 5) against an FITC-labeled Eco52I-BsaI fragment (SVK14.2) (Fig. 1). This fragment covers the intergenic region between barB and varS and corresponds to nucleotides (nt) −163 to +23 relative to the transcription start site of varS. rVarR showed a clear band shift (Fig. 5A, lane 3), and the specific nature of the binding was confirmed by competition with the unlabeled fragment (Fig. 5A, lane 4). An identical specific binding was observed when crude lysate of S. virginiae was used as a source of native VarR (Fig. 5A, lane 7), thereby confirming that the C-terminal six surplus His residues are not detrimental to the function of rVarR. When the FITC-labeled NaeI-BssHII fragment (SVK13.1) covering the varS-varR intergenic region was used, no band shift was observed (Fig. 5A, lane 10). These results indicated that rVarR specifically binds to the 5′ upstream region of varS, not to the 5′ upstream region of varR. This result seems to corroborate the bicistronic nature of the varS-varR operon.
FIG. 5.
Gel-shift analyses on the DNA binding activity of VarR. (A) DNA binding activity of purified rVarR to the FITC-labeled SVK14.2 (lanes 2 through 5), to SVK13.1 (lanes 9 and 10), and to the coding region of the gene rplk (24), which encodes the 50S ribosomal protein L11, as a negative control (lanes 11 and 12, designated negative). See Fig. 1 for the regions covered by SVK14.2 and SVK13.1. A nonlabeled barB-varS intergenic fragment (0.5 nM) was added in lane 4 as competitor DNA. Lanes 5 and 8 contained 0.5 mM VS. The activity of native VarR in the crude lysate from S. virginiae (VarR) to SVK14.2 was tested in lanes 6, 7, and 8. The crude protein from S. virginiae was obtained from a 14-h culture, at which time the transcription of varR reached a maximum (Fig. 3A). FITC-labeled probe was omitted in lanes 1 and 6. The lowest band and the top band in lanes 6, 7, and 8 are nonspecific fluorescence bands due to unknown contaminants in the crude lysate. (B) The effect of several antibiotics on the DNA binding activity of rVarR. VS was added at a concentration of 0.5 mM. Antibiotics other than VS were added at a concentration of 50 mM.
When VS was present in the reaction mixture of the gel-shift assay, the binding of VarR to the varS upstream region was clearly inhibited (Fig. 5A, lanes 5 and 8, and B, lane 3). This inhibition was specific by VS, as evident from the lack of signs of inhibition by the other antibiotics tested (two peptidic antibiotics [valinomycin and gramicidin S] and three polyunsaturated macrolactone antibiotics [VM1, erythromycin, and avermectin B1]), even at a concentration 100 times higher than that of VS (Fig. 5B). From these results, it can be proposed that VarR plays a central role in the VS-dependent induction of the varS-varR operon. VarR seems to repress the transcription of the varS-varR operon by binding to the varS promoter region until the onset of VS production. When VS production starts, the repression is relieved through the dissociation of VarR from the promoter region of varS.
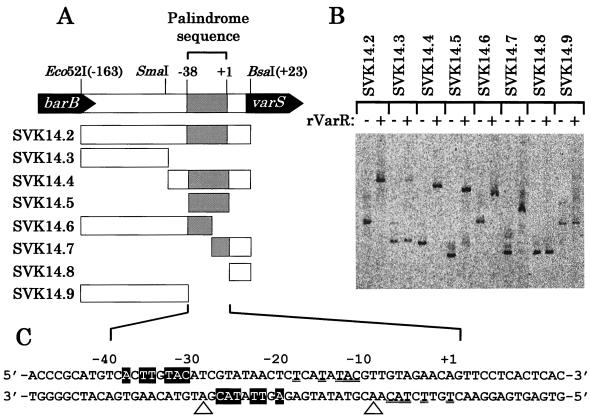
To localize more precisely the VarR binding region, a gel-shift assay was conducted with various shorter fragments from the barB-varS intergenic region (Fig. 6A). Gel-shift assays against SVK14.3 and SVK14.4 revealed that VarR bound to the right half of the region corresponding to nt −60 to +23 relative to the transcriptional start site of varS (Fig. 6B). Because the target sequence of a DNA binding protein often shows a dyad symmetry reflecting the symmetrical structure of the dimeric protein (21), dyad sequences were surveyed in SVK14.4, and two sequences (nt −39 to −20 and −19 to +2) were found to be plausible VarR binding sites (Fig. 6C). The region SVK14.5 containing the two dyad sequences (nt −39 to +2) showed clear binding with VarR, whereas the rest of SVK14.2 (SVK14.8 for nt +1 to +23 and SVK14.9 for nt −163 to −40) did not, indicating that the VarR binding sites should be in the region of nt −39 to +2 (Fig. 6B). Because the VarR binding sites overlapped with the predicted binding sites for RNA polymerase (both the nt −35 and −10 elements), it seems likely that the transcription of varS is repressed when VarR remains bound at these sites.
FIG. 6.
Determination of VarR binding sites. (A) Fragment map of the barB-varS intergenic region used for the gel-shift assay. The Eco52I-BsaI fragment was designated SVK14.2. The fragment for nt −39 to +2 (SVK14.5) was PCR-amplified by primers 5′-TCGGAATTCTCACTTGTACATCGTAT-3′ and 5′-TTAGCATGCACTGTTCTACAACGTAT-3′. The fragment for nt −163 to −19 (SVK14.6) was amplified by primers 5′-ATAGAATTCACGTCCGGCGCGCGCC-3′ and 5′-GCCGCATGCGAGTTATACGATGTACAAG-3′, and the fragment for nt −19 to +23 (SVK14.7) was amplified by primers 5′-CGCGAATTCCTCATATACGTTGTAGAAC-3′ and 5′-TATGCATGCGAGACCTCCCAGGAGTG-3′. The fragment for nt −163 to −40 (SVK14.8) was amplified by primers 5′-ATAGAATTCACGTCCGGCGCGCGCC-3′ and 5′-ATACTGCAGACATGCGGGTGAAGCCTG-3′, and the fragment for nt +3 to +23 (SVK14.9) was amplified by primers 5′-GCGGAATTCTTCCTCACTCACTCCTGG-3′ and 5′-TATGCATGCGAGACCTCCCAGGAGTG-3′. All fragments were cloned into SphI-EcoRI sites of pUC19 and then were PCR-amplified with FITC-labeled primers as described in Materials and Methods. (B) Binding of purified rVarR to the fragments. FITC-labeled fragments used for the gel-shift assay are shown above the lanes. (C) Promoter sequence of varS containing two dyad symmetry sequences. The residues showing dyad symmetry are indicated by white letters in black boxes or by double underlining. The open triangles indicate the axis of symmetry for each dyad symmetry sequence.
The two dyad sequences shared 12 consensus nucleotides (5′-NCNTNTACNTNGTANAACN-3′ [boldface indicates con-sensus nucleotide]) (Fig. 6C), but together they can form a large dyad structure, with C at nt −19 as a center of symmetry. To assess whether or not one of the two dyad sequences was sufficient for VarR binding, each of the two dyad sequences was tested for VarR binding (SVK14.6 for nt −163 to −20 and SVK14.7 for nt −19 to +23). Both fragments showed clear retardation by VarR, indicating that there are two adjacent VarR binding sites on the varS promoter. It should be noted that the shift level observed for SVK14.7 was much smaller than that observed for SVK14.5, although these fragments are similar in size. Such a difference in shift level was also observed between SVK14.6 and SVK14.2. These results suggested that fragments containing the two dyad sequences (SVK14.2 and SVK14.5) are bound with a greater number of VarR molecules than fragments containing only one dyad sequence (SVK14.6 and SVK14.7), resulting in greater retardation.
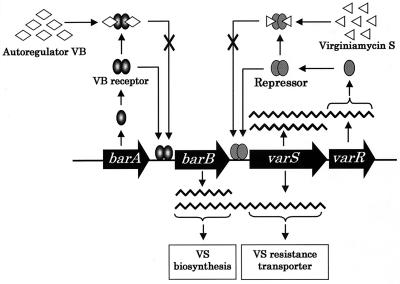
Combining the data presented here with that from previous studies (16, 20), a plausible model for the transcriptional regulation of the varS-varR operon can be deduced as follows (Fig. 7). Before the onset of VB production—and hence before VS production—transcription of varS-varR is likely to be repressed by a small but sufficient amount of VarR derived from basal level transcription of varR. Alternatively, vegetative sigma factor might not work for transcription from the varS promoter. When VB production starts, VB-bound BarA dissociates from the barB promoter and hence induces bicistronic barB-varS transcription, which confers VS resistance before the onset of virginiamycin production. The weak varS-varR transcript detected in this cultivation period (from 10 to 12 h in Fig. 3A) seems to reflect the read-through of RNA polymerase from the barB-varS region into the varS-varR region. When the production of virginiamycin starts, the binding of VS to VarR causes VarR to dissociate from the varS promoter region, thereby leading to derepression of varS-varR transcription.
FIG. 7.
Transcriptional regulation mechanism of the varS-varR operon by VB and VS.
ACKNOWLEDGMENT
This study was supported in part by a grant from the Research for the Future Program of the Japan Society for the Promotion of Science (JSPS).
REFERENCES
- 1.Altschul S F, Gish W, Miller W, Myers E W, Lipman D J. Basic local alignment search tool. J Mol Biol. 1990;215:403–410. doi: 10.1016/S0022-2836(05)80360-2. [DOI] [PubMed] [Google Scholar]
- 2.August P R, Tang L, Yoon Y J, Ning S, Muller R, Yu T W, Taylor M, Hoffann D, Kim C G, Zhang X, Hutchinson C R, Floss H G. Biosynthesis of ansamycin antibiotic rifamycin: deductions from the molecular analysis of the rif biosynthetic gene cluster of Amycolatopsis mediterranei S699. Chem Biol. 1998;5:69–78. doi: 10.1016/s1074-5521(98)90141-7. [DOI] [PubMed] [Google Scholar]
- 3.Bibb M J, Findlay P R, Johnson M W. The relationship between base composition and codon usage in bacterial genes and its use for the simple and reliable identification of protein-coding sequences. Gene. 1984;30:157–166. doi: 10.1016/0378-1119(84)90116-1. [DOI] [PubMed] [Google Scholar]
- 4.Bourn W R, Babb B. Computer assisted identification and classification of Streptomycete promoters. Nucleic Acids Res. 1995;23:3696–3703. doi: 10.1093/nar/23.18.3696. [DOI] [PMC free article] [PubMed] [Google Scholar]
- 5.Briggs C E, Fratamico P M. Molecular characterization of an antibiotic resistance gene cluster of Salmonella typhimurium DT104. Antimicrob Agents Chemother. 1999;43:846–849. doi: 10.1128/aac.43.4.846. [DOI] [PMC free article] [PubMed] [Google Scholar]
- 6.Caballero J L, Malpartida F, Hopwood D A. Transcriptional organization and regulation of an antibiotic export complex in the producing Streptomyces culture. Mol Gen Genet. 1991;228:372–380. doi: 10.1007/BF00260629. [DOI] [PubMed] [Google Scholar]
- 7.Dodd I B, Egan J B. Improve detection of helix-turn-helix DNA-binding motif in protein sequences. Nucleic Acids Res. 1990;18:5019–5026. doi: 10.1093/nar/18.17.5019. [DOI] [PMC free article] [PubMed] [Google Scholar]
- 8.Fernandez-Moreno M A, Caballero J L, Hopwood D A, Malpartida F. The act cluster contains regulatory and antibiotic export genes, direct targets for translation control by the bldA tRNA gene of Streptomyces coelicolor. Cell. 1991;66:769–780. doi: 10.1016/0092-8674(91)90120-n. [DOI] [PubMed] [Google Scholar]
- 9.Guilfoile P G, Hutchinson C R. The Streptomyces glaucescens TcmR protein represses transcription of the divergently oriented tcmR and tcmA genes by binding to an intergenic operator region. J Bacteriol. 1992;174:3659–3666. doi: 10.1128/jb.174.11.3659-3666.1992. [DOI] [PMC free article] [PubMed] [Google Scholar]
- 10.Hanahan D. Studies on transformation of Escherichia coli with plasmids. J Mol Biol. 1983;166:557–580. doi: 10.1016/s0022-2836(83)80284-8. [DOI] [PubMed] [Google Scholar]
- 11.Hillen W, Berens C. Mechanisms underlying expression of TN10 encoded tetracycline resistance. Annu Rev Microbiol. 1994;48:345–369. doi: 10.1146/annurev.mi.48.100194.002021. [DOI] [PubMed] [Google Scholar]
- 12.Hinrichs W, Kisker C, Duvel M, Muller A, Tover K, Hillen W, Saenger W. Structure of the Tet repressor-tetracycline complex and regulation of antibiotic resistance. Science. 1994;264:418–420. doi: 10.1126/science.8153629. [DOI] [PubMed] [Google Scholar]
- 13.Hopwood D A, Bibb M J, Chater K F, Bruton C J, Kieser H M, Lydiate D J, Smith C P, Ward J M, Schrempf H. Genetic manipulation of Streptomyces: a laboratory manual. Norwich, United Kingdom: The John Innes Foundation; 1985. [Google Scholar]
- 14.Kim C G, Yu T W, Fryhle C, Handa S, Floss H G. 3-Amino-5-hydroxybenzoic acid synthase, the terminal enzyme in the formation of the precursor of mC7N units in rifamycin and related antibiotics. J Biol Chem. 1998;273:6030–6040. doi: 10.1074/jbc.273.11.6030. [DOI] [PubMed] [Google Scholar]
- 15.Kim H S, Nihira T, Tada H, Yanagimoto M, Yamada Y. Identification of binding protein of virginiae butanolide C, an autoregulator in virginiamycin production, from Streptomyces virginiae. J Antibiot. 1989;42:769–778. doi: 10.7164/antibiotics.42.769. [DOI] [PubMed] [Google Scholar]
- 16.Kinosita H, Ipposhi H, Okamoto S, Nakano H, Nihira T, Yamada Y. Butyrolactone autoregulator receptor protein (BarA) as a transcriptional regulator in Streptomyces virginiae. J Bacteriol. 1997;179:6986–6993. doi: 10.1128/jb.179.22.6986-6993.1997. [DOI] [PMC free article] [PubMed] [Google Scholar]
- 17.Kirby T, Fox-Carter E, Guest M. Isolation of deoxyribonucleic acid and ribosomal ribonucleic acid from bacteria. Biochem J. 1967;104:258–262. doi: 10.1042/bj1040258. [DOI] [PMC free article] [PubMed] [Google Scholar]
- 18.Kondo K, Higuchi Y, Sakuda S, Nihira T, Yamada Y. New virginiae butanolides from Streptomyces virginiae. J Antibiot. 1989;42:1873–1876. doi: 10.7164/antibiotics.42.1873. [DOI] [PubMed] [Google Scholar]
- 19.Lee C K, Minami M, Sakuda S, Nihira T, Yamada Y. Stereospecific reduction of virginiamycin M1 as the virginiamycin resistance pathway in Streptomyces virginiae. Antimicrob Agents Chemother. 1996;40:595–601. doi: 10.1128/aac.40.3.595. [DOI] [PMC free article] [PubMed] [Google Scholar]
- 20.Lee C K, Kamitani Y, Nihira T, Yamada Y. Identification and in vivo functional analysis of virginiamycin S resistance gene (varS) from Streptomyces virginiae. J Bacteriol. 1998;181:3293–3297. doi: 10.1128/jb.181.10.3293-3297.1999. [DOI] [PMC free article] [PubMed] [Google Scholar]
- 21.Lewin B. Genes VI. New York, N.Y: Oxford University Press; 1997. pp. 348–353. [Google Scholar]
- 22.Nakano H, Takehara E, Nihira T, Yamada Y. Gene replacement analysis of the Streptomyces virginiae barA gene encoding the butyrolactone autoregulator receptor reveals that BarA acts as a repressor in virginiamycin biosynthesis. J Bacteriol. 1998;180:3317–3322. doi: 10.1128/jb.180.13.3317-3322.1998. [DOI] [PMC free article] [PubMed] [Google Scholar]
- 23.Okamoto S, Nakajima K, Nihira T, Yamada Y. Virginiae butanolide binding protein from Streptomyces virginiae. J Biol Chem. 1995;270:12319–12326. doi: 10.1074/jbc.270.20.12319. [DOI] [PubMed] [Google Scholar]
- 24.Okamoto S, Nihira T, Kataoka H, Suzuki A, Yamada Y. Purification and molecular cloning of a butyrolactone autoregulator receptor from Streptomyces virginiae. J Biol Chem. 1992;267:1093–1098. [PubMed] [Google Scholar]
- 25.Pearson W R, Lipman D J. Imported tools for biological sequence comparison. Proc Natl Acad Sci USA. 1988;85:2444–2446. doi: 10.1073/pnas.85.8.2444. [DOI] [PMC free article] [PubMed] [Google Scholar]
- 26.Sakuda S, Yamada Y. Stereochemistry of butyrolactone autoregulators from Streptomyces. Tetrahedron Lett. 1991;32:1817–1820. [Google Scholar]
- 27.Sambrook J, Fritsch E F, Maniatis T. Molecular cloning: a laboratory manual. 2nd ed. Cold Spring Harbor, N.Y: Cold Spring Harbor Laboratory Press; 1989. [Google Scholar]
- 28.Sato K, Nihira T, Sakuda S, Yanagimoto M, Yamada Y. Isolation and structure of a new butyrolactone autoregulator from Streptomyces sp. FRI-5. J Ferment Bioeng. 1989;68:170–173. [Google Scholar]
- 29.Schnabel E L, Jones A L. Distribution of tetracycline resistance genes and transposons among phylloplane bacteria in Michigan apple orchards. Appl Environ Microbiol. 1999;65:4898–4907. doi: 10.1128/aem.65.11.4898-4907.1999. [DOI] [PMC free article] [PubMed] [Google Scholar]
- 30.Tovar K, Ernst A, Hillen W. Identification and nucleotide sequence of the class E tet regulatory elements and operator and inducer binding of the encoded purified Tet repressor. Mol Gen Genet. 1988;215:76–80. doi: 10.1007/BF00331306. [DOI] [PubMed] [Google Scholar]
- 31.White O, Eisen J A, Heidelberg J F, Hickey E K, Peterson J D, Dodson R J, Haft D H, Gwinn M L, Nelson W C, Richardson D L, Moffat K S, Qin H, Jiang L, Pamphile W, Crosby M, Shen M, Vamathevan J J, Lam P, McDonald L, Utterback T, Zalewski C, Makarova K S, Aravind L, Daly M J, Minton K W, Fleischmann R D, Ketchum K A, Nelson K E, Salzberg S, Smith H O, Venter J C, Fraser C M. Genome sequence of the radioresistant bacterium Deinococcus radiodurans R1. Science. 1999;286:1571–1577. doi: 10.1126/science.286.5444.1571. [DOI] [PMC free article] [PubMed] [Google Scholar]
- 32.Yamada Y, Sugamura K, Kondo K, Yanagimoto M, Okada H. The structure of inducing factors for virginiamycin production in Streptomyces virginiae. J Antibiot. 1987;40:496–504. doi: 10.7164/antibiotics.40.496. [DOI] [PubMed] [Google Scholar]
- 33.Yamada Y, Nihira T, Sakuda S. Butyrolactone autoregulators, inducers of virginiamycin in Streptomyces virginiae: their structures, biosynthesis, receptor proteins, and induction of virginiamycin biosynthesis. In: Strolhl W R, editor. Biotechnology of antibiotics. New York, N.Y: Marcel Dekker, Inc; 1997. pp. 63–79. [Google Scholar]
- 34.Yanagimoto Y K, Enatsu T. Regulation of blue pigment production by g-nanolactone in Streptomyces sp. J Ferment Technol. 1983;61:545–550. [Google Scholar]


