Abstract
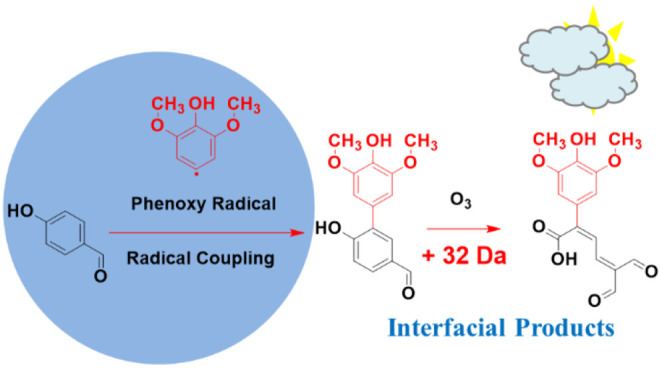
Substantial amounts of phenolic aldehydes, represented by the structures of syringaldehyde, vanillin, and 4-hydroxybenzaldehyde, are emitted to the atmosphere during biomass burning. The oxidative transformation of phenolic aldehydes during atmospheric transport has the potential to modify the physicochemical properties of particulates, which play a vital role in Earth’s climate and human health. Herein, thin solid films made of syringaldehyde, vanillin, and 4-hydroxybenzaldehyde are oxidized in contact with O3(g) under a relative humidity of 74% representative of average global conditions. New physical insights into the surface reactions are achieved by analyzing isopropanol-extracted films before and during oxidation by multiple techniques. Changes in electronic transitions at 220, 310, and 350–400 nm registered by UV–vis spectroscopy show that the oxidized films have enhanced mass absorption coefficients at λ > 300 nm. Electrospray ionization (ESI) mass spectrometry (MS) and ion chromatography with conductivity and MS detection of extracted oxidized films confirm aromatic ring cleavage of syringaldehyde and vanillin by O3(g) with the production of carboxylic acids. Carboxylic acids were observed as anions ([M – H]−) at m/z 45 (formic acid), 73 (glyoxylic acid), 75 (glycolic acid), 89 (oxalic acid), 115 (maleic acid), 117 (mesoxalic acid), 119 (tartronic acid), and 129 (maleic acid monomethyl ester), while other polyfunctional products were registered by ultrahigh-pressure liquid chromatography with UV–vis and MS detection. In situ production of hydroxyl radicals is confirmed by demethoxylation products and ipso attack at the C1 ring position holding the −C(H)=O group. The order of reactivity increased with the number of methoxy substituents that donate electron density to the aromatic ring. Combined oxidation mechanisms for the three compounds are proposed based on all of the experimental observations and explain the contribution of aged biomass burning material to secondary organic aerosol formation.
Introduction
The largest global supply of primary organic carbon from combustion emissions (31.5 Tg y–1)1 is led by biomass burning (as large as 90%), which contributes organic precursors for secondary organic aerosol (SOA) formation.2 SOA affects air quality and plays a fundamental role in climate through aerosol–radiation interaction and as cloud-condensation nuclei.3,4 Lignin in biomass is mainly composed of polymeric hydroxylated aromatic structures made from phenolic compounds, which include aldehyde (−C(H)=O) groups. Upon biomass combustion, fragments of this polymeric material, including phenolic aldehyde monomers, are emitted to the atmosphere.5−8 Moreover, three structurally related phenolic aldehydes, (1) 4-hydroxybenzaldehdye, (2) vanillin, and (3) syringaldehyde, are pervasive in fog and particulate matter found in urban and remote regions affected by biomass burning.9−17 These surfactant species, which have large Henry’s law constants18 (which are typically available in the literature only in water), partition from the gas phase into the liquid phase, which in the atmosphere may have an aqueous or nonaqueous nature. In addition, for the partitioning to occur, mass transfer must proceed through the thin interfacial boundary, a position preferred also by surface-active molecules (such as those selected) in the bulk of atmospheric particles. Thus, phenolic aldehydes can undergo interfacial oxidative aging during atmospheric transport by reactions with ozone (O3), hydroxyl radical (HO•), and nitrate radical (NO3). The oxidized and multifunctional carboxylic acid products are SOA compounds.19−21
Past ozonolysis studies on the surface of silica particles showed the conversion of syringaldehyde and vanillin into syringic acid and vanillic acid, respectively,19 and possibly additional products of increased toxicity.22 An ozonolysis study in bulk water for 4-hydroxybenzaldehyde at pH 4 showed the production of p-hydroquinone, oxaloacetic acid, glyoxylic acid, and oxalic acid.23 The heterogeneous reaction of syringaldehyde was explored using 30 ± 20 times larger [HO•(g)] than the average available in the atmosphere.24 When exposed to actinic radiation and photooxidized in water, phenolic aldehydes can contribute some sunlight-absorbing oligomers of low volatility.25−27
We recently reported how phenolic aldehydes react with O3(g) at the air–water interface in contact times of microseconds at variable pH and are fragmented into multifunctional carboxylic acids. Simultaneously and in a competing pathway, spontaneous electron transfer was found to produce HO• in situ, creating functionalized polyhydroxylated products.28 Monitoring characteristic stretching vibrations representing both pathways during minutes to hours by transmission Fourier transform infrared (FTIR) spectroscopy indicated that a Langmuir–Hinshelwood mechanism controlled the heterogeneous process at the air–solid interface and that the branching ratio of fragmentation to functionalization was ∼75:25.29 However, the reaction products at the air–solid interface remain unknown and could include dimers, trimers, etc., in this physical state at long time scales and generate brown carbon.30,31 Thus, herein we approach the problem of studying the surface reaction under a relative humidity (RH) that represents well the mean global value of 77%,32 using multiple analytical techniques to identify previously missing oligomers from the oxidation of phenolic aldehyde films, key intermediate polyhydroxymethoxyphenols, and their ring-breaking oxidation products. The results below are integrated into mechanistic schemes that explain the transformation of this class of compounds during the transport of biomass-burning plumes.
Experimental Section
Thin-Film Preparation
Thin films were prepared as described previously.30 Briefly, 150.0 μg of syringaldehyde (Alfa Aesar, 99.2%), vanillin (Alfa Aesar, 99.9%), or 4-hydroxybenzaldehyde (Alfa Aesar, 98.7%) was deposited on a 2 mm thick polished ZnSe (PIKE) optical window with a of diameter of 13.0 mm. Drop addition of 50 μL of a 3.0 mg mL–1 solution in isopropanol (Fisher Optima, 99.9%) to smoothly cover the whole surface was followed by 3 h of solvent evaporation to develop a film. All experiments were completed in duplicate by placing between two and six thin films of the same molecule in a reactor, depending on the number of analyses needed.
Oxidation Experiments
Figure 1 provides a diagram of the adapted reactor used30 for the oxidation experiments. A gas flow meter (Aalborg) supplied a constant flow of dry 0.50 L min–1 O2(g) (Scott-Gross, UHP) to a spark discharge O3 generator (Ozone Solutions, Hull, IA, USA). The produced dry O3 was diluted with dry N2(g) (Scott-Gross, UHP) with the help of another flow meter (Aalborg) using from 0.10 to 0.95 L min–1. The diluted dry O3 was finally balanced with wet N2(g) (from 0 to 0.95 L min–1, Aalborg flow meter) to control the relative humidity. The diluted [O3(g)] was measured with a photodiode array UV–vis spectrophotometer (Evolution, Thermo Scientific).30 A 1.00 L min–1 flow of the prepared O3(g) at a fixed RH was fed into a 3.78 L borosilicate glass reactor provided with a Teflon-coated lid. The conditions selected favor turbulent flow in the reactor, which together with the small reaction probabilities measured in related reactions (<10–5) confirms no diffusion limitations.30 A calibrated remote hygrometer (Traceable) was used to monitor the RH. The flow-through system was allowed to equilibrate for at least 1 h before the films were placed inside. The same procedure was used to conduct control experiments without O3(g).
Figure 1.
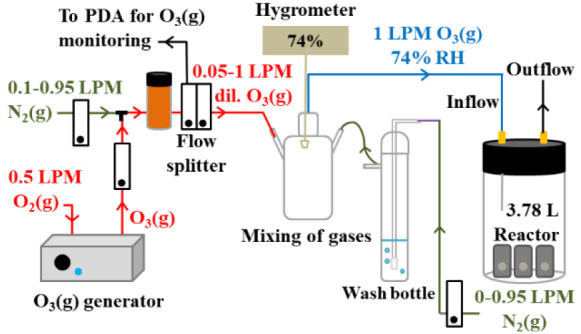
Flow-through oxidation setup for mixing wet and dry gases. Reference flows are provided in units of liters per minute (LPM). PDA = photodiode array (PDA) UV–vis spectrophotometer.
Fourier Transform Infrared Spectroscopy
Infrared crystals with thin films were placed in the 3.78 L reactor (Figure 1) for oxidations and withdrawn at fixed times to record 64 scans with 4 cm–1 resolution by FTIR spectroscopy (Nicolet iN10 with iZ10 FTIR module, Thermo Scientific). Spectra were background-subtracted using the optical material and analyzed with OMNIC (Thermo Scientific).30
Film Extraction and Electrospray Ionization Mass Spectrometry Analysis
Thin films were extracted under sonication (Branson Ultrasonics) for 15 min with 2.0 mL of isopropanol (Fisher Optima, 99.9%). Extracts were diluted twice in isopropanol and then infused into a calibrated electrospray ionization mass spectrometry (ESI-MS) instrument (Thermo Scientific MSQ Plus) by mixing a 50 μL min–1 flow of sample and a 150 μL min–1 flow of degassed ultrapure water (18.2 mΩ cm, ELGA PURELAB flex, Veolia). ESI-MS conditions for analysis in the negative mode were as follows: drying gas temperature, 250 °C; nebulizer voltage, −1.9 kV; cone voltage, −40 V; nebulizer pressure, 70 psi. Reported ESI-MS spectra were recorded for ≥30 s and background-subtracted from the solvent. Controls in the absence of O3(g) demonstrated that the film extracts remained stable during the reaction.
UV–Vis Analysis
A 0.50 mL aliquot of the isopropanol extract was diluted with isopropanol to a final volume of 4.00 mL for direct analysis in a 1.0 cm path length Suprasil cuvette (Starna Cells) using an Evolution 220 spectrophotometer (Thermo Scientific). Isopropanol is a convenient solvent to handle and recover these samples, as it is polar and protic and has a low cutoff wavelength (205 nm) similar to that of water (190 nm), and the shifts of ∼10 nm expected for n → π* (hypsochromic shift) and π → π* (bathochromic shift) transitions due to the use of an alcohol solvent instead of water for UV–vis spectroscopy33 are so small that they can be considered negligible here. The recovery of phenolic aldehydes in the extraction procedure described below was 103.4 ± 4.3% as determined by UV–vis spectroscopy for syringaldehyde using a calibration curve with absorbance at λmax = 310 nm. The effective mass absorption coefficient (MAC) of samples, a measure of SOA browning, was determined from 200 to 700 nm according to eq 1:34
| 1 |
where A10(λ) is the base-10 absorbance directly measured by the spectrophotometer at wavelength λ for a path length b = 1.0 cm and Cmass = 9.375 μg cm–3 is the mass concentration from deposition of 150 μg of Ph(C=O)OH that was extracted in 2.0 mL and diluted 8-fold.
Ion Chromatography Analysis
Isopropanol extracts (2.0 mL) of oxidized films were dried by a gentle flow of N2(g), and reconstituted in 2.0 mL of degassed ultrapure water for anion analysis of carboxylic acids by ion chromatography (IC) (Dionex ICS-2000).35 In a few cases, the dried extracts were reconstituted only in 0.50 mL of degassed ultrapure water to analyze less abundant products of vanillin and 4-hydroxybenzaldehyde oxidation. After injection of 25 μL samples, the products were separated (IonPack AS11-HC, 2 mm × 250 mm column) and identified by IC with conductivity and ESI-MS detection under the same conditions optimized in earlier work.35 Chromeleon and Xcalibur software were used to control the instrument and process the data.
For kinetic analysis of identified products, samples after 0, 0.5, 1, 1.5, 2, 2.5, and 3 h of oxidation were quantified using calibration curves or the method of standard addition. The standards used were sodium formate (Acros, 99.9%), sodium glycolate (Alfa Aesar, 99.1%), sodium oxalate (Alfa Aesar, 99.9%), anhydrous disodium maleate (Fluka, 98.4%), syringic acid (Indofine Chemicals, 99.9%), tartronic acid (Alfa Aesar, 100.3%), disodium l-malate monohydrate (Aldrich, 98%), and potassium sodium tartrate tetrahydrate (Mallinckrodt, 99.9%). In addition, oxalate and syringic acid were spiked into the oxidized film before extraction to determine by IC the recovery of this analytical procedure. The recoveries for the aromatic acid and dicarboxylic acid were 98.5 ± 4.5% and 90.1 ± 0.2%, respectively.
Ultrahigh-Pressure Liquid Chromatography Analysis
The same samples prepared for IC investigation were analyzed by injection of 5 μL into the ultrahigh-pressure liquid chromatography (UHPLC) system equipped with photodiode array (PDA) and MS detectors (Accela 1250 and MSQ Plus system, Thermo Scientific). A reversed-phase C18 column (ZORBAX Eclipse Plus RR HD, 2.1 mm × 100 mm, 1.8 μm) was used at a flow rate of 0.4 mL min–1 with 5.0 mM formic acid in water (solvent A) or acetonitrile (solvent B). The composition was initially kept constant for 2 min at 5% solvent B, then reached 100% solvent B over 10 min, and finally remained constant at 100% solvent B for 4 min. The ESI-MS parameters were as follows: drying gas temperature, 400 °C; nebulizer voltage, −1.9 kV; cone voltage, −40 V; nebulizer pressure, 70 psi.
Results and Discussion
FTIR Monitoring
Figure 2A–C shows the infrared spectra of thin films of the phenolic aldehydes before and after 3 h exposure to 207 ppmv O3(g) (≡5.21 × 10¹⁵ molecules cm–3) at 74% RH. The vibrational modes of syringaldehyde, vanillin, and 4-hydroxybenzaldehyde were assigned previously.29 Upon oxidation there is a drop in the signals for reactant’s peak 1 for O–H, peak 2 for C=O, and peak 3 for C=C and a rise for the product’s peak 4 for O–H, peak 5 for C=O, peak 6 for C=C, and peak 7 for =C–O. Figure 2D displays the relative decay profiles of syringaldehyde (black trace), vanillin (pink trace), and 4-hydroxybenzaldehyde (green trace) during 3 h experiments under the same conditions as for the FTIR spectra. The relative concentrations of the phenolic aldehydes in Figure 2D were determined from the baseline-corrected heights of peak 3 for the C=C aromatic stretching at ∼1606 cm–1 relative to their initial values. The loss of phenolic aldehydes with time (t) in Figure 2D could be fitted with an exponential decay (eq 2):
| 2 |
where A is the pre-exponential constant and kPh(C=O)OH+O3 is the reaction rate constant. Previous work has described in detail how the reaction proceeds through a Langmuir–Hinshelwood mechanism at variable [O3(g)] as well as the effect of RH.29 Furthermore, the reactivity during the initial kinetics (linear region) was demonstrated to be an exclusively surface-dominated process.29 The work below reports for the first time the reaction products from the surface process, which support a series of competitive reaction channels.
Figure 2.
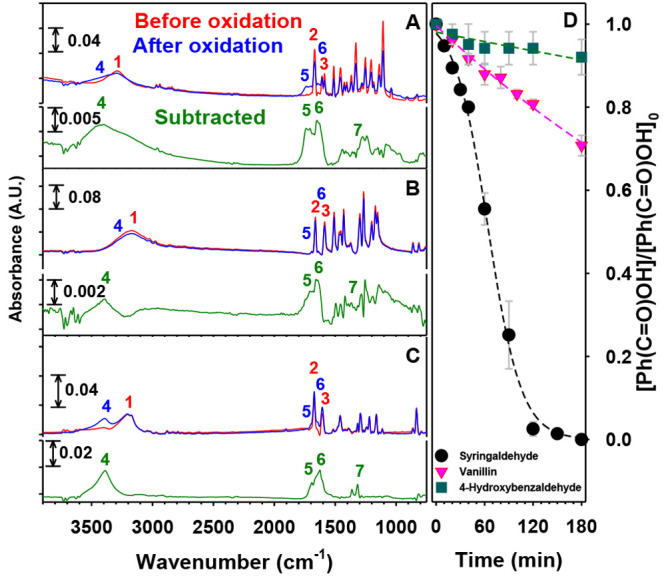
FTIR spectra of thin films of (A) syringaldehyde, (B) vanillin, and (C) 4-hydroxynenzaldehyde (red) before and (blue) after 1 h of oxidation by 207 ppmv O3(g) at 74% RH. The green traces show the subtracted spectra for the three compounds after the remaining precursor was factored out. (D) Decays of phenolic aldehydes relative to their initial concentrations ([Ph(C=O)OH]/[Ph(C=O)OH]0) vs time for 3 h experiments under the conditions for (A–C). Key: black circles, syringaldehyde; pink triangles, vanillin; teal squares, 4-hydroxybenzaldehyde. Dashed lines are provided as guides to the eye only.
Optical Changes upon Oxidation
Figure 3 shows the UV–vis spectra of the isopropanol extracts of phenolic aldehydes before and after exposure to 207 ppmv O3(g) at 74% RH. The large π → π* aldehyde absorption features in Figure 3 for (A) syringaldehyde (λmax = 310 nm),36 (B) vanillin (λmax = 310 nm),37 and (C) 4-hydroxybenzaldehyde (λmax = 285 nm)38,39 correspond to their lowest-energy transitions. The progressive absorption drop of the π → π* transition (e.g., at 310 nm for syringaldehyde and vanillin) during exposure of the film to O3(g) indicates the loss of the aldehyde chromophore directly or indirectly as the hydroxylated aromatic products are finally oxidized to acids.40,41
Figure 3.
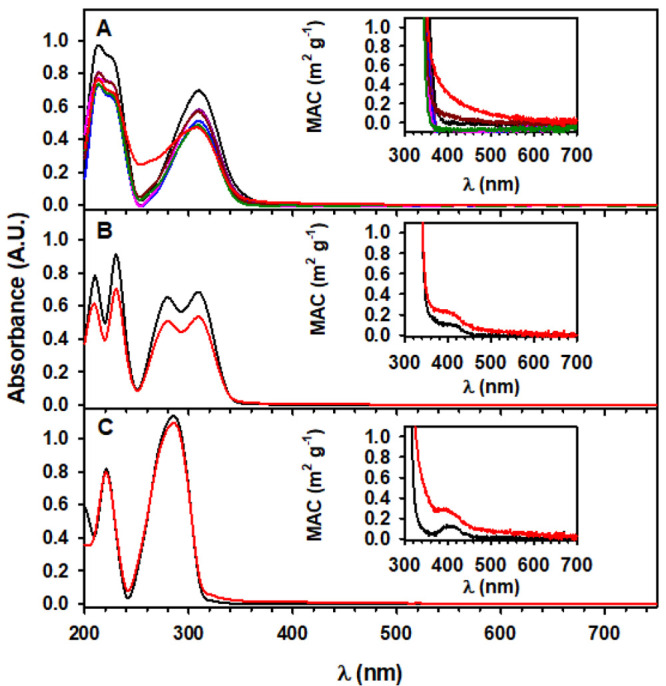
UV–vis spectra of 1:8 dilutions of films extracted in 2.0 mL of isopropanol for (A) syringaldehyde at (black) 0, (dark pink) 10, (blue) 20, (pink) 30, (dark red) 60, (dark green) 120, and (red) 180 min of oxidation and for (B) vanillin and (C) 4-hydroxybenzaldehyde (black) before and (red) after 180 min of oxidation. The oxidation conditions were 1.0 L min–1 of 207 ppmv O3(g) at 74% RH. The insets show the corresponding mass absorption coefficients (MACs) based on eq 1.
In addition to forming ring fragmentation and functionalized products, phenolic compounds can contribute oligomers to the pool of organic matter absorbing in the UV–vis range that are found in atmospheric brown carbon.30,31,42,43 It is clear from the insets in Figure 3 that oxidation causes an increment of the MAC relative to the corresponding starting material. The MAC growth after oxidation indicates the formation of new chromophores within the mixture of products, including oligomers from phenoxy (and semiquinone) radical coupling.30 Similar oligomers could be also formed during photochemical processing.25 For comparison of the data in Figure 3, similar MAC values at 365 nm of (1) 0.17–0.72 m2 g–1 and (2) 0.75–1.13 m2 g–1 were reported over the marine boundary layer of the Indian Ocean affected by continental biomass-burning outflow44 and over a source of biomass burning in the Indo-Gangetic Plain,45 respectively. Thus, the chemistry reported here may generate species found in brown carbon and contribute significantly to the absorption in ambient particles.
Identification of Products
Although the syringaldehyde film in Figure 2 (from transmission FTIR spectroscopy) appears to eventually vanish at prolonged exposure times of O3(g), this is due to the preference of the method to observe the external layers that are lost to chemical reaction. In other words, at a certain oxidation time the amount of syringaldehyde dropped below the minimum amount that is optically detectable by the FTIR method. However, there are still reactant molecules remaining in the film from unreacted deeper syringaldehyde layers, as revealed during ESI-MS and UHPLC-UV-MS analyses. ESI-MS and UHPLC analyses after oxidation of syringaldehyde for 3 h show that a significant amount of syringaldehyde is left unreacted. Indeed, this observation further confirms that the initial reaction proceeds only on the surface of the film, which is transformed into a layer of products with a larger O:C ratio that prevents oxidation of deeper layers by the burial effect.46,47
ESI-MS Analysis
Figure 4 shows the ESI-MS spectra of isopropanol-extracted phenolic aldehyde films before and after exposure to 207 ppmv O3(g) at 74% RH. The syringaldehyde film before exposure to O3(g) (red trace in Figure 4A) shows only a peak at m/z 181 corresponding to the anion of syringaldehyde (MW 182.17 g mol–1), which by collision-induced dissociation (loss of −CH3) forms a fragment at m/z 167.28,48 The oxidized syringaldehyde film (blue trace in Figure 4A) shows both heavier and lighter ions than the reagent. Species with larger m/z values should result from the generation of oxygenated compounds, while smaller ones reflect secondary fragmentation of oxygenated products.28 Many oxidation products in Figure 4A match previous observations from microsecond contact time experiments49 at the air–water interface.28 Importantly, the product peaks reported in Figure 4A are confirmed also to be present during the analysis of extracted films for the initial kinetics that were oxidized for only 20 and 60 min.
Figure 4.
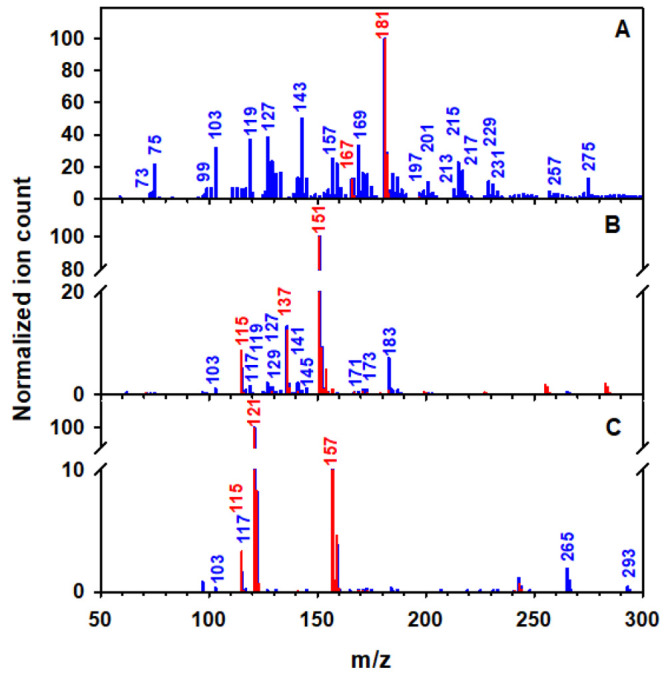
ESI-MS spectra of isopropanol-extracted films made of (A) syringaldehyde, (B) vanillin, and (C) 4-hydroxybenzaldehyde (red) before and (blue) after 3 h of oxidation with a 1 L min–1 flow of 207 ppmv O3(g) at 74% RH. The films were extracted with isopropanol and diluted with ELGA water in a 1:4 ratio during infusion.
Hydroxylation products explained by in situ-generated HO• registered in Figure 4A include 2-hydroxysyringaldehyde (m/z 197), 2,6-dihydroxysyringaldehyde (m/z 213), 2,6-dihydroxysyringic acid (m/z 229), syringic acid (m/z 197), and 2-hydroxysyringic acid (m/z 213).28 In addition, HO• is also responsible for a demethoxylation channel that produces 5-hydroxyvanillin (m/z 167, a signal confirmed to grow relative to the initial value), gallaldehyde (m/z 153), 1,2,3,4-tetrahydroxybenzaldehyde or 2,6-dimethoxybenzene-1,4-diol (m/z 169), and pentahydroxybenzaldehyde (m/z 185). The formation of pentahydroxybenzoic acid (m/z 201) can only be explained by the combined hydroxylation and demethoxylation effect of HO• as well as its final attack to convert −C(H)=O to −COOH.
Candidate primary ring fragmentation products in Figure 4A are 4-formyl-2-methoxymuconic acid methyl ester (m/z 213), 3-carboxy-5-methoxymuconic acid monomethyl ester (m/z 229), 4-formyl-2,3,5-trihydroxymuconic acid methyl ester (m/z 231), 2-carboxy-5-hydroxy-2-methoxymuconic acid methyl ester (m/z 245), and 2-carboxy-4,5-dihydroxy-2-methoxymuconic acid methyl ester (m/z 261).28 Further secondary oxidation generates glyoxylic acid (m/z 73), glycolic acid (m/z 75), (Z)-4-oxobut-2-enoic acid (m/z 99), oxalic acid methyl ester (m/z 103), maleic acid (m/z 115), mesoxalic acid (m/z 117), tartronic acid (m/z 119), maleic acid monomethyl ester (m/z 129), (E)-4-oxopent-2-enedioic acid (m/z 143), 2-methoxyfumaric acid (m/z 145), 2-hydroxymuconic acid (m/z 157), and 2,5-dihydroxymuconic acid (m/z 173).28,30 Heavier ions from dimeric compounds can undergo ozonolysis followed by cyclization to produce 4,6-dihydroxy-3-(2-methoxy-2-oxoacetyl)-2-oxo-2H-pyran-5-carboxylic acid (m/z 257) and (Z)-2,4-dihydroxy-5-methoxy-5-oxopenta-1,3-diene-1,1,3-tricarboxylic acid (m/z 275).
The ESI-MS spectrum of vanillin before exposure to ozone (red trace in Figure 4B) shows three peaks, which correspond to vanillin (m/z 151), the fragment from loss of −CH3 (m/z 137), and a trace amount of maleic acid (m/z 115) generated from sample processing.28,50 While maleic acid with a concentration of 0.90 μM was confirmed by IC as a real background species from sample processing, the total reactant conversion represented <2‰. Instead, no species at m/z 137 was detected by IC before oxidation, confirming its assignment to a fragment. Oxidation of vanillin thin films (blue trace in Figure 4B) shows more ring cleavage than functionalization products, as observed before at the air–water interface.28 Candidate products for these ESI-MS peaks were confirmed as separate chromatographic peaks by UHPLC-UV-MS and/or IC-conductivity-MS analyses, indicating that they are real chemical species and not ionization artifacts.
The primary ozonolysis product in Figure 4B was 4-formylmuconic acid methyl ester (m/z 183).28 The species at m/z 141 is assigned to benzenetetrol; this could be generated from ipso addition of HO• to 3,4-dihydroxybenzaldehyde (m/z 137, larger signal than before oxidation), which substitutes the −C(H)=O group by −OH in the aromatic ring, followed or preceded by an additional ring hydroxylation.41 Another product generated by ipso attack is methoxybenzenetetrol at m/z 171. The molecule (2E,4E)-2,4-dihydroxyhexa-2,4-dienedioic acid at m/z 173 can be produced from ozonolysis of benzene-1,2,3,5-tetraol (m/z 141). The assignment of peaks for carboxylic acids includes oxalic acid methyl ester (m/z 103), maleic acid (m/z 115), mesoxalic acid (m/z 117), tartronic acid (m/z 119), (E)-4,5-dioxopent-2-enoic acid (m/z 127), maleic acid monomethyl ester (m/z 129), and 2-methoxyfumaric acid (m/z 145) (Figure 4B).
For ESI-MS analysis of 4-hydroxybenzaldehyde before oxidation (red trace in Figure 4C), there is a reactant anion at m/z 121, a small amount of background maleic acid (m/z 115) from sample processing, and an adduct of 4-hydroxybenzaldehyde anion with two water molecules (m/z 157), as typically observed with other phenols such as substituted catechols.51 It must be noted that quality control injections of the reactant by two different methods (UHPLC with a reversed-phase C18 column and IC for anions) showed that the extracted ion peak at m/z 121 appears alone in the required chromatograms, confirming its high purity. Instead, when the extracted sample before oxidation was analyzed by IC, it displayed a separate peak with [maleic acid] = 0.48 μM, representing <0.8‰ reactant conversion. After oxidation of 4-hydroxybenzaldehyde (blue trace in Figure 4C), a few peaks of products (new or that grow) with small ion counts were detected, which were also examined by UHPLC-UV-MS and IC-conductivity-MS analyses. The new species at m/z 137 is 3,4-dihydroxybenzaldehyde or 4-hydroxybenzoic acid.28 Ozonolysis generates 2-hydroxy-3-oxopropanoic acid (m/z 103) and mesoxalic acid (m/z 117). The heavier ions in the MS spectrum are assigned to dimeric compounds such as [1,1′-biphenyl]-2,2′,3,3′,4,5,5′-heptaol (m/z 265) and 2′,3′,4,4′,5,6,6′-heptahydroxy-[1,1′-biphenyl]-2-carbaldehyde (m/z 293) requiring one previous HO• ipso attack at the aromatic position holding the aldehyde group.
UHPLC-UV-MS Analysis
Figure 5 shows the UHPLC-UV-MS chromatograms of (A) syringaldehyde, (B) vanillin, and (C) 4-hydroxybenzaldehyde before (gray trace) and after 3 h of oxidation (brown trace) with 207 ppm O3(g) at 74% RH. Based on UHPLC-UV analyses for all three molecules, the conversions of syringaldehyde, vanillin, and 4-hydroxybenzaldehyde after 3 h of oxidation are 76.1%, 13.0%, and 16.6%, respectively. Table 1 lists the peaks labeled in Figure 5 with the corresponding retention times, anion m/z values, and structure names. For syringaldehyde oxidation (Figure 5A), peak 1 is confirmed as maleic acid monomethyl ester, which forms an ion with m/z 129 matched with a standard at the same retention time. The UV–vis spectrum of peak 1 with a shoulder at λmax = 245 nm is presented in the inset of Figure 5A. Based on the absorption at λmax = 284 nm (inset of Figure 5A), peak 2 must retain an aliphatic carbonyl originally in syringaldehyde after the ring of a demethoxylated pentahydroxybenzaldehyde product (m/z 185) is broken to form (2Z,4Z)-3-formyl-2,4,5-trihydroxyhexa-2,4-dienedioic acid at m/z 217.41 Peak 3 is assigned to 5-hydroxyvanillin (from demethoxylation of syringaldehyde) and displays a carbonyl absorption with λmax = 294 nm (Figure 5A inset) and m/z 167.28,48 Peak 4 with m/z 305 appears to have a carbonyl absorption (λmax = 288 nm), possibly indicating a ring-functionalized phenol assigned as (Z)-5-formyl-2-(4-hydroxy-3,5-dimethoxyphenyl)-6-oxohexa-2,4-dienoic acid. Peak 5 with m/z 197 has the same retention time and UV–vis spectrum (λmax = 283 nm) of syringic acid, which elutes earlier than peak 6 for syringaldehdye (m/z 181 and λmax = 307 nm). A time series for the areas under peaks 1–6 during syringaldehyde oxidation at 0, 10, 20, 30, 60, 120, and 180 min is displayed in Figure S1.
Figure 5.
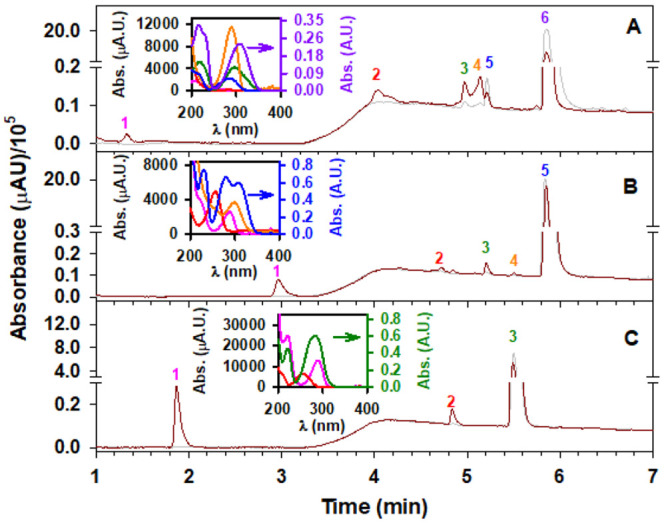
UHPLC with UV–vis detection at λ = 210 nm for extracted films of (A) syringaldehyde, (B) vanillin, and (C) 4-hydroxybenzaldehyde (gray) before and (brown) after 3 h of exposure to 207 ppmv O3(g) at 74% RH. Films extracted in isopropanol were dried and reconstituted in water before injection. Peaks labeled in each panel are listed in Table 1. The insets show the absorbance (Abs.) of each peak vs wavelength (λ) with colors matching the peak numbers in the corresponding panels.
Table 1. List of Chromatographic Peaks in UHPLC Analysis of Figure 5 with Peak Number, Retention Time (R.T.), Anion Mass-to-Charge Ratio (m/z), and Name.
| panel | peak no. | R.T. (min) | m/z | name |
|---|---|---|---|---|
| A | 1 | 1.34 | 129 | maleic acid monomethyl ester |
| 2 | 4.05 | 217 | (2Z,4Z)-3-formyl-2,4,5-trihydroxyhexa-2,4-dienedioic acid | |
| 3 | 4.99 | 167 | 5-hydroxyvanillin | |
| 4 | 5.15 | 305 | (Z)-5-formyl-2-(4-hydroxy-3,5-dimethoxyphenyl)-6-oxohexa-2,4-dienoic acid | |
| 5 | 5.21 | 197 | syringic acid | |
| 6 | 5.86 | 181 | syringaldehyde | |
| B | 1 | 2.82 | 171 | 1,2,3,4-tetrahydroxy-5-methoxybenzene |
| 2 | 4.68 | 137 | 4-methoxycyclohexa-3,5-diene-1,2-dione | |
| 3 | 5.06 | 167 | vanillic acid | |
| 4 | 5.37 | 277 | 5,5′-dimethoxy-[1,1′-biphenyl]-2,2′,4,4′-tetraol | |
| 5 | 5.71 | 151 | vanillin | |
| C | 1 | 1.87 | 109 | hydroquinone |
| 2 | 4.84 | 137 | 4-hydroxybenzoic acid | |
| 3 | 5.45 | 121 | 4-hydroxybenzaldehyde |
The analysis of the time series in Figure S1 allows qualitative conclusions to be drawn. First, as stated above, a fraction of the syringaldehyde from buried layers (peak 6) remained unreacted and leveled off after 1 h of the reaction. The fitted first-order decay of syringaldehyde with time, [SA]/[SA]0 = 0.292 + 0.701e–(1.10×10⁻¹ min–1)t with a coefficient of determination R2 = 0.976, confirms that this remaining reagent fraction is 29.2% as t → ∞. Two strongly absorbing species, (Z)-5-formyl-2-(4-hydroxy-3,5-dimethoxyphenyl)-6-oxohexa-2,4-dienoic acid (peak 4) and (2Z,4Z)-3-formyl-2,4,5-trihydroxyhexa-2,4-dienedioic acid (peak 2), dominate the area of products with an exponential growth dependence on time: Areapeak4 = (9.99 × 10³)e(1.37×10⁻² min–1)t with R2 = 0.979 and Areapeak2 = (2.28 × 10³)e(0.0213 min–1)t with R2 = 0.998. While the formation of both products involves ring cleavage of the aromatic ring of previously hydroxylated molecules, a uniqueness of peak 4 is that it also requires a coupling reaction with the participation of semiquinone radicals. Interesting is the case of 5-hydroxyvanillin (peak 3), obtained from the preferred hydroxylation of the aromatic ring of syringaldehyde, which is described well by an exponential growth to maximum relationship, Areapeak3 = (3.79 × 10⁴)[1 – e–(8.53×10⁻³ min–1)t] with R2 = 0.950, which at 2 h reaches a quasi-steady state. The competing and far less intense signal for the hydroxylation of the carbonyl group of syringaldehyde to produce syringic acid (peak 5) also follows an exponential growth function, Areapeak3= (2.67 × 10⁴)[1 – e–(3.32×10⁻³ min–1)t] with R2 = 0.948, and reaches its maximum early in the oxidation to remain in the steady state. Finally, the growth of maleic acid monomethyl ester (peak 1), as a multigeneration ozonolysis product, remains the smallest one determined. This could be the case because the species is not formed once favorable demethoxylation reactions takes place.
The chromatogram of vanillin oxidation (brown trace in Figure 5B) shows five new peaks (1–5) in addition to vanillin (peak 6) that are separated by UHPLC. The absorption spectrum of peak 1 (m/z 171) with λmax = 288 nm (inset of Figure 5B) and a shape that resembles the spectrum of p-hydroquinone suggest the formation of a methoxybenzenetetrol from ipso attack of HO• at the aromatic carbon holding the formyl substituent.41 Peak 2 (m/z 137) has λmax at 255 and 365 nm, but the absorption extends up to 400 nm (inset of Figure 5B); the shape is close to that of p-benzoquinone, as described by the structure of 4-methoxycyclohexa-3,5-diene-1,2-dione (MW = 138.12 g mol–1), which implies a hydroxyl-radical-promoted decarbonylation. Peak 3 is confirmed to be vanillic acid by its ion at m/z 167 and matching absorption spectrum with λmax at 261 and 292 nm. Peak 4 displays an ion at m/z 277 and a broad absorption at λmax = 299 nm, which can be described by 5,5′-dimethoxy-[1,1′-biphenyl]-2,2′,4,4′-tetraol formed as a dimer of 2,4-dihydroxy-1-methoxybenzene.
Figure 5C displays the chromatograms for the extracted film of 4-hydroxybenzaldehyde before and after oxidation. There are two new peaks labeled as 1 and 2 in the chromatogram, while peak 3 corresponds to 4-hydroxybenzaldehyde. Peak 1 (m/z 109 and λmax = 290 nm) has an absorption spectrum and retention time matching those of p-hydroquinone, indicative of substitution of the aldehyde group by HO• ipso attack.41 Peak 2 (m/z 137 and λmax = 255 nm) was identified as 4-hydroxybenzoic acid, which is formed by oxidation of the aldehyde to an acid.28,41
IC-MS Analysis
Figure 6 shows the IC-MS analysis for experiments with (A) syringaldehyde, (B) vanillin, and (C) 4-hydroxybenzaldehyde before (black traces) and after (red traces) 3 h exposure to 207 ppmv O3(g) at 74% RH. Peaks labeled for each molecule in its respective panel of Figure 6 are listed in Table 2. In the case of syringaldehyde, 11 new peaks appear after oxidation. Based on the retention time in the conductivity detector and/or detected m/z values obtained by MS, we identify the following species in Figure 6A: maleic acid monomethyl ester (peak 1, m/z 129 with a large fragment at m/z 73), glycolic acid (peak 2, m/z 75), formic acid (peak 3, m/z 45), (E)-4-oxopent-2-enedioic acid (peak 4, m/z 143), tartronic acid (peak 5, m/z 119), oxalic acid (peak 6, m/z 89), 2-hydroxysyringic acid (peak 7, m/z 213), syringic acid (peak 8, m/z 181), 1,2,3,4-tetrahydroxybenzoic acid (peak 9, m/z 185), 4-carboxy-2,3,5-trihydroxymuconic acid (peak 10, m/z 233), and 2,3,5-trihydroxymuconic acid (peak 11, m/z 189). The analysis of Figure 6B for vanillin shows 10 new peaks after oxidation: maleic acid monomethyl ester (peak 1, m/z 129), glycolic acid (peak 2, m/z 75), formic acid (peak 3, m/z 45), tartronic acid (peak 4, m/z 119), 2-methoxyfumaric acid (peak 5, m/z 145), oxalic acid (peak 6, m/z 89), maleic acid (peak 7, m/z 115), vanillic acid (peak 8, m/z 167), 1,2-dihydroxyethane-1,1,2-tricarboxylic acid (peak 9, m/z 193), and hydroxyvanillic acid (peak 10, m/z 183). Peak 9 has m/z 193 and a fragment at m/z 177, which is 16 Da smaller from −OH loss, and another fragment from decarboxylation at m/z 149, which is 44 Da smaller than 193 from CO2 loss. The proposed species to describe peak 9 in Table 2 can be formed from the recombination of glycolic acid radical and tartronic acid radical or two glycolic acid radicals and a formyl–oxyl radical.
Figure 6.
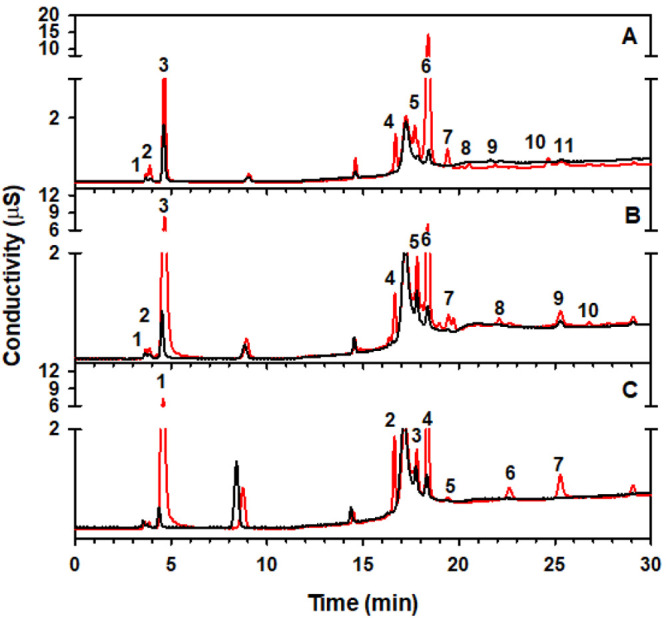
Ion chromatographs with conductivity detection of extracted films of (A) syringaldehyde, (B) vanillin, and (C) 4-hydroxybenzaldehyde (black) before and (red) after 3 h exposure to 207 ppmv O3(g) at 74% RH. Films extracted in isopropanol were dried and reconstituted in water before injection. Peaks labeled in each panel are correspondingly listed in Table 2.
Table 2. Chromatographic Peaks in IC-Conductivity-MS Analysis for Figure 6 with Peak Number, Retention Time (R.T.), Anion Mass-to-Charge Ratio (m/z), and Name.
| panel | peak no. | R.T. (min) | m/z | name |
|---|---|---|---|---|
| A | 1 | 3.69 | 129 | maleic acid monomethyl ester |
| 2 | 3.88 | 75 | glycolic acid | |
| 3 | 4.66 | 45 | formic acid | |
| 4 | 16.66 | 119 | tartronic acid | |
| 5 | 17.85 | 143 | (E)-4-oxopent-2-enedioic acid | |
| 6 | 18.38 | 89 | oxalic acid | |
| 7 | 19.40 | 213 | hydroxysyringic acid | |
| 8 | 21.77 | 197 | syringic acid | |
| 9 | 22.28 | 185 | 1,2,3,4-tetrahydroxybenzoic acid | |
| 10 | 24.64 | 233 | 4-carboxy-2,3,5-trihydroxymuconic acid | |
| 11 | 25.38 | 189 | 2,3,5-trihydroxymuconic acid | |
| B | 1 | 3.69 | 129 | maleic acid monomethyl ester |
| 2 | 3.88 | 75 | glycolic acid | |
| 3 | 4.66 | 45 | formic acid | |
| 4 | 16.66 | 119 | tartronic acid | |
| 5 | 17.81 | 145 | 2-methoxyfumaric acid | |
| 6 | 18.38 | 89 | oxalic acid | |
| 7 | 19.46 | 115 | maleic acid | |
| 8 | 22.09 | 167 | vanillic acid | |
| 9 | 25.29 | 193 | 1,2-dihydroxyethane-1,1,2-tricarboxylic acid | |
| 10 | 26.78 | 183 | hydroxyvanillic acid | |
| C | 1 | 4.66 | 45 | formic acid |
| 2 | 16.66 | 119 | tartronic acid | |
| 3 | 17.81 | 145 | 2-methoxyfumaric acid | |
| 4 | 18.38 | 89 | oxalic acid | |
| 5 | 19.46 | 115 | maleic acid | |
| 6 | 22.62 | 137 | 4-hydroxybenzoic acid | |
| 7 | 25.29 | 193 | 1,2-dihydroxyethane-1,1,2-tricarboxylic acid |
The generation of multiple carboxylic acids observed by IC during the oxidation of the phenolic aldehydes serves to explain field observations, where species with −COOH groups dominate the matrix of organic compounds.9,10 The production of syringic acid, vanillic acid, and 4-hydroxybenzoic acid (Figure 6), species reported in atmospheric particulates, reveals that oxidative mechanisms provide them in large amounts to atmospheric particulate matter (PM2.5), where biomass burning is prevalent.52 These aromatic acids may partition into the aqueous phase of aerosols to continue aging and produce oligomeric compounds.53 The quantification of the most abundant carboxylic acid products from aromatic ring cleavage during the oxidation of a syrigaldehyde film exposed to 207 ppmv O3(g) at 74% RH is provided in Figure 7. The data points for oxalic acid, maleic acid, formic acid, and glycolic acid were fitted well (R2 ≥ 0.977) with a two-parameter exponential rise to a maximum (eq 9 with parameters in Table 3):
| 9 |
where [product]∞ is a constant that represents the asymptotic upper limit that would be reached as t → ∞ and kf is the formation rate constant.
Figure 7.
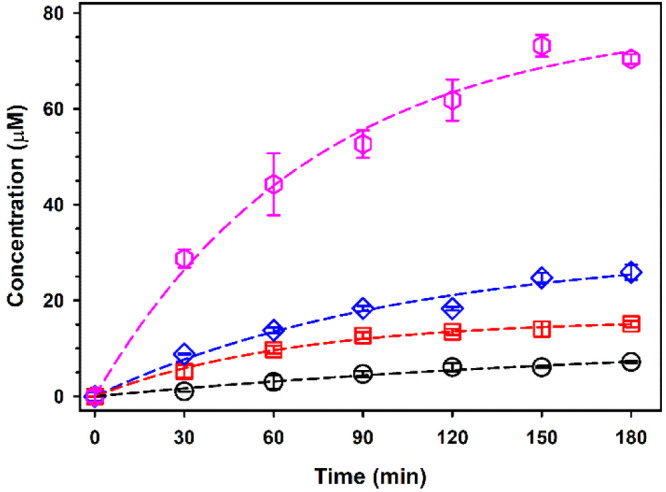
IC-monitoring-produced time series of oxalic acid (pink hexagons), maleic acid (blue diamonds), formic acid (red squares), and glycolic acid (black circles) during the oxidation of syringaldehyde with 207 ppmv O3(g) at 74% RH. Films extracted in isopropanol were dried and reconstituted in water before injection. Dashed lines show the fits to eq 9 with the parameters reported in Table 3.
Table 3. Exponential Growth Parameters from Equation 9 for Products in Figure 7.
| product | [Product]∞ (μM) | kf (min–1) | R2 |
|---|---|---|---|
| oxalic acid | 78.9 | 0.0136 | 0.990 |
| maleic acid | 31.0 | 0.00955 | 0.978 |
| formic acid | 16.1 | 0.0152 | 0.994 |
| glycolic acid | 12.7 | 0.00469 | 0.977 |
The large production of oxalic acid (Figure 7) is interpreted as the oxidative end point product from the secondary ozonolysis of unsaturated carboxylic acids such as maleic acid,30,54 as expected for atmospheric aerosols.55 In addition, the carboxylic acids can also be converted into HCOOH(g), CO2(g), CO(g), and H2O(g) and escape to the gas phase.54,56−59 A previous reaction mechanism was provided to show the conversion of glyoxylic acid into oxalic acid during the heterogeneous oxidation of catechol (see Scheme 2 of ref (51)). In addition, we have shown how the photooxidation of glyoxylic acid with the participation of glycolic acid radicals results in the generation of oxalic acid (see Scheme 2 of ref (60)).
Proposed Reaction Pathways Based on Identified Products
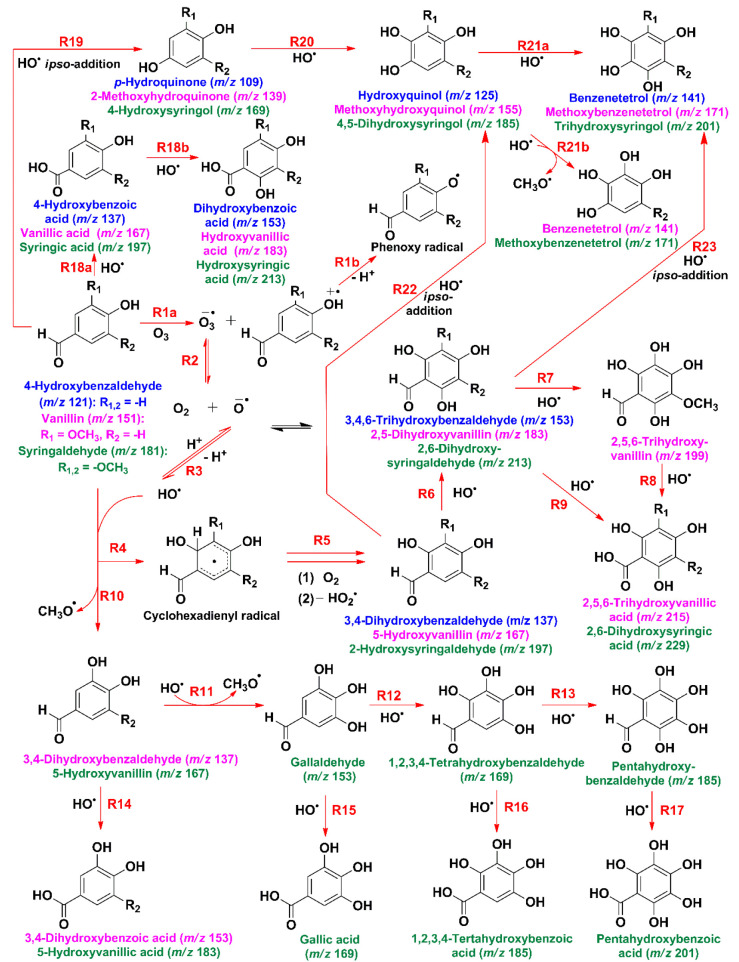
Based on the results presented above and previous work on the oxidation of phenolic aldehydes by O3(g) and HO• at the air–water interface, three competing reaction mechanisms are proposed: (1) ring functionalization, (2) oligomerization, and (3) ring cleavage.28,30,51,61Scheme 1 combines the ring functionalization and oligomerization pathways, where phenolic aldehydes first undergo electron transfer with O3(g) by reaction R1a, resulting in ozonide radical anion (O3–•) and phenol radical cation.51,61,62 The production of HO• from O3–• is explained through reactions R2 and R3.28 Ring functionalization by HO• through reactions R4–R8 creates the same polyhydroxymethoxyphenols observed previously at air–water interface oxidation.28 The products from the previous sequence of reactions are 3,4-dihydroxybenzaldehyde (m/z 137), 5-hydroxyvanillin (m/z 167), 2-hydroxysyringaldehyde (m/z 197), 2,5-dihydroxyvanillin (m/z 183), 2,6-dihydroxysyringaldehyde (m/z 213), 2,5,6-trihydroxyvanillin (m/z 199), 2,5,6-trihydroxyvanillic acid (m/z 215), and 2,6-dihydroxysyringic acid (m/z 229).28
Scheme 1. Proposed Oxidation Mechanism of Syringaldehyde (Green), Vanillin (Pink), and 4-Hydroxybenzaldehyde (Blue) by O3 and HO• (Color-Coded m/z Values Correspond to Monoanions).
Phenolic aldehydes can also undergo HO•-initiated demethoxylation to form the corresponding hydroxylated products by reactions R10 through R13 in Scheme 1.28 This channel generates 3,4-dihydroxybenzaldehyde (m/z 137), 5-hydroxyvanillin (m/z 167), gallaldehyde (m/z 153), 1,2,3,4-tetrahydroxybenzaldehyde (m/z 169), and pentahydroxybenzaldehyde (m/z 185).28 Further oxidation at the aldehyde carbon position through reactions R14 through R17 produces 3,4-dihydroxybenzoic acid (m/z 153), hydroxyvanillic acid (m/z 183), gallic acid (m/z 169), 1,2,3,4-tetrahydroxybenzoic acid (m/z 185), and 1,2,3,4,5-pentahydroxybenzoic acid (m/z 201).28 Reaction R18a shows the direct oxidation of the −C(H)=O group of the phenolic aldehydes to produce 4-hydroxybenzoic acid, (m/z 137), vanillic acid (m/z 167), and syringic acid (m/z 197).28 The sequential hydroxylation of the resulting ipso products is used in reaction R18b to exemplify the power of the carboxylic acids to trap HO• into dihydroxybenzoic acid (m/z 153), hydroxyvanillic acid (m/z 183), and hydroxysyringic acid (m/z 213). Reaction R19 in Scheme 1 represent the HO• ipso addition to carbon 1 in the ring to substitute the −C(H)=O group of the reagents and produce p-hydroquinone (m/z 109), 2-methoxyhydroquinone (m/z 139), and 4-hydroxysyringol (m/z 169).28,41 Hydroxylation of the three previous species by reaction R20 can generate hydroxyquinol (m/z 125), methoxyhydroxyquinol (m/z 155), and 4,5-dihydroxysyringol (m/z 185). As an example of a commonality of products from the competition between hydroxylation (reaction 21a) and demethoxylation (reaction R21b), the following products can be formed: benzenetetrol (m/z 141), methoxybenzenetetrol (m/z 171), and trihydroxysyringol (m/z 201).28,41 Reactions R22 and R23 explain the HO• ipso attack to the respective primary- and secondary-functionalized products, resulting in the same species listed before for reactions R20 and R21a. Finally, the produced phenoxy radical (and semiquinone radical from the products) formed either from the dissociation of phenolic aldehyde radical cation (reaction R1b) or from HO• abstraction of hydroxyl H atoms of any of the multigeneration phenols can participate in coupling reactions. These coupling reactions contributing species with brown carbon absorption30 are discussed later.
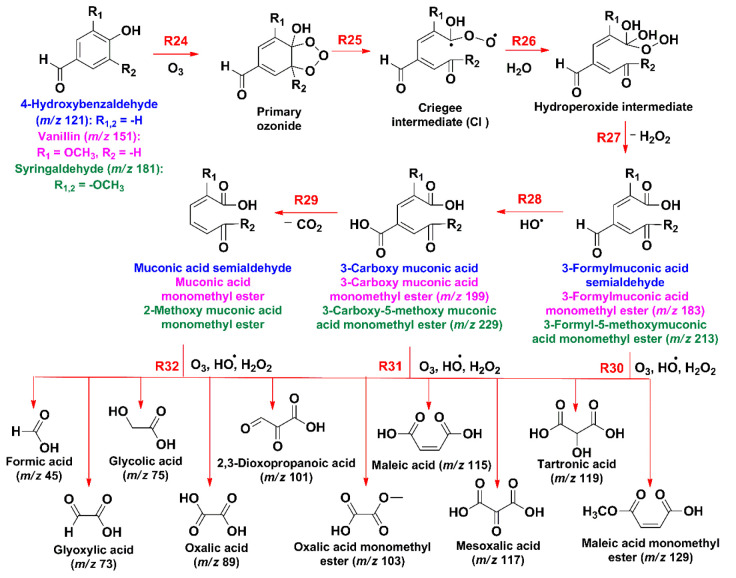
Scheme 2 displays the channels initiated by electrophilic attack of ozone to the aromatic ring, which forms the primary ozonide of the phenolic aldehyde by reaction R24. The ozonide decomposes into the Criegee intermediate (CI) by reaction R25.63,64 Water molecules drive the conversion of the CI to the hydroperoxide intermediate (reaction R26), which fragments to release H2O2 by reaction R27, giving the first-generation ozonolysis products, 3-formylmuconic acid semialdehyde (MW = 154.12; the ion at m/z 153 eluded detection), 3-formylmuconic acid monomethyl ester (m/z 183), and 3-formyl-5-methoxymuconic acid monomethyl ester (m/z 213).28,64 Similarly (but not shown in Scheme 2), ozonolysis of the first-generation hydroxylated products from reaction R18a in Scheme 1, previously described at the air–water interface, produces 3-carboxymuconic acid (MW = 170.12; the ion at m/z 169 was undetected in this work), 3-carboxymuconic acid monomethyl ester (m/z 199), and 3-carboxy-5-methoxymuconic acid monomethyl ester (m/z 229).28,64 Alternatively, the last three unstable olefinic carboxylic acids can be produced by direct HO• attack of the aldehyde by reaction R28 in Scheme 2. Theoretically, the decarboxylation of the last species by reaction R29 would yield muconic acid semialdehyde (MW = 126.11), muconic acid monomethyl ester (MW = 156.14), and 2-methoxymuconic acid monomethyl ester (MW = 186.16).28,64 Further synergistic oxidations by O3, HO•, and H2O2 (reactions R30, R31, and R32 in Scheme 2) generate species such as formic acid (m/z 45) glyoxylic acid (m/z 73), glycolic acid (m/z 75), oxalic acid (m/z 89), 2,3-dioxopropanoic acid (m/z 101), oxalic acid monomethyl ester (m/z 103), maleic acid (m/z 115), mesoxalic acid (m/z 117), tartronic acid (m/z 119), and maleic acid monomethyl ester (m/z 129).30,51
Scheme 2. Proposed Direct Ozonolysis Mechanism of Syringaldehyde (Green), Vanillin (Pink), and 4-Hydroxybenzaldehyde (Blue) (Reported m/z Values Are for Monoanions Detected).
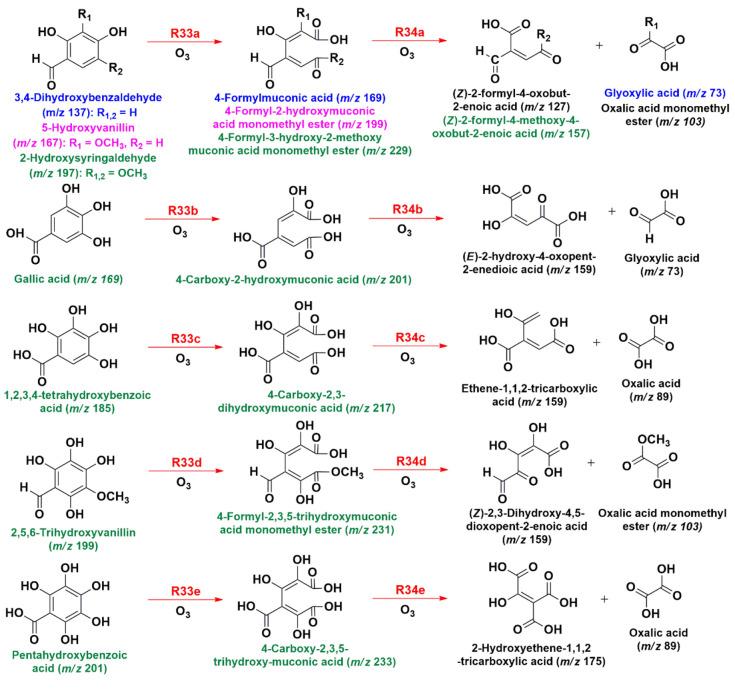
Additionally, the hydroxylated products from Scheme 1 are more prone to undergo ring fragmentation in the presence of O3(g) than the parent phenolic aldehydes.28 Thus, Scheme 3 shows examples of the ozonolysis-driven ring cleavage of selected hydroxylated products by reactions R33, which form C7 mono- and dicarboxylic acids similar to those reported at the air–water interface.28 Examples of the detected species from reactions R33 (Scheme 3) are 4-formylmuconic acid (m/z 169), 4-formyl-2-hydroxymuconic acid monomethyl ester (m/z 199), 4-formyl-3-hydroxy-2-methoxymuconic acid monomethyl ester (m/z 229), 4-carboxy-2-hydroxymuconic acid (m/z 201), 4-carboxy-2,3-dihydroxymuconic acid (m/z 217), 4-formyl-2,3,5-trihydroxymuconic acid monomethyl ester (m/z 231), and 4-carboxy-2,3,5-trihydroxymuconic acid (m/z 233).28
Scheme 3. Proposed Direct Ozonolysis Mechanism for Hydroxylated Products from Scheme 1 (Reported m/z Values Are for Monoanions Detected).
Further ozonolysis breakdown of these C7 carboxylic acids by reactions R34 (Scheme 2) produces C5 and C2 carboxylic acids registered by MS (Figure 4), such as (Z)-2-formyl-4-oxobut-2-enoic acid (m/z 127), (Z)-2-formyl-4-methoxy-4-oxobut-2-enoic acid (m/z 157), (E)-2-hydroxy-4-oxopent-2-enedioic acid (m/z 159), ethene-1,1,2-tricarboxylic acid (m/z 159), (Z)-2,3-dihydroxy-4,5-dioxopent-2-enoic acid (m/z 159), 2-hydroxyethene-1,1,2-tricarboxylic acid (m/z 175), glyoxylic acid (m/z 73), oxalic acid (m/z 89), and oxalic acid monomethyl ester (m/z 103).28 The action of oxidizers (O3, HO•, and H2O2) on the C7 and C5 carboxylic acids generated by the mechanism in Scheme 3 continues to produce the same low-molecular-weight multifunctional carboxylic acids described by reactions R30–R32 in Scheme 2.28
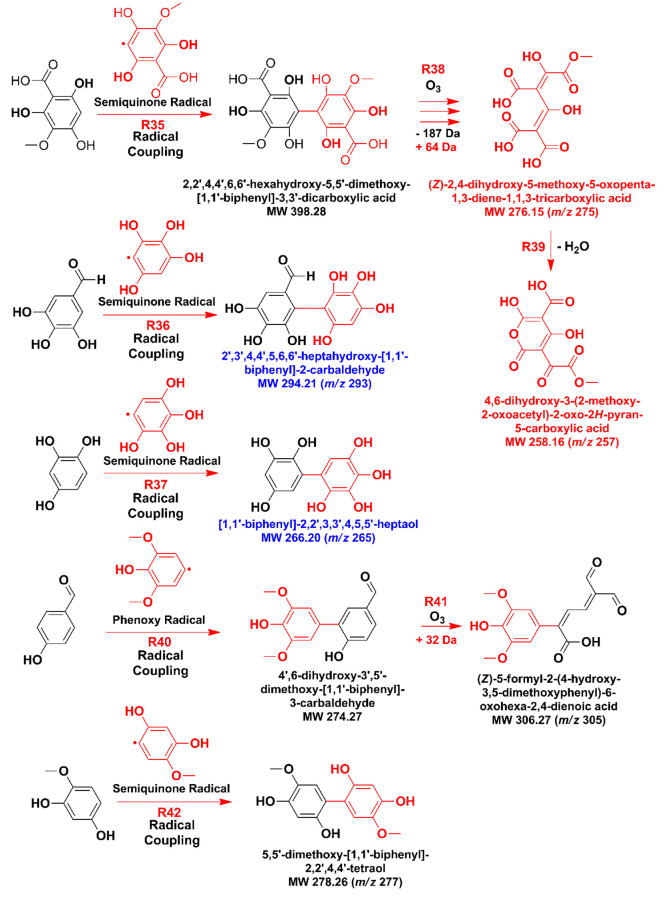
Given the availability of phenoxy and semiquinone radicals from reactant and product molecules by electron transfer and proton transfer reactions (e.g., analogous to reactions R1 and R22 in Scheme 1) and by HO•-driven H atom abstraction of the phenolic groups, heavy oligomers can be produced in this system. For instance, coupling reactions of semiquinone radicals (reactions R35, R36, and R37 in Scheme 4) from molecules that may have undergone HO• ipso attack and/or demethoxylation, followed by ring cleavage by O3 (reaction R38) and even cyclization into lactones (reaction R39), are required to explain heavier masses detected by mass spectrometry (Figure 4). For example, the following molecules (or isomers) are tentatively proposed in Scheme 4: 4,6-dihydroxy-3-(2-methoxy-2-oxoacetyl)-2-oxo-2H-pyran-5-carboxylic acid (m/z 257), (Z)-2,4-dihydroxy-5-methoxy-5-oxopenta-1,3-diene-1,1,3-tricarboxylic acid (m/z 275), [1,1′-biphenyl]-2,2′,3,3′,4,5,5′-heptaol (m/z 265), and 2′,3′,4,4′,5,6,6′-heptahydroxy-[1,1′-biphenyl]-2-carbaldehyde (m/z 293).
Scheme 4. Proposed Dimer Production by Radical Coupling of Semiquinone Radicals from Hydroxylated Products in Scheme 1 and Cyclization Reactions (Reported m/z Values Are for Monoanions Detected).
Furthermore, two dimers separated by UHPLC are confirmed to absorb sunlight based on the registered UV–vis spectrum. The proposed structures for these dimers from oxidation are (Z)-5-formyl-2-(4-hydroxy-3,5-dimethoxyphenyl)-6-oxohexa-2,4-dienoic acid (m/z 305) formed by reactions R40 and R41 (Scheme 4) and 5,5′-dimethoxy-[1,1′-biphenyl]-2,2′,4,4′-tetraol (m/z 277) from reaction R42. During the daytime, the fate of phenolic compounds in water is affected by photochemical processing, which competes with oxidation pathways.65,66 The products in Scheme 4 should be of low volatility, similar to those from photosensitized reactions of syringaldehyde and vanillin in water that are known to result in high SOA mass yields from 80 to 107%.25 Related studies in water with photolytic production of HO• from nitrate and nitrite were also shown to promote the formation of aqueous SOA from syringaldehyde67 and vanillin.68,69 However, the oligomers from those homogeneous studies were represented as aromatic esters instead of heterogeneous coupling products such as those presented in Scheme 4. For comparison, oligomers from the heterogeneous ozonolysis and homogeneous photooxidation of vanillin in the presence of nitrate have been assigned in the past to nitroaromatic compounds.70,71
Conclusions
The results of this work show that effective heterogeneous oxidation of syringaldehyde, vanillin, and 4-hydroxybenzaldehyde is promoted by O3 and HO•, which can be applied to explain the interfacial processing of pollutants on particulate matter and urban grime. At atmospheric interfaces under an approximately global mean RH, polyhydroxyphenols, dimers and trimers, and polyfunctional carboxylic acids result from the action of ubiquitous oxidants over phenolic aldehydes. The molecules of O3(g) should be perceived not only to promote the ring fragmentation of aromatic pollutants but also to be an efficient partner in redox chemistry to create surface-adsorbed HO•. Importantly, once the reaction of the Criegee intermediate with water proceeds during ozonolysis and H2O2 is released, the surface is exposed to this additional oxidizer. The characteristic surface reactions studied involve the participation of O3, HO•, H2O2, phenoxy, and semiquinone radicals as well as carbon-centered and peroxy radicals, all of which should contribute to the atmospheric reactions of methoxyphenols from biomass burning. While the aldehyde group subtracts electron density from the phenol ring, the addition of one or two −OCH3 groups can enhance the oxidative surface processing by factors of ∼2 and ∼4, respectively.
The highly oxygenated products created are more water-soluble and partition better into the particle phase of aerosols. The expanded delocalization of electrons in the conjugated products, including dimers, and the presence of carbonyl chromophores indicate that the new chemistry demonstrated contributes to the pool of brown carbon chromophores available in the atmosphere.30,72,73 The reactions presented in Schemes 1–4 provide a description of how to generate mono-, di-, and tricarboxylic acids that are ubiquitous in aerosols dominated by biomass burning and anthropogenic emissions.72,74−78 Adsorbed water molecules are critical in determining the surface reactivity, mainly because they can increase the fluidity of the solid film for O3 adsorption and alter the reactivity of intermediates.79,80
Future work should explore the role of nitrate radicals on atmospheric interfaces and investigate alternative approaches to characterize the generated brown carbon at the molecular level. The integration of the present mechanistic observations for phenolic aldehyde and methoxyphenol heterogeneous chemistry can help to improve atmospheric chemistry models relevant to air pollution and climate change.
Acknowledgments
Support from the U.S. National Science Foundation under Award 1903744 to M.I.G. is gratefully acknowledged.
Supporting Information Available
The Supporting Information is available free of charge at https://pubs.acs.org/doi/10.1021/acs.jpca.2c04963.
Time series of syringaldehyde oxidation by UHPLC (Figure S1) (PDF)
The authors declare no competing financial interest.
Special Issue
Published as part of The Journal of Physical Chemistry virtual special issue “Michael R. Hoffmann Festschrift”.
Supplementary Material
References
- Bond T. C.; Streets D. G.; Yarber K. F.; Nelson S. M.; Woo J.-H.; Klimont Z. A technology-based global inventory of black and organic carbon emissions from combustion. J. Geophys. Res.: Atmos. 2004, 109, D14203. 10.1029/2003JD003697. [DOI] [Google Scholar]
- Ito A.; Penner J. E. Historical emissions of carbonaceous aerosols from biomass and fossil fuel burning for the period 1870–2000. Global Biogeochem. Cycles 2005, 19, GB2028. 10.1029/2004GB002374. [DOI] [Google Scholar]
- Intergovernmental Panel on Climate Change . Climate Change 2013: The Physical Science Basis; Contribution of Working Group I to the Fifth Assessment Report of the Intergovernmental Panel on Climate Change; Cambridge University Press: Cambridge, U.K., 2013; p 1535. [Google Scholar]
- De Gouw J.; Jimenez J. L. Organic Aerosols in the Earth’s Atmosphere. Environ. Sci. Technol. 2009, 43, 7614–7618. 10.1021/es9006004. [DOI] [PubMed] [Google Scholar]
- Simoneit B. R. T. Biomass burning — a review of organic tracers for smoke from incomplete combustion. Appl. Geochem. 2002, 17, 129–162. 10.1016/S0883-2927(01)00061-0. [DOI] [Google Scholar]
- Simoneit B. R. T.; Rogge W. F.; Mazurek M. A.; Standley L. J.; Hildemann L. M.; Cass G. R. Lignin pyrolysis products, lignans, and resin acids as specific tracers of plant classes in emissions from biomass combustion. Environ. Sci. Technol. 1993, 27, 2533–2541. 10.1021/es00048a034. [DOI] [Google Scholar]
- Kjällstrand J.; Ramnäs O.; Petersson G. Methoxyphenols from burning of Scandinavian forest plant materials. Chemosphere 2000, 41, 735–741. 10.1016/S0045-6535(99)00427-0. [DOI] [PubMed] [Google Scholar]
- Schauer J. J.; Kleeman M. J.; Cass G. R.; Simoneit B. R. T. Measurement of emissions from air pollution sources. 3. C1–C29 organic compounds from fireplace combustion of wood. Environ. Sci. Technol. 2001, 35, 1716–1728. 10.1021/es001331e. [DOI] [PubMed] [Google Scholar]
- Dron J.; El Haddad I.; Temime-Roussel B.; Jaffrezo J. L.; Wortham H.; Marchand N. Functional group composition of ambient and source organic aerosols determined by tandem mass spectrometry. Atmos. Chem. Phys. 2010, 10, 7041–7055. 10.5194/acp-10-7041-2010. [DOI] [Google Scholar]
- Decesari S.; Fuzzi S.; Facchini M. C.; Mircea M.; Emblico L.; Cavalli F.; Maenhaut W.; Chi X.; Schkolnik G.; Falkovich A.; et al. Characterization of the organic composition of aerosols from Rondônia, Brazil, during the LBA-SMOCC 2002 experiment and its representation through model compounds. Atmos. Chem. Phys. 2006, 6, 375–402. 10.5194/acp-6-375-2006. [DOI] [Google Scholar]
- Gilardoni S.; Massoli P.; Paglione M.; Giulianelli L.; Carbone C.; Rinaldi M.; Decesari S.; Sandrini S.; Costabile F.; Gobbi G. P.; et al. Direct observation of aqueous secondary organic aerosol from biomass-burning emissions. Proc. Natl. Acad. Sci. U. S. A. 2016, 113, 10013–10018. 10.1073/pnas.1602212113. [DOI] [PMC free article] [PubMed] [Google Scholar]
- Czech H.; Miersch T.; Orasche J.; Abbaszade G.; Sippula O.; Tissari J.; Michalke B.; Schnelle-Kreis J.; Streibel T.; Jokiniemi J.; et al. Chemical composition and speciation of particulate organic matter from modern residential small-scale wood combustion appliances. Sci. Total Environ. 2018, 612, 636–648. 10.1016/j.scitotenv.2017.08.263. [DOI] [PubMed] [Google Scholar]
- Brege M.; Paglione M.; Gilardoni S.; Decesari S.; Facchini M. C.; Mazzoleni L. R. Molecular insights on aging and aqueous-phase processing from ambient biomass burning emissions-influenced Po Valley fog and aerosol. Atmos. Chem. Phys. 2018, 18, 13197–13214. 10.5194/acp-18-13197-2018. [DOI] [Google Scholar]
- Miyazaki Y.; Kondo Y.; Shiraiwa M.; Takegawa N.; Miyakawa T.; Han S.; Kita K.; Hu M.; Deng Z. Q.; Zhao Y.; et al. Chemical characterization of water-soluble organic carbon aerosols at a rural site in the Pearl River Delta, China, in the summer of 2006. J. Geophys. Res. 2009, 114, D14208. 10.1029/2009JD011736. [DOI] [Google Scholar]
- Srivastava D.; Tomaz S.; Favez O.; Lanzafame G. M.; Golly B.; Besombes J.-L.; Alleman L. Y.; Jaffrezo J.-L.; Jacob V.; Perraudin E.; et al. Speciation of organic fraction does matter for source apportionment. Part 1: A one-year campaign in Grenoble (France). Sci. Total Environ. 2018, 624, 1598–1611. 10.1016/j.scitotenv.2017.12.135. [DOI] [PubMed] [Google Scholar]
- Zangrando R.; Barbaro E.; Zennaro P.; Rossi S.; Kehrwald N. M.; Gabrieli J.; Barbante C.; Gambaro A. Molecular Markers of Biomass Burning in Arctic Aerosols. Environ. Sci. Technol. 2013, 47, 8565–8574. 10.1021/es400125r. [DOI] [PubMed] [Google Scholar]
- Zangrando R.; Barbaro E.; Kirchgeorg T.; Vecchiato M.; Scalabrin E.; Radaelli M.; Đorđević D.; Barbante C.; Gambaro A. Five primary sources of organic aerosols in the urban atmosphere of Belgrade (Serbia). Sci. Total Environ. 2016, 571, 1441–1453. 10.1016/j.scitotenv.2016.06.188. [DOI] [PubMed] [Google Scholar]
- Estimation Programs Interface Suite for Microsoft® Windows, ver. 4.11; U.S. Environmental Protection Agency: Washington, DC, 2012.
- Net S.; Alvarez E. G.; Gligorovski S.; Wortham H. Heterogeneous reactions of ozone with methoxyphenols, in presence and absence of light. Atmos. Environ. 2011, 45, 3007–3014. 10.1016/j.atmosenv.2011.03.026. [DOI] [Google Scholar]
- Seinfeld J. H.; Pandis S. N.. Atmospheric Chemistry and Physics: From Air Pollution to Climate Change; John Wiley & Sons: New York, 1998. [Google Scholar]
- Tomaz S.; Cui T.; Chen Y.; Sexton K. G.; Roberts J. M.; Warneke C.; Yokelson R. J.; Surratt J. D.; Turpin B. J. Photochemical cloud processing of primary wildfire emissions as a potential source of secondary organic aerosol. Environ. Sci. Technol. 2018, 52, 11027–11037. 10.1021/acs.est.8b03293. [DOI] [PubMed] [Google Scholar]
- Hibino M.; Matsuda H.; Sato T.; Ose Y.; Nagase H.; Kito H. Generation of mutagenicity by ozonation of humic substances’ components. Sci. Total Environ. 1992, 116, 1–13. 10.1016/0048-9697(92)90361-U. [DOI] [PubMed] [Google Scholar]
- Andreozzi R.; Caprio V.; D’Amore M. G.; Insola A. p-Coumaric acid abatement by ozone in aqueous solution. Water Res. 1995, 29, 1–6. 10.1016/0043-1354(94)00142-T. [DOI] [Google Scholar]
- Liu C.; Zeng C. Heterogeneous kinetics of methoxyphenols in the OH-initiated reactions under different experimental conditions. Chemosphere 2018, 209, 560–567. 10.1016/j.chemosphere.2018.06.131. [DOI] [PubMed] [Google Scholar]
- Smith J. D.; Kinney H.; Anastasio C. Phenolic carbonyls undergo rapid aqueous photodegradation to form low-volatility, light-absorbing products. Atmos. Environ. 2016, 126, 36–44. 10.1016/j.atmosenv.2015.11.035. [DOI] [Google Scholar]
- Li Y. J.; Huang D. D.; Cheung H. Y.; Lee A. K. Y.; Chan C. K. Aqueous-phase photochemical oxidation and direct photolysis of vanillin - a model compound of methoxy phenols from biomass burning. Atmos. Chem. Phys. 2014, 14, 2871–2885. 10.5194/acp-14-2871-2014. [DOI] [Google Scholar]
- Yee L. D.; Kautzman K. E.; Loza C. L.; Schilling K. A.; Coggon M. M.; Chhabra P. S.; Chan M. N.; Chan A. W. H.; Hersey S. P.; Crounse J. D.; et al. Secondary organic aerosol formation from biomass burning intermediates: phenol and methoxyphenols. Atmos. Chem. Phys. 2013, 13, 8019–8043. 10.5194/acp-13-8019-2013. [DOI] [Google Scholar]
- Rana M. S.; Guzman M. I. Oxidation of phenolic aldehydes by ozone and hydroxyl radicals at the air-water interface. J. Phys. Chem. A 2020, 124, 8822–8833. 10.1021/acs.jpca.0c05944. [DOI] [PubMed] [Google Scholar]
- Rana M. S.Mechanistic Studies of Oxidative Processing of Phenolic Compounds at Atmospheric Interfaces. Doctoral Dissertation, University of Kentucky, Lexington, KY, 2022. [Google Scholar]
- Pillar-Little E. A.; Zhou R.; Guzman M. I. Heterogeneous oxidation of catechol. J. Phys. Chem. A 2015, 119, 10349–10359. 10.1021/acs.jpca.5b07914. [DOI] [PubMed] [Google Scholar]
- Pillar-Little E. A.; Guzman M. I. An overview of dynamic heterogeneous oxidations in the troposphere. Environments 2018, 5, 104. 10.3390/environments5090104. [DOI] [Google Scholar]
- Hartmann D. L.Global Physical Climatology; Academic Press, 1994; p 411. [Google Scholar]
- Pavia D. L.; Lampman G. M.; Kriz G. S.. Introduction to Spectroscopy, 3rd ed.; Brooks/Cole, 2003. [Google Scholar]
- Chen Y.; Bond T. C. Light absorption by organic carbon from wood combustion. Atmos. Chem. Phys. 2010, 10, 1773–1787. 10.5194/acp-10-1773-2010. [DOI] [Google Scholar]
- Zhou R.; Guzman M. I. CO2 reduction under periodic illumination of ZnS. J. Phys. Chem. C 2014, 118, 11649–11656. 10.1021/jp4126039. [DOI] [Google Scholar]
- Rajendiran N.; Balasubramanian T. Dual fluorescence of syringaldazine. Spectrochim. Acta, Part A 2007, 68, 894–904. 10.1016/j.saa.2007.01.004. [DOI] [PubMed] [Google Scholar]
- Robinson R. A.; Kiang A. K. The ionization constants of vanillin and two of its isomers. Trans. Faraday Soc. 1955, 51, 1398–1402. 10.1039/tf9555101398. [DOI] [Google Scholar]
- Nørgaard L.; Ridder C. Spectrophotometric determination of mixtures of 2-, 3-, and 4-hydroxybenzaldehydes by flow injection analysis and uv/vis photodiode-array detection. Talanta 1994, 41, 59–66. 10.1016/0039-9140(94)80168-1. [DOI] [PubMed] [Google Scholar]
- Mart H.; Yürük H.; Şaçak M.; Muradoğlu V.; Vilayetoğlu A. R. The synthesis, characterization and thermal stability of oligo-4-hydroxybenzaldehyde. Polym. Degrad. Stab. 2004, 83, 395–398. 10.1016/j.polymdegradstab.2003.08.003. [DOI] [Google Scholar]
- Kang J.; Irmak S.; Wilkins M. Conversion of lignin into renewable carboxylic acid compounds by advanced oxidation processes. Renewable Energy 2019, 135, 951–962. 10.1016/j.renene.2018.12.076. [DOI] [Google Scholar]
- Albarran G.; Mendoza E.; Schuler R. H. Concerted effects of substituents in the reaction of •OH radicals with aromatics: The hydroxybenzaldehydes. Radiat. Phys. Chem. 2016, 124, 46–51. 10.1016/j.radphyschem.2015.11.022. [DOI] [PubMed] [Google Scholar]
- Xia S.-S.; Eugene A. J.; Guzman M. I. Cross Photoreaction of Glyoxylic and Pyruvic Acids in Model Aqueous Aerosol. J. Phys. Chem. A 2018, 122, 6457–6466. 10.1021/acs.jpca.8b05724. [DOI] [PubMed] [Google Scholar]
- Guzman M. I.; Eugene A. J. Aqueous Photochemistry of 2-Oxocarboxylic Acids: Evidence, Mechanisms, and Atmospheric Impact. Molecules 2021, 26, 5278. 10.3390/molecules26175278. [DOI] [PMC free article] [PubMed] [Google Scholar]
- Srinivas B.; Sarin M. M. Light absorbing organic aerosols (brown carbon) over the tropical Indian Ocean: impact of biomass burning emissions. Environ. Res. Lett. 2013, 8, 044042. 10.1088/1748-9326/8/4/044042. [DOI] [Google Scholar]
- Srinivas B.; Rastogi N.; Sarin M. M.; Singh A.; Singh D. Mass absorption efficiency of light absorbing organic aerosols from source region of paddy-residue burning emissions in the Indo-Gangetic Plain. Atmos. Environ. 2016, 125, 360–370. 10.1016/j.atmosenv.2015.07.017. [DOI] [Google Scholar]
- Zhou S.; Lee A. K. Y.; McWhinney R. D.; Abbatt J. P. D. Burial effects of organic coatings on the heterogeneous reactivity of particle-borne benzo[a]pyrene (BaP) toward ozone. J. Phys. Chem. A 2012, 116, 7050–7056. 10.1021/jp3030705. [DOI] [PubMed] [Google Scholar]
- Berkemeier T.; Steimer S. S.; Krieger U. K.; Peter T.; Pöschl U.; Ammann M.; Shiraiwa M. Ozone uptake on glassy, semi-solid and liquid organic matter and the role of reactive oxygen intermediates in atmospheric aerosol chemistry. Phys. Chem. Chem. Phys. 2016, 18, 12662–12674. 10.1039/C6CP00634E. [DOI] [PubMed] [Google Scholar]
- Steenken S.; O’Neill P. Oxidative demethoxylation of methoxylated phenols and hydroxybenzoic acids by the hydroxyl radical. An in situ electron spin resonance, conductometric pulse radiolysis and product analysis study. J. Phys. Chem. 1977, 81, 505–508. 10.1021/j100521a002. [DOI] [Google Scholar]
- Pillar-Little E. A.; Guzman M. I.; Rodriguez J. M. Conversion of iodide to hypoiodous acid and iodine in aqueous microdroplets exposed to ozone. Environ. Sci. Technol. 2013, 47, 10971–10979. 10.1021/es401700h. [DOI] [PubMed] [Google Scholar]
- Fargues C.; Mathias Á.; Silva J.; Rodrigues A. Kinetics of vanillin oxidation. Chem. Eng. Technol. 1996, 19, 127–136. 10.1002/ceat.270190206. [DOI] [Google Scholar]
- Pillar-Little E. A.; Camm R. C.; Guzman M. I. Catechol oxidation by ozone and hydroxyl radicals at the air-water interface. Environ. Sci. Technol. 2014, 48, 14352–14360. 10.1021/es504094x. [DOI] [PubMed] [Google Scholar]
- He X.; Huang X. H. H.; Chow K. S.; Wang Q.; Zhang T.; Wu D.; Yu J. Z. Abundance and sources of phthalic acids, benzene-tricarboxylic acids, and phenolic acids in PM2.5 at urban and suburban sites in Southern China. ACS Earth Space Chem. 2018, 2, 147–158. 10.1021/acsearthspacechem.7b00131. [DOI] [Google Scholar]
- Tang S.; Li F.; Tsona N. T.; Lu C.; Wang X.; Du L. Aqueous-phase photooxidation of vanillic acid: A potential source of humic-like substances (HULIS). ACS Earth Space Chem. 2020, 4, 862–872. 10.1021/acsearthspacechem.0c00070. [DOI] [Google Scholar]
- Leitzke A.; Sonntag C. v. Ozonolysis of unsaturated acids in aqueous solution: Acrylic, methacrylic, maleic, fumaric and muconic acids. Ozone: Sci. Eng. 2009, 31, 301–308. 10.1080/01919510903041354. [DOI] [Google Scholar]
- Wang Y.; Zhuang G.; Chen S.; An Z.; Zheng A. Characteristics and sources of formic, acetic and oxalic acids in PM2.5 and PM10 aerosols in Beijing, China. Atmos. Res. 2007, 84, 169–181. 10.1016/j.atmosres.2006.07.001. [DOI] [Google Scholar]
- Norton R. B. Measurements of gas phase formic and acetic acids at the Mauna Loa Observatory, Hawaii during the Mauna Loa Observatory Photochemistry Experiment 1988. J. Geophys. Res.: Atmos. 1992, 97, 10389–10393. 10.1029/91JD02297. [DOI] [Google Scholar]
- Xu J.; Chen J.; Shi Y.; Zhao N.; Qin X.; Yu G.; Liu J.; Lin Y.; Fu Q.; Weber R. J.; et al. First continuous measurement of gaseous and particulate formic acid in a suburban area of East China: Seasonality and gas-particle partitioning. ACS Earth Space Chem. 2020, 4, 157–167. 10.1021/acsearthspacechem.9b00210. [DOI] [Google Scholar]
- Charbouillot T.; Gorini S.; Voyard G.; Parazols M.; Brigante M.; Deguillaume L.; Delort A.-M.; Mailhot G. Mechanism of carboxylic acid photooxidation in atmospheric aqueous phase: Formation, fate and reactivity. Atmos. Environ. 2012, 56, 1–8. 10.1016/j.atmosenv.2012.03.079. [DOI] [Google Scholar]
- Friedman B.; Farmer D. K. SOA and gas phase organic acid yields from the sequential photooxidation of seven monoterpenes. Atmos. Environ. 2018, 187, 335–345. 10.1016/j.atmosenv.2018.06.003. [DOI] [Google Scholar]
- Eugene A. J.; Xia S.-S.; Guzman M. I. Aqueous photochemistry of glyoxylic acid. J. Phys. Chem. A 2016, 120, 3817–3826. 10.1021/acs.jpca.6b00225. [DOI] [PubMed] [Google Scholar]
- Pillar-Little E. A.; Guzman M. I. Oxidation of substituted catechols at the air-water interface: Production of carboxylic acids, quinones, and polyphenols. Environ. Sci. Technol. 2017, 51, 4951–4959. 10.1021/acs.est.7b00232. [DOI] [PubMed] [Google Scholar]
- Flyunt R.; Leitzke A.; Mark G.; Mvula E.; Reisz E.; Schick R.; von Sonntag C. Determination of •OH, O2•-, and hydroperoxide yields in ozone reactions in aqueous solution. J. Phys. Chem. B 2003, 107, 7242–7253. 10.1021/jp022455b. [DOI] [Google Scholar]
- Criegee R.; Wenner G. Die Ozonisierung des 9,10-Oktalins. Justus Liebigs Ann. Chem. 1949, 564, 9–15. 10.1002/jlac.19495640103. [DOI] [Google Scholar]
- Criegee R. Mechanism of ozonolysis. Angew. Chem., Int. Ed. 1975, 14, 745–752. 10.1002/anie.197507451. [DOI] [Google Scholar]
- Yu L.; Smith J.; Laskin A.; Anastasio C.; Laskin J.; Zhang Q. Chemical characterization of SOA formed from aqueous-phase reactions of phenols with the triplet excited state of carbonyl and hydroxyl radical. Atmos. Chem. Phys. 2014, 14, 13801–13816. 10.5194/acp-14-13801-2014. [DOI] [Google Scholar]
- Li X.; Tao Y.; Zhu L.; Ma S.; Luo S.; Zhao Z.; Sun N.; Ge X.; Ye Z. Optical and chemical properties and oxidative potential of aqueous-phase products from OH and 3C*-initiated photooxidation of eugenol. Atmos. Chem. Phys. 2022, 22, 7793–7814. 10.5194/acp-22-7793-2022. [DOI] [Google Scholar]
- Huang D. D.; Zhang Q.; Cheung H. H. Y.; Yu L.; Zhou S.; Anastasio C.; Smith J. D.; Chan C. K. Formation and evolution of aqSOA from aqueous-phase reactions of phenolic carbonyls: Comparison between ammonium sulfate and ammonium nitrate solutions. Environ. Sci. Technol. 2018, 52, 9215–9224. 10.1021/acs.est.8b03441. [DOI] [PubMed] [Google Scholar]
- Pang H.; Zhang Q.; Lu X.; Li K.; Chen H.; Chen J.; Yang X.; Ma Y.; Ma J.; Huang C. Nitrite-mediated photooxidation of vanillin in the atmospheric aqueous phase. Environ. Sci. Technol. 2019, 53, 14253–14263. 10.1021/acs.est.9b03649. [DOI] [PubMed] [Google Scholar]
- Mabato B. R. G.; Lyu Y.; Ji Y.; Li Y. J.; Huang D. D.; Li X.; Nah T.; Lam C. H.; Chan C. K. Aqueous secondary organic aerosol formation from the direct photosensitized oxidation of vanillin in the absence and presence of ammonium nitrate. Atmos. Chem. Phys. 2022, 22, 273–293. 10.5194/acp-22-273-2022. [DOI] [Google Scholar]
- Wang Y.; Mekic M.; Li P.; Deng H.; Liu S.; Jiang B.; Jin B.; Vione D.; Gligorovski S. Ionic strength effect triggers brown carbon formation through heterogeneous ozone processing of ortho-vanillin. Environ. Sci. Technol. 2021, 55, 4553–4564. 10.1021/acs.est.1c00874. [DOI] [PubMed] [Google Scholar]
- Loisel G.; Mekic M.; Liu S.; Song W.; Jiang B.; Wang Y.; Deng H.; Gligorovski S. Ionic strength effect on the formation of organonitrate compounds through photochemical degradation of vanillin in liquid water of aerosols. Atmos. Environ. 2021, 246, 118140. 10.1016/j.atmosenv.2020.118140. [DOI] [Google Scholar]
- Laskin A.; Laskin J.; Nizkorodov S. A. Chemistry of atmospheric brown carbon. Chem. Rev. 2015, 115, 4335–82. 10.1021/cr5006167. [DOI] [PubMed] [Google Scholar]
- Liu J.; Scheuer E.; Dibb J.; Diskin G. S.; Ziemba L. D.; Thornhill K. L.; Anderson B. E.; Wisthaler A.; Mikoviny T.; Devi J. J.; et al. Brown carbon aerosol in the North American continental troposphere: sources, abundance, and radiative forcing. Atmos. Chem. Phys. 2015, 15, 7841–7858. 10.5194/acp-15-7841-2015. [DOI] [Google Scholar]
- Kundu S.; Kawamura K.; Andreae T. W.; Hoffer A.; Andreae M. O. Molecular distributions of dicarboxylic acids, ketocarboxylic acids and α-dicarbonyls in biomass burning aerosols: implications for photochemical production and degradation in smoke layers. Atmos. Chem. Phys. 2010, 10, 2209–2225. 10.5194/acp-10-2209-2010. [DOI] [Google Scholar]
- Kunwar B.; Kawamura K.; Fujiwara S.; Fu P.; Miyazaki Y.; Pokhrel A. Dicarboxylic acids, oxocarboxylic acids and α-dicarbonyls in atmospheric aerosols from Mt. Fuji, Japan: Implication for primary emission versus secondary formation. Atmos. Res. 2019, 221, 58–71. 10.1016/j.atmosres.2019.01.021. [DOI] [Google Scholar]
- Kawamura K.; Tachibana E.; Okuzawa K.; Aggarwal S. G.; Kanaya Y.; Wang Z. F. High abundances of water-soluble dicarboxylic acids, ketocarboxylic acids and α-dicarbonyls in the mountaintop aerosols over the North China Plain during wheat burning season. Atmos. Chem. Phys. 2013, 13, 8285–8302. 10.5194/acp-13-8285-2013. [DOI] [Google Scholar]
- Hu Q.; Xie Z.; Wang X.; Kang H.; Zhang Y.; Ding X.; Zhang P. Monocarboxylic and dicarboxylic acids over oceans from the East China Sea to the Arctic Ocean: Roles of ocean emissions, continental input and secondary formation. Sci. Total Environ. 2018, 640–641, 284–292. 10.1016/j.scitotenv.2018.05.311. [DOI] [PubMed] [Google Scholar]
- Hems R. F.; Schnitzler E. G.; Liu-Kang C.; Cappa C. D.; Abbatt J. P. D. Aging of atmospheric brown carbon aerosol. ACS Earth Space Chem. 2021, 5, 722–748. 10.1021/acsearthspacechem.0c00346. [DOI] [Google Scholar]
- Zhou S.; Shiraiwa M.; McWhinney R. D.; Pöschl U.; Abbatt J. P. D. Kinetic limitations in gas-particle reactions arising from slow diffusion in secondary organic aerosol. Faraday Discuss. 2013, 165, 391–406. 10.1039/C3FD00030C. [DOI] [PubMed] [Google Scholar]
- Chao W.; Hsieh J.-T.; Chang C.-H.; Lin J. J.-M. Direct kinetic measurement of the reaction of the simplest Criegee intermediate with water vapor. Science 2015, 347, 751–754. 10.1126/science.1261549. [DOI] [PubMed] [Google Scholar]
Associated Data
This section collects any data citations, data availability statements, or supplementary materials included in this article.


