

Abstract
In nonalcoholic fatty liver disease (NAFLD) the patatin‐like phospholipase domain‐containing 3 (PNPLA3) rs738409 variant is a contributor. In mice, the Pnpla3 148M variant accumulates on lipid droplets and probably leads to sequestration of a lipase cofactor leading to impaired mobilization of triglycerides. To advance our understanding of the localization and abundance of PNPLA3 protein in humans, we used liver biopsies from patients with NAFLD to investigate the link to NAFLD and the PNPLA3 148M genotype. We experimentally qualified an antibody against human PNPLA3. Hepatic PNPLA3 protein fractional area and localization were determined by immunohistochemistry in biopsies from a well‐characterized NAFLD cohort of 67 patients. Potential differences in hepatic PNPLA3 protein levels among patients related to degree of steatosis, lobular inflammation, ballooning, and fibrosis, and PNPLA3 I148M gene variants were assessed. Immunohistochemistry staining in biopsies from patients with NAFLD showed that hepatic PNPLA3 protein was predominantly localized to the membranes of small and large lipid droplets in hepatocytes. PNPLA3 protein levels correlated strongly with steatosis grade (p = 0.000027) and were also significantly higher in patients with lobular inflammation (p = 0.009), ballooning (p = 0.022), and significant fibrosis (stage 2–4, p = 0.014). In addition, PNPLA3 levels were higher in PNPLA3 rs738409 148M (CG, GG) risk allele carriers compared to 148I (CC) nonrisk allele carriers (p = 0.0029). Conclusion: PNPLA3 protein levels were associated with increased hepatic lipid content and disease severity in patients with NAFLD and were higher in PNPLA3 rs738409 (148M) risk allele carriers. Our hypothesis that increased hepatic levels of PNPLA3 may be part of the pathophysiological mechanism of NAFLD is supported.
A specific variant in the PNPLA3 gene is a known genetic risk factor for NAFLD. We validated an antibody recognizing the PNPLA3 protein and used it to show that the PNPLA3 protein is primarily located on hepatic lipid droplets in human liver samples from patients with NAFLD. We also showed that PNPLA3 protein levels are associated with NAFLD and that carriers of the specific PNPLA3 gene variant had higher hepatic levels of the protein compared to subjects without the mutation. The hypothesis that increased hepatic PNPLA3 protein levels in subjects carrying the mutation contributes to their increased risk of NAFLD is supported.

INTRODUCTION
Nonalcoholic fatty liver disease (NAFLD) has become the most common cause of chronic liver disease in adults, affecting approximately 25% of the global population.[ 1 ] The histopathological features of NAFLD range from isolated steatosis to nonalcoholic steatohepatitis (NASH) and cirrhosis, with an increased risk of developing hepatocellular carcinoma (HCC).[ 2 , 3 , 4 ] In addition to hepatic fat accumulation, NASH involves lobular inflammation and ballooning degeneration.[ 5 ]
In 2008, a significant association between fatty liver and the patatin‐like phospholipase domain‐containing 3 (PNPLA3) rs738409 C>G genetic variant (I148M) was reported.[ 6 ] This association has been extensively confirmed and expanded to all components of NAFLD as well as HCC.[ 6 , 7 , 8 , 9 ]
The impact of this polymorphism has been characterized in vitro and in vivo in animal models. PNPLA3 is a lipase that hydrolyses triglycerides and retinyl esters, and the PNPLA3 148M protein variant exhibits reduced enzymatic activity.[ 10 , 11 ] Studies in mice have shown that deletion of the ancestral Pnpla3 148I gene and thereby the enzymatic activity does not lead to hepatic steatosis,[ 12 , 13 ] indicating that reduced enzymatic activity of PNPLA3 is not related to development of steatosis. However, overexpression of human PNPLA3 148M, but not ancestral 148I, induces hepatic steatosis in mice.[ 14 ] The Pnpla3 148M variant accumulates on lipid droplets as a result of a slower turnover rate caused by decreased ubiquitylation and proteasomal degradation.[ 15 ] Taken together, these previous findings in mice suggest that the introduction of the 148M protein is related to increased risk for NAFLD/NASH.
Despite the described impact of the PNPLA3 rs738409 polymorphism on NAFLD, few studies have explored the association of PNPLA3 localization and protein levels with NAFLD histopathology and disease progression in humans. Previous research in this field may have been hampered by the lack of a carefully characterized antibody for immunostaining of human liver biopsy samples.
The aim of the current study was to qualify a PNPLA3 antibody suitable for immunohistochemistry (IHC) and use it to investigate localization and levels of PNPLA3 protein in human liver and association to NAFLD severity in patients. Furthermore, hepatic PNPLA3 protein levels in PNPLA3 rs738409 (148M) risk allele carriers were compared with noncarriers.
MATERIALS AND METHODS
In vitro validation of the human PNPLA3 antibody
HEK293 cells (ATCC CRL‐1573) were grown under standard conditions and transfected with FLAG (DDK)‐tagged plasmids expressing human or mouse PNPLA2 or PNPLA3, or VHH‐FLAG‐Halo (Table S1). Cells were transfected using Fugene HD (Promega) according to the instructions from the vendor. After 48 hours, cells were lysed and western blot experiments performed as detailed in the Supporting Materials and Methods. The following primary antibodies were used: sheep polyclonal anti‐human PNPLA3 (1:1000, AF5208; R&D Systems, Minneapolis, MN, USA), mouse monoclonal anti‐FLAG M2 (1:1000, F1804; Sigma Aldrich, USA), and rabbit polyclonal anti‐alpha tubulin (1:200, ab4074; Abcam, UK). Membranes were washed and incubated with horseradish peroxidase (HRP)‐conjugated secondary antibodies anti‐rabbit (1:3000, 7074S; Cell Signaling Technologies, Inc, USA), anti‐mouse (1:3000, 7076S; Cell Signaling Technologies), or anti‐sheep (1:2000, ab6900; Abcam). Western blots were visualized with chemiluminescent HRP substrate (WBLUR0500; Millipore, USA), using the ChemiDoc MP imaging system (Bio‐Rad, USA).
In vivo validation of the human PNPLA3 antibody
A transgenic C57BL/6 mouse line expressing full‐length ancestral human PNPLA3 148I under the endogenous promoter was generated as detailed in the Supporting Materials and Methods. Treatment of the mice was in accordance with the conditions specified in the Guide for the Care and Use of Laboratory Animals.[ 16 ] The study protocol was approved by the Institutional Animal Care and Use Committee at Ionis Pharmaceuticals (Carlsbad, CA, USA) before dose administration. Mice were housed two to four animals per cage and maintained on a 12‐hour light–dark cycle.
In the antibody validation study, male human PNPLA3 transgenic mice (60 weeks old) were fed either a chow diet (n = 12; LagDiet, Picolab verified‐75‐IF) or a high‐sucrose diet (n = 12; Envigo Teklad Diets, TD.98090). Two weeks later, four mice from each diet group were administered saline, N‐acetylgalactosamine (GalNAc)‐conjugated control antisense oligonucleotide (ASO), or GalNAc‐conjugated ASO targeting human PNPLA3, at 5 mg/kg/week for a total treatment time of 2 weeks (three injections). The ASO chemistry 5′THAGN3 3‐10‐3 cEt was used,[ 17 ] and the 5′‐ to 3′‐sequences were GGCCAATACGCCGTCA (control ASO) and GTAATATTCAGACCAG (PNPLA3‐targeting ASO). Seventy‐two hours following the final dose, the mice were killed. The livers were dissected and cut into pieces, and tissue for quantitative real‐time polymerase chain reaction (qPCR) analysis was flash frozen in liquid N2. A 4‐mm slice of the left lobular lobe was formalin fixed and paraffin embedded (FFPE). The FFPE liver slices were sectioned into 4 μm and used for IHC analyses.
qPCR analysis of human PNPLA3 messenger RNA expression
Mouse liver tissue (20 mg) was lysed as detailed in the Supporting Materials and Methods. The complementary DNA was diluted to 4 ng/μl, and 12 ng was used in a total qPCR reaction volume of 10 μL.
Gene expression assays were purchased from ThermoFisher Scientific. Hs00228747_m1 was used to quantify human PNPLA3 messenger RNA (mRNA) expression in the transgenic mice, and mouse B2m (Mm00437762_m1) was used as the internal control. The qPCR reactions were set up in triplicate for each liver sample and measured using TaqMan Fast Advanced Master Mix (4444557; ThermoFisher Scientific), following instructions from the vendor. A Quantstudio 7 Flex instrument (Life Technologies) was used to run the qPCR. After retrieving Ct values, relative expression levels were determined using the 2−ΔΔCt method.[ 18 ]
NAFLD cohort
This study is based on a long‐term follow‐up cohort of patients with NAFLD and is intended to follow the natural history of the disease.[ 19 , 20 ] In total, 129 patients with biopsy‐proven NAFLD and undergoing clinical work‐up due to elevated liver enzymes were prospectively enrolled between 1988 and 1993. All patients still alive were invited to a first follow‐up between 2003 and 2005 and a second follow‐up between 2013 and 2015. Standard of care was provided (life‐style advice), and concurrent metabolic risk factors and morbidities associated with NAFLD were managed as clinically required. The PNPLA3 I148M genotype of the cohort has been assessed.[ 21 ] Biopsy samples for additional analyses were only available from the first and second follow‐up visits, and therefore this study focuses on these patients. In total, 67 patients assessed for the PNPLA3 I148M genotype accepted liver biopsy at follow‐up 1, and 28 of these patients also accepted liver biopsy at follow‐up 2.
Written informed consent was obtained from each patient included in the study, and the study protocol conforms to the ethical guidelines of the 1975 Declaration of Helsinki, as reflected in a priori approval by the institution's human research committee.
Sample collection and histology scoring
Human biopsy samples were collected after an overnight fast. FFPE 4‐μm sections of liver needle biopsies were stained with hematoxylin and eosin (H&E) and picrosirus red (PSR). Liver steatosis grade, lobular inflammation grade, hepatocellular ballooning grade, and fibrosis stage were scored by an experienced liver pathologist in the H&E‐ and PRS‐stained liver sections by using a conventional histopathological method.[ 22 , 23 ]
Image‐based artificial intelligence application for quantification of lipid content and cross‐sectional lipid droplet size in biopsy samples
Addressing the need in the field for an automated and accurate method to assess lipid content in liver biopsies, we optimized an artificial intelligence (AI) application to detect and count hepatic fat droplets in H&E‐stained slides in the Visiopharm image analysis system (Figure S1A,B). The hepatic fat areas were initially manually annotated on a high number of sections, thereby teaching the machine‐learning algorithm how to distinguish these areas from the background, such as vessels and artefacts. To avoid including glycogen, only circular droplets inside the hepatocytes were used to detect fractional lipid area and to count the number of lipid droplets.
To validate this method, the hepatic lipid levels were compared to both steatosis grade and to a quantitative manual method (stereological point counting), where a point grid lattice is superimposed on 10 randomly selected images from each biopsy and the number of fat globules is counted.[ 24 ] The hepatic lipid levels assessed by the AI application showed high correlation to both steatosis grade (Figure S2A; p = 4.1 × 10⁻¹¹) and to hepatic lipid content quantified by stereological point counting (Figure S2B; r = 0.96; p = 2.2 × 10⁻¹⁶). Similarly, after calculating the average cross‐sectional lipid droplet area by dividing hepatic lipid area by the total number of lipid droplets, larger average droplets strongly correlated with higher steatosis grade (Figure S2C; p = 3.7 × 10⁻⁹).
PNPLA3 immunohistochemistry
FFPE sections were immunohistochemically stained for PNPLA3 (AF5208; R&D Systems), dilution 1:750 (mouse) and 1:300 (human), using an automated Ventana Ultra system (Ventana Medical Systems, Inc, Roche Group, USA).
The deparaffination and pretreatment were performed in the Ventana system as described in the Supporting Materials and Methods. After staining, slides were scanned into a slide scanner (Pannoramic Scan II; 3DHISTECH Ltd, Budapest, Hungary). Image analysis was performed on digital images using Visiopharm Integrator System software (version 2020.03.0.7300; Visiopharm, Hørsholm, Denmark) (Figure S1C–F).
In the PNPLA3 IHC‐stained slides, the diaminobenzidine‐stained area and the total section area were detected by threshold and machine learning in the Visiopharm image analysis system. The PNPLA3‐positive area was quantified and expressed as a fraction of the total section area excluding blood vessels (i.e., the reported PNPLA3 levels are semiquantitative). Artefacts such as folds in the sections, were removed before performing measurements.
Data analysis
Statistical analysis was performed and data graphs were produced using R Studio (version 3.6.3). Continuous variables were summarized with median and interquartile range (IQR), and categorical variables were summarized by counts and percentages in each category. Comparisons between groups were performed applying nonparametric methods assuming independent samples, using Kruskal‐Wallis or Wilcoxon rank‐sum tests for continuous variables and Fisher's exact test for categorical variables. Correlations between continuous variables were calculated using Spearman's correlation coefficient. Overall, a cutoff of p ≤ 0.05 was considered significant. All analyses were separately performed at each visit.
RESULTS
Identification and validation of an antibody recognizing human PNPLA3 by immunohistochemistry
A prerequisite to perform this study was the identification of a specific antibody enabling accurate identification and quantification of PNPLA3 protein levels in human liver biopsies. Therefore, we performed a two‐step antibody validation process. First, we tested commercially available and internally generated antibodies by using HEK293‐cells. These cells express no detectable endogenous PNPLA3 (Figure 1A, lanes 1 and 2) or PNPLA2[ 25 ] (also known as adipose triglyceride lipase, ATGL) in western blot experiments; therefore, they can be used to investigate antibody specificity against PNPLA3 versus nonspecific binding to the close homolog PNPLA2 by overexpressing these proteins individually. After transiently transfecting the HEK293 cells with expression vectors encoding human or mouse PNPLA2 or PNPLA3, we ensured that the transfection experiment was successful by confirming that the FLAG‐tag in the expression vectors could be detected after lysing the cells 48 hours after transfection (Figure 1B, lanes 2–6).
FIGURE 1.
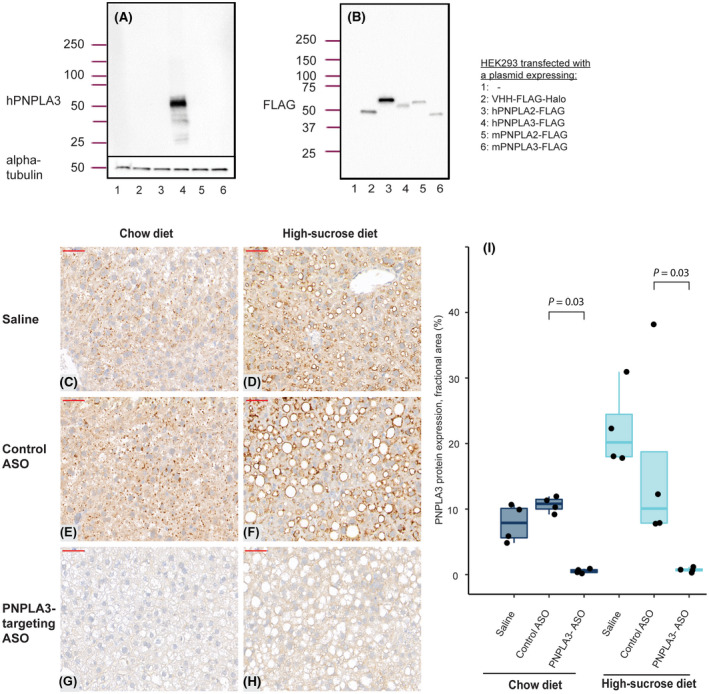
Validation of the PNPLA3 antibody in HEK293 cells and in mice overexpressing human PNPLA3. Western blot analysis using antibodies detecting (A) human PNPLA3 or (B) the FLAG‐tag in lysates from HEK293 cells transfected with plasmids, as indicated in the figure. (C–H) Immunohistochemistry analyses of human PNPLA3 levels on sections from transgenic mice expressing human PNPLA3 (magnification ×40). (C, E, G) Mice fed a chow diet or (D, F, H) a high‐sucrose diet were administered saline solution (C,D), control ASO (E, F), or ASO targeting human PNPLA3 (G, H). The size bar (in red) indicates 50 μm. (I) Quantification of PNPLA3 expression determined by immunohistochemistry as the fractional area of the image containing a signal from the PNPLA3 antibody. Boxes reflect the interquartile range, with the horizontal line indicating median PNPLA3 expression. Statistical analysis was performed using Wilcoxon tests; n = 4 mice/treatment group. ASO, antisense oligonucleotide; h, human; m, mouse; PNPLA3, patatin‐like phospholipase domain‐containing 3.
The only tested antibody that generated a specific signal in western blot analysis detecting human PNPLA3 protein expressed in transfected HEK293 cells was AF5208 (Figure 1A). No signal was obtained in native nontransfected HEK293 cells or in cells overexpressing human PNPLA2, mouse Pnpla2, mouse Pnpla3, or the FLAG‐tag only (Figure 1A). The absence of signal in these samples was not due to unsuccessful transfection because the FLAG‐tag was detected in all transfected cell samples (Figure 1B). Taken together, our results show antibody specificity toward human PNPLA3 versus human PNPLA2 or its mouse counterparts.
In our second antibody validation step, we used a transgenic mouse model expressing the full‐length wild‐type human PNPLA3 gene under its endogenous promoter. To ensure that the antibody recognized human PNPLA3 and that the signal could be reduced with reductions in PNPLA3 protein levels in an IHC setting, we treated the mice with an antisense oligonucleotide targeting human PNPLA3 but not the endogenously expressed mouse Pnpla3 gene. Two weeks later, the mice were killed and IHC of liver samples from the humanized PNPLA3 transgenic mouse was performed. Human PNPLA3 protein was detected in samples from animals on both chow diet and steatosis‐inducing high‐sucrose diet treated with vehicle or control ASO (Figure 1C, D, E, F) but not with the PNPLA3‐targeting ASO (Figure 1G,H). The automated digital image analysis confirmed ASO treatment‐mediated ablation of hepatic human PNPLA3 protein levels expressed as the fractional area (Figure 1I). Reduced expression of human PNPLA3 mRNA levels was also confirmed (Figure S3).
Taken together, our antibody validation in HEK293 cells and in transgenic mice demonstrates that the PNPLA3 antibody AF5208 can be used to specifically detect PNPLA3 expression in human liver biopsies.
Patient cohort with NAFLD
The NAFLD cohort consisted predominantly of middle‐aged male patients with biopsy‐proven NAFLD. Patients with NAFLD that at follow‐up had steatosis grade 0 were included as controls. Clinical and biochemical characteristics of the cohort at follow‐up 1 and follow‐up 2 (approximately 10 years after follow‐up 1) are described in Table 1.
TABLE 1.
Cohort characteristics at follow‐up 1 and follow‐up 2
| Variable | Follow‐up 1 | Follow‐up 2 |
|---|---|---|
| Number of patients | 67 | 28 |
| PNPLA3 allele | ||
| CC, n (%) | 27 (40.3) | 12 (42.9) |
| CG, n (%) | 32 (47.8) | 12 (42.9) |
| GG, n (%) | 8 (11.9) | 4 (14.3) |
| Age (years), median [IQR] | 62.3 [52.4, 69.2] | 67.6 [58.6, 74.7] |
| Sex (female), n (%) | 20 (29.9) | 4 (14.3) |
| T2D diagnosis, n (%) | 36 (53.7) | 16 (57.1) |
| BMI (kg/m2), median [IQR] | 28.1 [26.0, 30.9] | 28.0 [26.1, 31.0] |
| HOMA‐IR, median [IQR] | 2.7 [2.1, 4.2] | 5.8 [3.0, 9.9] |
| Albumin (g/L), median [IQR] | 41.0 [39.0, 44.0] | 42.0 [39.8, 43.2] |
| Prothrombin (INR), median [IQR] | 1.0 [0.9, 1.0] | 1.0 [1.0, 1.1] |
| Bilirubin (mg/dl), median [IQR] | 0.7 [0.6, 0.8] | 0.6 [0.5, 0.8] |
| Platelets (109/L), median [IQR] | 232.0 [193.0, 266.5] | 216.0 [184.5, 290.0] |
| ALT (U/L), median [IQR] | 51.8 [38.8, 73.5] | 37.1 [27.9, 58.8] |
| AST (U/L), median [IQR] | 31.2 [26.5, 40.3] | 27.6 [25.1, 47.9] |
| ALP (U/L), median [IQR] | 56.5 [45.6, 67.5] | 57.6 [52.4, 73.5] |
| GGT (U/L), median [IQR] | 60 [36, 96] | 60 [36, 84] |
| Steatosis | ||
| 0, n (%) | 3 (4.5) | 4 (14.3) |
| 1, n (%) | 28 (41.8) | 9 (32.1) |
| 2, n (%) | 16 (23.9) | 13 (46.4) |
| 3, n (%) | 20 (29.9) | 2 (7.1) |
| Lobular inflammation | ||
| 0, n (%) | 63 (94.0) | 19 (70.4) |
| 1, n (%) | 4 (6.0) | 7 (25.9) |
| 2, n (%) | 0 (0.0) | 1 (3.7) |
| Hepatocellular ballooning | ||
| 0, n (%) | 53 (79.1) | 18 (66.7) |
| 1, n (%) | 13 (19.4) | 8 (29.6) |
| 2, n (%) | 1 (1.5) | 1 (3.7) |
| Fibrosis stage | ||
| 0, n (%) | 24 (35.8) | 12 (42.9) |
| 1, n (%) | 21 (31.3) | 3 (10.7) |
| 2, n (%) | 11 (16.4) | 9 (32.1) |
| 3, n (%) | 7 (10.4) | 4 (14.3) |
| 4, n (%) | 4 (6.0) | 0 (0.0) |
Abbreviations: ALT, alanine aminotransferase; AST, aspartate aminotransferase; ALP, alkaline phosphatase; BMI, body mass index; GGT, gamma‐glutamyltransferase; HOMA‐IR, homeostasis model assessment for insulin resistance, INR, international normalized ratio; IQR, interquartile range; PNPLA3, patatin‐like phospholipase domain‐containing 3; T2D, type 2 diabetes.
Human PNPLA3 protein localization and association with NAFLD
We used the validated antibody and IHC protocol to investigate hepatic PNPLA3 protein distribution and localization in the patient cohort. A low level of punctuate staining was observed in individuals without signs of steatosis (exemplified in Figure 2A,B), whereas a clear accumulation of PNPLA3 in larger lipid droplets was observed in individuals with steatosis grade 1–3 (Figure 2C–H). The PNPLA3 IHC staining was strongly associated with the membrane of hepatic lipid droplets regardless of size, which ranged from very small microvesicular droplets to macrovesicular lipid droplets.
FIGURE 2.
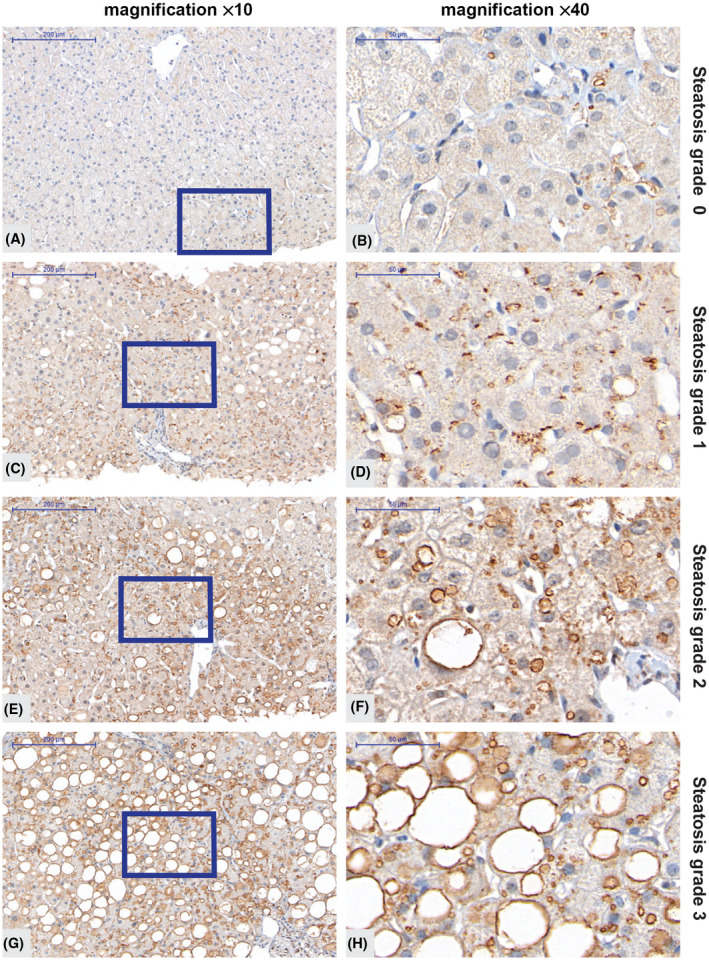
Immunohistochemistry analysis of PNPLA3 in liver biopsies from subjects with low and high steatosis grade. (A–H) Representative images showing PNPLA3 protein levels obtained with the antibody from R&D Systems (AF5208) at two magnification levels in an individual without any signs of steatosis (A,B), in an individual with steatosis grade 1 (C,D), 2 (E,F) or 3 (G,H). The size bar in the left panel indicates 200 μm and in the right panel 50 μm. The blue boxes (A,C,E,G) indicate the area magnified. PNPLA3, patatin‐like phospholipase domain‐containing 3.
PNPLA3 protein levels detected by IHC significantly increased with steatosis grade (Figure 3A; p = 0.000027) and were higher in patients with lobular inflammation (Figure 3B; p = 0.009), hepatocellular ballooning (Figure 3C; p = 0.022), and in patients with significant fibrosis (Figure 3D; p = 0.014). PNPLA3 protein levels determined at follow‐up 2 displayed a similar pattern while only reaching significance for steatosis and hepatocellular ballooning (Figure S4; p = 0.00024, p = 0.075, p = 0.041, and p = 0.16 for steatosis, lobular inflammation, hepatocellular ballooning, and significant fibrosis, respectively). In line with the correlation to steatosis, PNPLA3 expression correlated to both hepatic lipid content and cross‐sectional lipid droplet size at follow‐up 1 (Figure S5A; p = 4.1 × 10⁻⁶ and p = 1.3 × 10⁻⁵, respectively).
FIGURE 3.
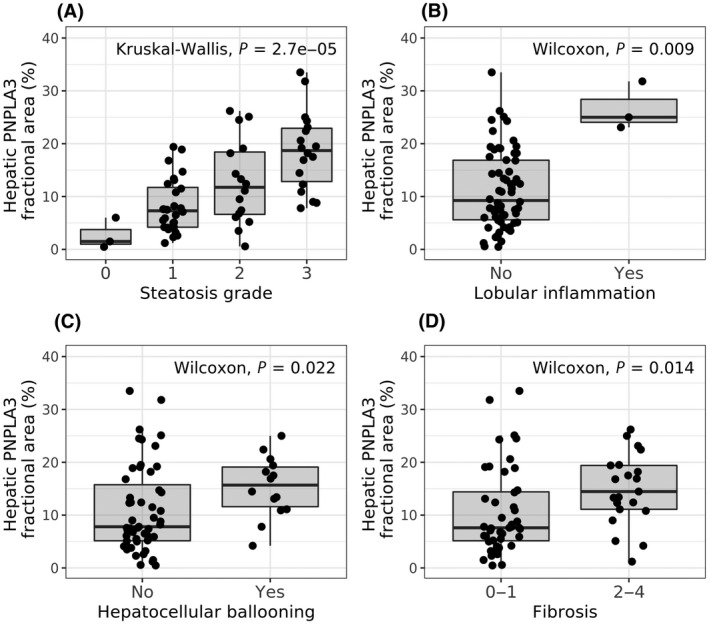
PNPLA3 levels in relation to disease severity in patients with NAFLD. Hepatic PNPLA3 protein levels in biopsy samples of patients with NAFLD from follow‐up 1 grouped by histologic assessment. Hepatic PNPLA3 protein levels versus (A) steatosis grade, (B) presence of lobular inflammation, (C) presence of hepatocellular ballooning, and (D) presence of significant fibrosis. Statistical analysis was performed using Wilcoxon/Kruskal‐Wallis rank‐sum tests. NAFLD, nonalcoholic fatty liver disease; PNPLA3, patatin‐like phospholipase domain‐containing 3.
Also, PNPLA3 protein levels correlated with liver function tests at follow‐up 1 (e.g., alanine aminotransferase, aspartate aminotransferase, and gamma‐glutamyltransferase; Figure S5A), although these correlations were not significant at follow‐up 2 (Figure S5B). Other plasma markers, such as platelets, bilirubin, prothrombin, and alkaline phosphatase, did not correlate with PNPLA3 protein levels.
Elevated PNPLA3 protein levels in rs738409 148M carriers
In total, 67 patients from follow‐up 1 were genotyped for PNPLA3 148 mutation status.[ 21 ] Of these, 27 patients (40%) did not carry the 148M mutation (noncarriers) and 40 patients (60%) were 148M risk allele carriers.
A cross‐sectional analysis of the NAFLD cohort at follow‐up 1 indicated no difference between PNPLA3 148M risk allele carriers and noncarriers in patient characteristics, including age, sex, and body mass index, or in metabolic parameters, such as type 2 diabetes diagnosis, hypertension, or homeostasis model assessment of insulin resistance (Table 2). Liver steatosis was increased in 148M risk allele carriers, while neither lobular inflammation, ballooning, or fibrosis differed significantly. Similar results were observed at follow‐up 2, approximately 10 years after follow‐up 1. However, at this visit, lobular inflammation was also significantly higher in PNPLA3 148M risk allele carriers compared to noncarriers (p = 0.01; Table S2).
TABLE 2.
Comparison of patient characteristics and NAFLD status between PNPLA3 148M carriers (CG + GG) and noncarriers (CC) at follow‐up 1
| Variable | CC | CG + GG | p value |
|---|---|---|---|
| Number of patients | 27 | 40 | |
| Age (years), median [IQR] | 64.3 [51.0, 69.2] | 62.2 [53.9, 69.1] | 0.93 |
| Sex (female), n (%) | 6 (22.2) | 14 (35.0) | 0.29 |
| T2D diagnosis, n (%) | 13 (48.1) | 23 (57.5) | 0.47 |
| BMI (kg/m2), median [IQR] | 28.4 [26.9, 31.1] | 28.1 [26.0, 30.9] | 0.53 |
| HOMA‐IR, median [IQR] | 2.5 [2.0, 3.8] | 2.9 [2.3, 4.5] | 0.29 |
| Albumin (g/L), median [IQR] | 42.0 [39.5, 45.0] | 41.0 [39.0, 43.2] | 0.25 |
| Prothrombin (INR), median [IQR] | 1.0 [0.9, 1.0] | 1.0 [0.9, 1.0] | 0.93 |
| Bilirubin (mg/dl), median [IQR] | 0.8 [0.6, 0.8] | 0.7 [0.6, 0.8] | 0.30 |
| Platelets (109/L), median [IQR] | 228.0 [177.0, 255.0] | 244.0 [203.2, 272.2] | 0.18 |
| ALT (U/L), median [IQR] | 53.5 [39.1, 85.3] | 50.0 [36.5, 66.2] | 0.77 |
| AST (U/L), median [IQR] | 31.2 [27.4, 45.0] | 31.2 [26.3, 38.4] | 0.55 |
| ALP (U/L), median [IQR] | 62.0 [48.3, 73.8] | 54.7 [42.9, 63.4] | 0.11 |
| GGT (U/L), median [IQR] | 48 [36, 120] | 60 [42, 66] | 47 |
| Steatosis | 0.03 | ||
| 0, n (%) | 1 (3.7) | 2 (5.0) | |
| 1, n (%) | 17 (63.0) | 11 (27.5) | |
| 2, n (%) | 4 (14.8) | 12 (30.0) | |
| 3, n (%) | 5 (18.5) | 15 (37.5) | |
| Lobular inflammation = 1 | 0 (0.0) | 4 (10.0) | 0.14 |
| Hepatic ballooning | 1 | ||
| 0, n (%) | 22 (81.5) | 31 (77.5) | |
| 1, n (%) | 5 (18.5) | 8 (20.0) | |
| 2, n (%) | 0 (0.0) | 1 (2.5) | |
| Fibrosis stage | 0.98 | ||
| 0, n (%) | 10 (37.0) | 14 (35.0) | |
| 1, n (%) | 8 (29.6) | 13 (32.5) | |
| 2, n (%) | 5 (18.5) | 6 (15.0) | |
| 3, n (%) | 3 (11.1) | 4 (10.0) | |
| 4, n (%) | 1 (3.7) | 3 (7.5) |
Abbreviations: ALT, alanine aminotransferase; AST, aspartate aminotransferase; ALP, alkaline phosphatase; BMI, body mass index; GGT, gamma‐glutamyltransferase; HOMA‐IR, homeostasis model assessment for insulin resistance, INR, international normalized ratio; IQR, interquartile range; PNPLA3, patatin‐like phospholipase domain‐containing 3; T2D, type 2 diabetes.
PNPLA3 protein levels were higher in PNPLA3 risk allele carriers compared to noncarriers both at follow‐up 1 (p = 0.0029; Figure 4A) and at follow‐up 2 (p = 0.02; Figure S6A). Similar to steatosis grade (Table 1), hepatic lipid content as well as average cross‐sectional lipid droplet area were higher in PNPLA3 risk allele carriers, reaching significance at follow‐up 1 (p = 0.0091 and p = 0.013, respectively; Figure 4B,C) with clear trends at follow‐up 2 (p = 0.058 and p = 0.1; respectively; Figure S6B,C).
FIGURE 4.
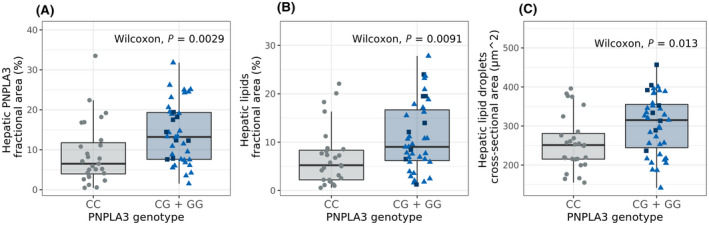
Hepatic PNPLA3 protein levels, hepatic lipid fractional area, and lipid droplet size in liver biopsies divided by PNPLA3 I48M genotype. PNPLA3 I148M genotype versus (A) hepatic PNPLA3 protein levels, (B) hepatic lipid levels, and (C) average hepatic lipid droplet size. PNPLA3 I148M risk allele carriers CG (light blue triangle), GG (dark blue square), noncarriers CC (gray circles). Statistical analysis was performed comparing risk allele carriers to noncarriers by Wilcoxon rank‐sum tests. PNPLA3, patatin‐like phospholipase domain‐containing 3.
To further explore potential differences between PNPLA3 genotypes, we compared PNPLA3 protein levels at different steatosis grades. Interestingly, risk allele carriers at steatosis grade 1 had significantly higher PNPLA3 protein levels compared to noncarriers (Figure 5; p = 0.01). This difference was not seen at higher steatosis grades. Similar results were achieved applying multivariate regression modeling (p = 0.053 at steatosis grade 1, p = 0.16 at steatosis grade 2, and p = 0.52 at steatosis grade 3; Table S3). Hepatic PNPLA3 protein levels were higher in patients who were risk allele carriers both with (F3–4, p = 0.012) and without (F0–1, p = 0.019) significant fibrosis (Figure S7). The limited number of non‐risk allele carriers with lobular inflammation or ballooning made it challenging to perform a valid statistical analysis for these parameters compared to the PNPLA3 I148M genotype and protein levels (Figure S7).
FIGURE 5.
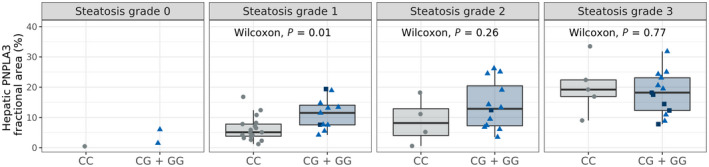
PNPLA3 protein levels in patients with NAFLD with different steatosis grades and PNPLA3 I148M genotype. Hepatic PNPLA3 levels in biopsy samples of patients with NAFLD grouped by PNPLA3 I148M allele variant showing risk allele carriers (CG, light blue triangle; GG, dark blue square) and noncarriers (CC, gray circles) and by steatosis grade. Statistical analysis was performed comparing PNPLA3 148M risk allele carriers to noncarriers by Wilcoxon rank‐sum tests at each steatosis grade. NAFLD, nonalcoholic fatty liver disease; PNPLA3, patatin‐like phospholipase domain‐containing 3.
DISCUSSION
In this study, we investigated the relationship between PNPLA3 genetics and protein levels in human NAFLD. The major contributions of this study are (i) validation of a human PNPLA3 antibody for IHC, (ii) localization of human PNPLA3 protein predominantly to lipid droplet membranes in hepatocytes, (iii) demonstration of increased levels of hepatic PNPLA3 protein in patients with NAFLD with the PNPLA3 148M genotype, and (iv) correlation between PNPLA3 protein levels and NAFLD, in particular steatosis. Interestingly, a Mendelian randomization study demonstrated that long‐term hepatic fat accumulation plays a causal role in the development of chronic liver disease.[ 26 ] Taken together, our findings strongly support the experimental data in mice[ 15 , 27 ] that increased hepatic levels of PNPLA3, located on lipid droplets in hepatocytes, is part of the pathophysiological mechanism of NAFLD in PNPLA3 rs738409 (148M) risk allele carriers.
Previous studies in humans demonstrated a strong genetic association between PNPLA3 148M and all components of NAFLD.[ 6 , 7 , 8 , 28 , 29 , 30 , 31 , 32 ] However, few studies have assessed hepatic PNPLA3 protein level and cellular localization in relation to NAFLD. Challenges associated with identifying a specific antibody detecting human PNPLA3 by using IHC may have contributed to this. In this study, we qualified a human PNPLA3‐specific antibody, allowing for IHC analyses of human liver sections. In liver biopsies from the NAFLD cohort, PNPLA3 protein was predominantly found in hepatocytes and associated with microvesicular and macrovesicular lipid droplet membranes. This expression pattern fits with findings from Donati et al.[ 33 ] showing PNPLA3 antibody reactivity specifically with hepatocytes but not with fibrous tissue or immune cells.
This study is based on a well‐characterized clinical cohort where patients had their initial baseline biopsy on average 13 years before the biopsy forming the main part of our analysis (follow‐up 1; 67 patients). Because patients did not undergo liver biopsy if clinical signs of compensated or decompensated cirrhosis were evident, few biopsies could be derived from patients with end‐stage liver disease. At follow‐up 1, few patients were homozygous for the G‐allele (Figure 5, squares). To increase the statistical power of this analysis, we therefore grouped heterozygous and homozygous 148M carriers and compared these with noncarriers. Importantly, we found that hepatic PNPLA3 protein levels were higher in PNPLA3 148M risk allele carriers compared to nonrisk allele carriers. The hepatic lipid content and size of the lipid droplets were also larger in PNPLA3 148M risk allele carriers, which is in accordance with an earlier finding linking large lipid droplets to PNPLA3 148M carriers.[ 34 ] Recently, a small study in 26 patients with NAFLD, using another antibody, found that PNPLA3 was predominantly expressed in hepatic stellate cells and was elevated in PNPLA3 148M carriers.[ 35 ] Although the cellular localization of PNPLA3 in that study differs from both our study and from that in Donati et al.,[ 33 ] it indicates that hepatic PNPLA3 levels may also be associated with liver fibrosis in patients with more advanced liver disease.[ 35 ]
In a series of studies in mice, it has elegantly been shown that the Pnpla3 148M protein evades ubiquitylation‐mediated degradation and therefore accumulates on lipid droplets in hepatocytes.[ 15 ] In addition, increased hepatic Pnpla3 expression appears to reduce hepatic lipolysis through sequestering of a lipase cofactor, comparative gene identification 58 (Cgi‐58). Enzymatically inactive Pnpla3 148M is still able to bind Cgi‐58 preventing activation of another lipase, adipose triglyceride lipase, on lipid droplets.[ 36 ] Furthermore, Pnpla3 I148M knock‐in mice develop liver steatosis when fed a carbohydrate‐enriched diet,[ 37 , 38 ] and forced overexpression of human PNPLA3 148M in hepatocytes leads to liver steatosis and NAFLD.[ 14 , 39 ] Thus, in experimental studies in mice, Pnpla3 148M accumulates on lipid droplets in hepatocytes and drives the development of liver steatosis. Here, we provide direct evidence that accumulation of PNPLA3 protein in PNPLA3 148M risk allele carriers on lipid droplets in hepatocytes is also associated with liver steatosis in humans.
Hepatic PNPLA3 protein levels were associated with increased steatosis grade, lobular inflammation, hepatocellular ballooning, and fibrosis when merging data from 148M risk allele and nonrisk allele carriers. Despite the limited number of patients, results obtained at follow‐up 2 (28 patients) were consistent with the associations observed 10–12 years earlier (at follow‐up 1). Furthermore, we assessed the interrelationships between PNPLA3 protein levels, 148M genotype, and steatosis grade. Our analysis indicated that increased PNPLA3 protein levels in patients with NAFLD is associated with steatosis and the 148M genotype. At follow‐up 2, too few homozygous risk allele carriers (n = 4) remained to confidently assess these interrelationships or to evaluate the NAFLD progression rate in relation to genotype.
A larger NAFLD cohort would have been required for an evaluation of the full relationship between PNPLA3 levels, PNPLA3 genotype (homozygous risk allele carriers vs. heterozygous risk allele carriers vs. homozygous nonrisk allele carriers), and NAFLD and of the role of increased hepatic PNPLA3 protein levels on NAFLD progression in relation to the PNPLA3 genotype. However, few large, serial, liver biopsy studies from patients with well‐characterized NAFLD have been conducted. Initiatives exemplified by the European NAFLD Registry are currently collecting biopsies from patients with well‐characterized NAFLD across many sites and countries,[ 40 ] building up a large cohort and thereby allowing researchers to undertake more in‐depth investigations of the correlation between PNPLA3 protein expression, genotype, histologic features, and NAFLD progression over time.
In this study, we demonstrated that PNPLA3 in human livers is predominantly located on lipid droplets in hepatocytes and that increased levels is associated with NAFLD. Furthermore, PNPLA3 rs738409 (148M) risk allele carriers have higher hepatic PNPLA3 protein levels than nonrisk allele carriers; this may be part of a pathophysiological mechanism leading to an increased risk for developing NAFLD in these subjects.
AUTHOR CONTRIBUTIONS
Study conception and design: Elke Ericson, Linnéa Bergenholm, Anne‐Christine Andréasson, Björn Carlsson, Mathias Liljeblad, Jane Knöchel, Sara F. Hansson, Stergios Kechagias, Daniel Lindén, Mattias Ekstedt. Acquisition of data: Anne‐Christine Andréasson, Elke Ericson, Carly I. Dix, Richard Lee, Patrik Nasr, Stergios Kechagias, Mattias Ekstedt. Statistical analysis: Linnéa Bergenholm, Elke Ericson, Jane Knöchel, Jennifer Schumi. Analysis and interpretation of data: all authors. Drafting of manuscript: Elke Ericson, Linnéa Bergenholm, Anne‐Christine Andréasson, Patrik Nasr, Mathias Liljeblad, Björn Carlsson, Daniel Lindén, Mattias Ekstedt. Critical revision: all authors. All authors approved the final version of the article, including the authorship list. Mattias Ekstedt is the guarantor of the article.
FUNDING INFORMATION
Region Östergötland ALF‐grants (RÖ962520); AstraZeneca, unrestricted grants; Medical Research Council of Southeast Sweden (FORSS‐311151).
CONFLICTS OF INTEREST
Dr. Ericson, Dr. Carlsson, Dr. Andréasson, Dr. Dix, Dr. Linden, Dr. Knochel, Dr. Schumi, Dr. Bergenholm, Dr. Antonsson, Dr. Liljebad, Dr. Fjellstrom, and Dr. Hansson are employed by and own stock in AstraZeneca. Dr. Ekstedt advises AMRA Medical AB, has received lecture fee from Olink, and received unrestricted grants from Intercept, AstraZeneca, and Gilead. Dr. Lee is employed by Verve and owns stock in Verve and Ionis Pharmaceuticals. Dr. Kechagias has received lecture fees from Gilead, AbbVie, and MSD. Dr. Nasr has nothing to report.
Supporting information
Appendix S1 Supporting Information
Appendix S2 Supporting Information
ACKNOWLEDGMENTS
We thank Giovanni Pellegrini (AstraZeneca) for expert advice on how to evaluate IHC‐stained liver biopsies, David Mead (Isogenica) for approval to use the VHH‐FLAG‐Halo control plasmid, and Kate Wickson (AstraZeneca) for support with internal antibody generation.
Ericson E, Bergenholm L, Andréasson A‐C, Dix CI, Knöchel J, Hansson SF, Hepatic patatin‐like phospholipase domain‐containing 3 levels are increased in I148M risk allele carriers and correlate with NAFLD in humans. Hepatol Commun. 2022;6:2689–2701. 10.1002/hep4.2032
Elke Ericson, Linnéa Bergenholm, and Anne‐Christine Andréasson contributed equally to this work as first authors.
Daniel Lindén and Mattias Ekstedt contributed equally to this work as senior authors.
REFERENCES
Author names in bold designate shared co‐first authorship
- 1. Younossi ZM, Koenig AB, Abdelatif D, Fazel Y, Henry L, Wymer M. Global epidemiology of nonalcoholic fatty liver disease‐meta‐analytic assessment of prevalence, incidence, and outcomes. Hepatology. 2016;64:73–84. [DOI] [PubMed] [Google Scholar]
- 2. Ekstedt M, Nasr P, Kechagias S. Natural History of NAFLD/NASH. Curr Hepatol Rep. 2017;16:391–7. [DOI] [PMC free article] [PubMed] [Google Scholar]
- 3. Hagstrom H, Nasr P, Ekstedt M, Hammar U, Stal P, Hultcrantz R, et al. Fibrosis stage but not NASH predicts mortality and time to development of severe liver disease in biopsy‐proven NAFLD. J Hepatol. 2017;67:1265–73. [DOI] [PubMed] [Google Scholar]
- 4. Taylor RS, Taylor RJ, Bayliss S, Hagstrom H, Nasr P, Schattenberg JM, et al. Association between fibrosis stage and outcomes of patients with nonalcoholic fatty liver disease: a systematic review and meta‐analysis. Gastroenterology. 2020;158:1611–25.e12. [DOI] [PubMed] [Google Scholar]
- 5. Bedossa P, FLIP Pathology Consortium . Utility and appropriateness of the fatty liver inhibition of progression (FLIP) algorithm and steatosis, activity, and fibrosis (SAF) score in the evaluation of biopsies of nonalcoholic fatty liver disease. Hepatology. 2014;60:565–75. [DOI] [PubMed] [Google Scholar]
- 6. Romeo S, Kozlitina J, Xing C, Pertsemlidis A, Cox D, Pennacchio LA, et al. Genetic variation in PNPLA3 confers susceptibility to nonalcoholic fatty liver disease. Nat Genet. 2008;40:1461–5. [DOI] [PMC free article] [PubMed] [Google Scholar]
- 7. Carlsson B, Linden D, Brolen G, Liljeblad M, Bjursell M, Romeo S, et al. Review article: the emerging role of genetics in precision medicine for patients with non‐alcoholic steatohepatitis. Aliment Pharmacol Ther. 2020;51:1305–20. [DOI] [PMC free article] [PubMed] [Google Scholar]
- 8. Romeo S, Sanyal A, Valenti L. Leveraging human genetics to identify potential new treatments for fatty liver disease. Cell Metab. 2020;31:35–45. [DOI] [PubMed] [Google Scholar]
- 9. Stender S, Kozlitina J, Nordestgaard BG, Tybjaerg‐Hansen A, Hobbs HH, Cohen JC. Adiposity amplifies the genetic risk of fatty liver disease conferred by multiple loci. Nat Genet. 2017;49:842–7. [DOI] [PMC free article] [PubMed] [Google Scholar]
- 10. He S, McPhaul C, Li JZ, Garuti R, Kinch L, Grishin NV, et al. A sequence variation (I148M) in PNPLA3 associated with nonalcoholic fatty liver disease disrupts triglyceride hydrolysis. J Biol Chem. 2010;285:6706–15. [DOI] [PMC free article] [PubMed] [Google Scholar]
- 11. Pirazzi C, Valenti L, Motta BM, Pingitore P, Hedfalk K, Mancina RM, et al. PNPLA3 has retinyl‐palmitate lipase activity in human hepatic stellate cells. Hum Mol Genet. 2014;23:4077–85. [DOI] [PMC free article] [PubMed] [Google Scholar]
- 12. Basantani MK, Sitnick MT, Cai L, Brenner DS, Gardner NP, Li JZ, et al. Pnpla3/Adiponutrin deficiency in mice does not contribute to fatty liver disease or metabolic syndrome. J Lipid Res. 2011;52:318–29. [DOI] [PMC free article] [PubMed] [Google Scholar]
- 13. Chen W, Chang B, Li L, Chan L. Patatin‐like phospholipase domain‐containing 3/adiponutrin deficiency in mice is not associated with fatty liver disease. Hepatology. 2010;52:1134–42. Erratum in: Hepatology. 2010;52:2250. [DOI] [PMC free article] [PubMed] [Google Scholar]
- 14. Li JZ, Huang Y, Karaman R, Ivanova PT, Brown HA, Roddy T, et al. Chronic overexpression of PNPLA3I148M in mouse liver causes hepatic steatosis. J Clin Invest. 2012;122:4130–44. [DOI] [PMC free article] [PubMed] [Google Scholar]
- 15. BasuRay S, Smagris E, Cohen JC, Hobbs HH. The PNPLA3 variant associated with fatty liver disease (I148M) accumulates on lipid droplets by evading ubiquitylation. Hepatology. 2017;66:1111–24. [DOI] [PMC free article] [PubMed] [Google Scholar]
- 16. Clark JD, Gebhart GF, Gonder JC, Keeling ME, Kohn DF. Special report: the 1996 Guide for the Care and Use of Laboratory Animals. ILAR J. 1997;38:41–8. [DOI] [PubMed] [Google Scholar]
- 17. Seth PP, Siwkowski A, Allerson CR, Vasquez G, Lee S, Prakash TP, et al. Short antisense oligonucleotides with novel 2′‐4′ conformationaly restricted nucleoside analogues show improved potency without increased toxicity in animals. J Med Chem. 2009;52:10–3. [DOI] [PubMed] [Google Scholar]
- 18. Livak KJ, Schmittgen TD. Analysis of relative gene expression data using real‐time quantitative PCR and the 2(‐delta delta C[T]) method. Methods. 2001;25:402–8. [DOI] [PubMed] [Google Scholar]
- 19. Ekstedt M, Franzen LE, Mathiesen UL, Thorelius L, Holmqvist M, Bodemar G, et al. Long‐term follow‐up of patients with NAFLD and elevated liver enzymes. Hepatology. 2006;44:865–73. [DOI] [PubMed] [Google Scholar]
- 20. Nasr P, Ignatova S, Kechagias S, Ekstedt M. Natural history of nonalcoholic fatty liver disease: a prospective follow‐up study with serial biopsies. Hepatol Commun. 2017;2:199–210. [DOI] [PMC free article] [PubMed] [Google Scholar]
- 21. Negoita F, Blomdahl J, Wasserstrom S, Winberg ME, Osmark P, Larsson S, et al. PNPLA3 variant M148 causes resistance to starvation‐mediated lipid droplet autophagy in human hepatocytes. J Cell Biochem. 2019;120:343–56. [DOI] [PubMed] [Google Scholar]
- 22. Brunt EM, Janney CG, Di Bisceglie AM, Neuschwander‐Tetri BA, Bacon BR. Nonalcoholic steatohepatitis: a proposal for grading and staging the histological lesions. Am J Gastroenterol. 1999;94:2467–74. [DOI] [PubMed] [Google Scholar]
- 23. Kleiner DE, Brunt EM, Van Natta M, Behling C, Contos MJ, Cummings OW, et al. Design and validation of a histological scoring system for nonalcoholic fatty liver disease. Hepatology. 2005;41:1313–21. [DOI] [PubMed] [Google Scholar]
- 24. Franzen LE, Ekstedt M, Kechagias S, Bodin L. Semiquantitative evaluation overestimates the degree of steatosis in liver biopsies: a comparison to stereological point counting. Mod Pathol. 2005;18:912–6. [DOI] [PubMed] [Google Scholar]
- 25. Listenberger LL, Ostermeyer‐Fay AG, Goldberg EB, Brown WJ, Brown DA. Adipocyte differentiation‐related protein reduces the lipid droplet association of adipose triglyceride lipase and slows triacylglycerol turnover. J Lipid Res. 2007;48:2751–61. [DOI] [PubMed] [Google Scholar]
- 26. Dongiovanni P, Stender S, Pietrelli A, Mancina RM, Cespiati A, Petta S, et al. Causal relationship of hepatic fat with liver damage and insulin resistance in nonalcoholic fatty liver. J Intern Med. 2018;283:356–70. [DOI] [PMC free article] [PubMed] [Google Scholar]
- 27. BasuRay S, Wang Y, Smagris E, Cohen JC, Hobbs HH. Accumulation of PNPLA3 on lipid droplets is the basis of associated hepatic steatosis. Proc Natl Acad Sci U S A. 2019;116:9521–6. [DOI] [PMC free article] [PubMed] [Google Scholar]
- 28. Valenti L, Al‐Serri A, Daly AK, Galmozzi E, Rametta R, Dongiovanni P, et al. Homozygosity for the patatin‐like phospholipase‐3/adiponutrin I148M polymorphism influences liver fibrosis in patients with nonalcoholic fatty liver disease. Hepatology. 2010;51:1209–17. [DOI] [PubMed] [Google Scholar]
- 29. Hotta K, Yoneda M, Hyogo H, Ochi H, Mizusawa S, Ueno T, et al. Association of the rs738409 polymorphism in PNPLA3 with liver damage and the development of nonalcoholic fatty liver disease. BMC Med Genet. 2010;11:172. [DOI] [PMC free article] [PubMed] [Google Scholar]
- 30. Rotman Y, Koh C, Zmuda JM, Kleiner DE, Liang TJ, NASH CRN . The association of genetic variability in patatin‐like phospholipase domain‐containing protein 3 (PNPLA3) with histological severity of nonalcoholic fatty liver disease. Hepatology. 2010;52:894–903. [DOI] [PMC free article] [PubMed] [Google Scholar]
- 31. Zain SM, Mohamed R, Mahadeva S, Cheah PL, Rampal S, Basu RC, et al. A multi‐ethnic study of a PNPLA3 gene variant and its association with disease severity in non‐alcoholic fatty liver disease. Hum Genet. 2012;131:1145–52. [DOI] [PMC free article] [PubMed] [Google Scholar]
- 32. Liu YL, Patman GL, Leathart JB, Piguet AC, Burt AD, Dufour JF, et al. Carriage of the PNPLA3 rs738409 C>G polymorphism confers an increased risk of non‐alcoholic fatty liver disease associated hepatocellular carcinoma. J Hepatol. 2014;61:75–81. [DOI] [PubMed] [Google Scholar]
- 33. Donati B, Motta BM, Pingitore P, Meroni M, Pietrelli A, Alisi A, et al. The rs2294918 E434K variant modulates patatin‐like phospholipase domain‐containing 3 expression and liver damage. Hepatology. 2016;63:787–98. [DOI] [PubMed] [Google Scholar]
- 34. Ferri F, Carotti S, Carpino G, Mischitelli M, Cantafora A, Molinaro A, et al. The propensity of the human liver to form large lipid droplets is associated with PNPLA3 polymorphism, reduced INSIG1 and NPC1L1 expression and increased fibrogenetic capacity. Int J Mol Sci. 2021;22:6100. [DOI] [PMC free article] [PubMed] [Google Scholar]
- 35. Bruschi FV, Tardelli M, Herac M, Claudel T, Trauner M. Metabolic regulation of hepatic PNPLA3 expression and severity of liver fibrosis in patients with NASH. Liver Int. 2020;40:1098–110. [DOI] [PMC free article] [PubMed] [Google Scholar]
- 36. Wang Y, Kory N, BasuRay S, Cohen JC, Hobbs HH. PNPLA3, CGI‐58, and inhibition of hepatic triglyceride hydrolysis in mice. Hepatology. 2019;69:2427–41. [DOI] [PMC free article] [PubMed] [Google Scholar]
- 37. Smagris E, BasuRay S, Li J, Huang Y, Lai KM, Gromada J, et al. Pnpla3I148M knockin mice accumulate PNPLA3 on lipid droplets and develop hepatic steatosis. Hepatology. 2015;61:108–18. [DOI] [PMC free article] [PubMed] [Google Scholar]
- 38. Linden D, Ahnmark A, Pingitore P, Ciociola E, Ahlstedt I, Andreasson AC, et al. Pnpla3 silencing with antisense oligonucleotides ameliorates nonalcoholic steatohepatitis and fibrosis in Pnpla3 I148M knock‐in mice. Mol Metab. 2019;22:49–61. [DOI] [PMC free article] [PubMed] [Google Scholar]
- 39. Banini BA, Kumar DP, Cazanave S, Seneshaw M, Mirshahi F, Santhekadur PK, et al. Identification of a metabolic, transcriptomic, and molecular signature of patatin‐like phospholipase domain containing 3‐mediated acceleration of steatohepatitis. Hepatology. 2021;73:1290–306. [DOI] [PMC free article] [PubMed] [Google Scholar]
- 40. Hardy T, Wonders K, Younes R, Aithal GP, Aller R, Allison M, et al. The European NAFLD Registry: a real‐world longitudinal cohort study of nonalcoholic fatty liver disease. Contemp Clin Trials. 2020;98:106175. [DOI] [PubMed] [Google Scholar]
Associated Data
This section collects any data citations, data availability statements, or supplementary materials included in this article.
Supplementary Materials
Appendix S1 Supporting Information
Appendix S2 Supporting Information