Abstract
Fibrolamellar hepatocellular carcinoma (FLC) is a disease that occurs in children and young adults. The development of FLC is associated with creation of a fusion oncoprotein DNAJB1‐PKAc kinase, which activates multiple cancer‐associated pathways. The aim of this study was to examine the role of human genomic regions, called cancer‐enhancing genomic regions or aggressive liver cancer domains (CEGRs/ALCDs), in the development of FLC. Previous studies revealed that CEGRs/ALCDs are located in multiple oncogenes and cancer‐associated genes, regularly silenced in normal tissues. Using the regulatory element locus intersection (RELI) algorithm, we searched a large compendium of chromatin immunoprecipitation–sequencing (ChIP) data sets and found that CEGRs/ALCDs contain regulatory elements in several human cancers outside of pediatric hepatic neoplasms. The RELI algorithm further identified components of the β‐catenin–TCF7L2/TCF4 pathway, which interacts with CEGRs/ALCDs in several human cancers. Particularly, the RELI algorithm found interactions of transcription factors and chromatin remodelers with many genes that are activated in patients with FLC. We found that these FLC‐specific genes contain CEGRs/ALCDs, and that the driver of FLC, fusion oncoprotein DNAJB1‐PKAc, phosphorylates β‐catenin at Ser675, resulting in an increase of β‐catenin–TCF7L2/TCF4 complexes. These complexes increase a large family of CEGR/ALCD‐dependent collagens and oncogenes. The DNAJB1‐PKAc–β‐catenin–CEGR/ALCD pathway is preserved in lung metastasis. The inhibition of β‐catenin in FLC organoids inhibited the expression of CEGRs/ALCDs‐dependent collagens and oncogenes, preventing the formation of the organoid's structure. Conclusion: This study provides a rationale for the development of β‐catenin‐based therapy for patients with FLC.
A fusion protein kinase DNAJB1‐PKAc is the main driver of adolescent liver cancer fibrolamellar HCC. Our paper presents molecular mechanisms by which this kinase causes FLC. We also provide evidence that the inhibition of DNAJB1‐PKAc‐beta catenin pathway could be considered as a therapy for FLC.

INTRODUCTION
Fibrolamellar hepatocellular carcinoma (FLC) is a rare, but dangerous disease without a cure for unresectable or metastatic disease.[ 1 , 2 ] Compared with hepatoblastoma (HBL) and other hepatocellular carcinomas (HCCs), most FLC cases are characterized by a homogenous mutation involving the deletion of a 400‐kb region that leads to the creation of a fusion oncoprotein DNAJB1‐PRKACA (further called DNAJB1‐PKAc).[ 3 , 4 , 5 ] Generation of mouse models with the expression of DNAJB1‐PKAc demonstrated that the fusion DNAJB1‐PKAc kinase is the main driver of the disease.[ 5 , 6 ] Our Liver Tumor Program at Cincinnati Children's Hospital Medical Center (CCHMC) investigates the pediatric and adolescent liver cancers HBL and FLC. A substantial number of patients with HBL experience metastases and are faced with aggressive tumors that are characterized by multiple nodules at diagnosis, metastases, vascular invasion, chemo‐resistance, and relapse.[ 7 , 8 ] Several studies of genomic mutations in patients with HBL revealed that HBL is a genomically simple disease with an average 1.9% mutations most commonly in four genes: CTNNB1 (β‐catenin), nuclear factor, erythroid 2‐like 2 (NFE2L2)/nuclear erythroid 2 p45‐related factor 2 (NRF2), AT‐rich interaction domain 1A, and in the promoter of the Telomerase Reverse Transcriptase gene.[ 9 , 10 , 11 ] Studies of the CTNNB1 and NFE2L2/NRF2 mutations demonstrated their significant roles in the development of HBL[ 11 , 12 , 13 ]; however, it becomes clear that aggressive HBL carries additional carcinogenic alterations that activate additional cancer‐promoting pathways. We recently identified short chromosomal regions (cancer‐enhancing genomic regions or aggressive liver cancer domains [CEGRs/ALCDs]) that are located within over 200 oncogenes and that drive their expression.[ 14 , 15 , 16 , 17 , 18 ] In addition, we identified a mutations‐unrelated pathway of aggressive HBL that is associated with post‐translational modifications of tumor‐suppressor proteins C/EBPα (CCAAT/enhancer binding protein α), CUG‐repeat binding protein 1, and p53, converting these proteins into oncogenes.[ 7 , 16 , 18 ]
We have applied our knowledge of mutation‐independent molecular pathways of HBL to the study of molecular mechanisms of adolescent and young adult cancer FLC. Examination of a large data set of chromatin immunoprecipitation–sequencing (ChIP‐seq) results revealed that CEGRs/ALCDs containing genes are bound to transcription factor TCF7L2/TCF4 (further called TCF4), and that many CEGRs/ALCDs containing genes are activated in patients with FLC. We found that the fusion oncoprotein DNAJB1‐PKAc displays its oncogenic activities via phosphorylation of β‐catenin, and that this phosphorylation increases interactions of β‐catenin with TCF4 and with chromatin remodeling protein p300.
METHODS
Clinical and histological data on patients with FLC
This study was approved by the Institutional Review Board at CCHMC. Informed consent was obtained from each study patient (or parent as indicated) before obtaining specimens.
Immunohistochemistry
Liver and tumor sections from patients with FLC were fixed in 4% paraformaldehyde, embedded in paraffin, and sectioned (7‐μm sections). Immunohistochemistry for PKAc, ph‐S675‐β‐catenin, ki67, and post‐GPI attachment to proteins (PGAP1) was performed on FLC samples from primary liver tumors and lung metastasis.
List of antibodies used in this study: ph‐S675‐β‐catenin (Cell Signaling Tech; #D2F1),TCF4 (Cell Signaling; #C48H11), p300 (Invitrogen; sc: PAI‐848), Col3A1 (Cell Signaling Tech; #30565), secreted protein acidic and cysteine rich (SPARC) (Abcam; ab203284), Thy1 (Santa Cruz; sc: H‐110), versican (VCAN) (Invitrogen; MA5‐34654), HDAC1 (EDM Millipore Corp.; 2E10), DNAJB1 (Abcam; ab69402), E2F1 (Santa Cruz; sc:C20), p21 (Santa Cruz; sc: F5), PGAP1 (Invitrogen; sc‐PA5 72,340), RUN domain‐containing 1 (RUNDC1) (Abcam; sc‐AB 151583), HECT‐type E3 ubiquitin transferase (HACE1) (Abcam; sc‐133,637), cyclin D1 (Santa Cruz; sc‐753), cdc2 (Santa Cruz; sc‐954), CYP3A4 (Santa Cruz; sc‐30,621), β‐actin (Sigma; A5316), ph‐Ser33/37/Thr41‐β‐catenin (Cell Signaling; #8561), and ph‐Tyr333‐β‐catenin (Bioss; #12856R‐CY3).
Real‐time quantitative reverse‐transcription polymerase chain reaction
Total RNA was isolated from human livers. The complementary DNA (cDNA) was synthesized with 2 μg of total RNA using a High‐Capacity cDNA Reverse Transcription Kit (Applied Biosystems). cDNA was used for real‐time quantitative polymerase chain reaction (PCR) assays with the TaqMan Gene Expression system (Applied Biosystems). Gene‐expression analysis was performed using the TaqMan Universal PCR Master Mix (Applied Biosystems). Levels of messenger RNAs (mRNAs) were normalized to 18S ribosomal RNA. For the detection of the fusion DNAJB1‐PKAc transcript, primers to the N‐terminal part of DNAJB1 and primers to the C‐terminal part of PKAc were used. The sequences of these primers are published elsewhere.[ 10 , 15 ]
Protein isolation, western blotting, co‐immunoprecipitation
Nuclear and cytoplasmic extracts were prepared as described in our previous work.[ 16 , 18 ] Cytoplasmic and nuclear extracts (50 μg) were loaded onto 4%–20% gradient gels (Bio‐Rad) and transferred to nitrocellulose membranes (Bio‐Rad). Co‐immunoprecipitations (co‐IPs) were performed using an improved TrueBlot protocol previously described.[ 15 ]
Regulatory element locus intersection algorithm
This software has been previously developed and has been used in several studies.[ 19 ] We analyzed 33 CEGRs/ALCDs from oncogenes that are activated in HBL.[ 16 , 18 ] Briefly, we used regulatory element locus intersection (RELI) to intersect these 33 regions with a database of over 11,000 ChIP‐seq experiments, and gauged the significance of the intersection count for each of these data sets. Results of the RELI algorithm were validated by ChIP assay, which is shown throughout the manuscript.
Luciferase reporter assay
Luciferase reporter assays were performed using the Pierce Renilla Luciferase Flash assay Kit (Thermo Fisher; #16164) according to manufacturer's instructions.
RNA‐sequencing analysis of FLC organoids
Floating aggregates of FLC cells, referred to as FLC organoids, were prepared and cultured as described previously[ 20 ] from the xenografts established using the patient‐derived FLC tumor line transplanted in 3‐month‐old female NOD‐scid IL2Rgammanull mice (Jackson Laboratory) and were incubated in Kubota's Media (PhoenixSongs Biologicals) supplemented with 5 μm PRI‐724 (β‐catenin inhibitor; Selleck Chemicals) or DMSO for 24, 48, or 96 h. The protocol was approved by the Institutional Animal Care and Use Committee at CCHMC. Total RNA was extracted from FLC organoids using the ReliaPrep RNA Tissue Miniprep System (Promega). Poly‐A selected RNA was reverse‐transcribed using the Illumina TruSeq stranded mRNA library preparation kit and sequenced using Illumina NovaSeq 6000 (paired‐end 100 bp). Raw reads were aligned with the reference genome (GRCh38) using HISAT2,[ 21 ] and transcript/gene abundance was determined using Kallisto with annotations provided by University of California Santa Cruz using default parameters settings.[ 22 ] All detected transcripts were tested for differential expression using a moderated t test with a cutoff false discovery rate < 0.05. Fusion transcripts identified in each sample using FusionCatcher[ 23 ] along with regular transcripts were used to build an index in Kallisto.[ 22 ] Differential transcript expressions were assessed with the R package DESeq2.[ 24 ]
RNA‐sequencing analysis of tissues from patients with FLC
Frozen tumors from patients with FLC and autopsy/donor livers from subjects without liver disease were obtained from two sources: archived specimens from the Discover Together Biobank and surgical specimens from CCHMC. Total RNA was extracted using RiboZol (VWR), processed using TruSeq Stranded Total RNA with Ribo‐Zero Library Prep (Illumina), and sequenced using NovaSeq6000 S4 (Illumina; paired‐end 150 bp). Analyses were performed on two paired‐end samples using raw (>15 Gb) and trimmed data (>12 Gb), and the Q30 percentages of raw and trimmed data were >90% and >95%, respectively. Trimmed reads were mapped to the reference genome (hg19) with HISAT2,[ 21 ] resulting in >76% mapping ratio, and transcripts were assembled by StringTie.[ 25 ] The detected transcripts were tested for differential expression between FLC and control samples using a moderated t test with a significance cutoff false discovery rate < 0.05.
Pull‐down assay
Biotinylated DNA oligomer containing the TCF4 binding site from CEGRs/ALCDs was linked to streptavidin beads and incubated with protein extracts isolated from adjacent (background) and tumor regions of FLC for 4 h in a buffer containing 10 mm Tris–HCL (ph 7.5), 100 mm NaCl, 5 mm β‐mercaptoethanol, and 10% glycerol. The beads were washed 3 times with the buffer; proteins were eluted by 2% sodium dodecyl sulfate in a sample buffer and examined by western blot with antibodies to β‐catenin, TCF4, p300 and PKAc, as described previously.
ChIP assay
ChIP assays were performed as described previously.[ 15 , 16 , 17 ] Primers for β‐catenin, HDAC1, and NRF2 ALCDs can be found in our previous studies.[ 15 , 18 ]
Locations of ALCDs within corresponding genes
For gene‐specific locations, ALCD sequences were compared against the Homo sapiens GRCh 38 genome build using the BLAST‐Like Alignment Tool (BLAT). BLAT analysis was performed using the Ensembl genome browser as described.[ 15 , 16 ]
Statistical analysis
All values are presented as means ± SEM. An unpaired Student's t test was applied for the comparison of normally distributed data sets. Two‐way analysis of variance was used with a Bonferroni test for multiple comparisons between different time points if the p‐value was < 0.05. Statistical significance was defined as *p < 0.05, **p < 0.01, ***p < 0.001, and ****p < 0.0001. All statistical analysis was done using GraphPad Prism 6.0.
RESULTS
Identification of active CEGRs/ALCDs in several human cancers
In the course of studies of aggressive HBL, we identified CEGRs/ALCDs as regions of DNA that are located in genes of oncogenes and are open for transcription, leading to a dramatic overexpression of many oncoproteins.[ 15 , 18 ] We have shown that in most genes, CEGRs/ALCDs are located in introns, and that they are working as enhancers by opening DNA for transcription.[ 16 , 18 ] Figure 1A shows an example of the CEGR/ALCD in the NRF2 gene. The CEGRs/ALCDs are short, highly homological DNA regions that have several 100% homology regions shown as yellow, blue, brown, red, and green boxes (Figure 1A). In healthy livers and in background (adjacent to tumor) regions of patients with HBL, the CEGRs/ALCDs are repressed; however, in tumors of aggressive HBL, CEGRs/ALCDs are open and the CEGR/ALCD‐containing oncogenes are transcribed (Figure 1B). To examine the overall significance of these DNA regions in cancers, we applied an unbiased computational analysis, the RELI algorithm, which systematically examines enrichment for overlap with a large collection of ChIP‐seq data sets.[ 19 ] Application of RELI to the 33 CEGR/ALDC‐dependent cancer genes and a library of over 11,000 human ChIP‐seq data sets showed that CEGRs/ALCDs, which are activated in aggressive HBL,[ 15 , 16 , 17 , 18 ] are also open and likely transcribed by RNA Pol II in other human cancers including HCC, FLC, acute myeloid leukemia, colon cancer, breast cancer, lung cancer, and colorectal cancer (Figures 1C and 2A). A large number of oncoproteins and chromatin remodeling proteins interacting with CEGRs/ALCDs were found in this analysis, including c‐myc, DDX5, RUNX1, p300, and many others (Figure 1D). Many ChIP‐seq data sets overlapped 10–15 CEGRs/ALCDs, which are located in oncogenes and transcribed in human cancers. Importantly, a key partner of β‐catenin, TCF4 (encoded by TCF7L2), was found as a protein that often binds to CEGRs/ALCDs in human cancers. Additional information for results of the RELI algorithm can be found in Table S1. Because the identified transcription factors and chromatin remodeling proteins bind to CEGRs/ALCDs in many cancers, we suggest that they maintain open chromatin regions around CEGRs/ALCDs and enhance the transcription of oncogenes, leading to the development of cancers (Figure 1E). Identification of TCF7L2/TCF4 by the RELI algorithm provided unbiased results and rationale for investigations of the role of β‐catenin‐TCF4 in activation of CEGRs/ALCDs‐dependent oncogenes, and in the development of liver cancers, including FLC.
FIGURE 1.
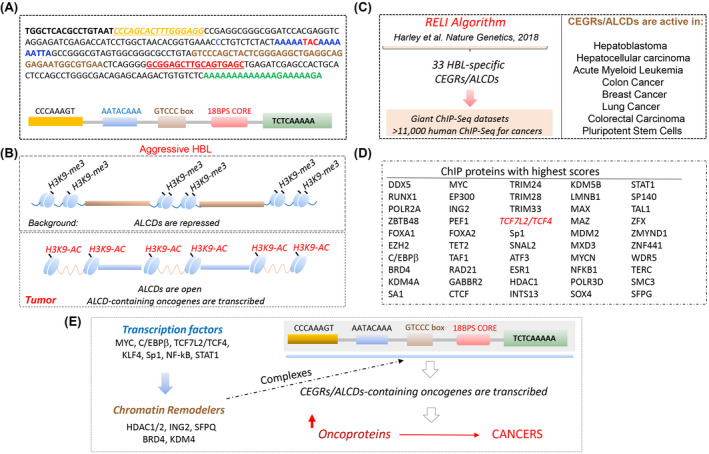
Summary of regulatory element locus intersection (RELI) algorithm search for cancer‐enhancing genomic region or aggressive liver cancer domain (CEGR/ALCD) sequences in a large collection of chromatin immunoprecipitation–sequencing (ChIP‐seq) data sets. (A) Example of CEGR/ALCD from the nuclear erythroid 2 p45‐related factor 2 (NRF2) gene used for the search and RELI algorithm strategy. Colors show 100% homological regions. Bottom part shows the schematic locations of these sequences within each CEGR/ALCD. (B) Diagram summarizing previous publications. (C) Diagram showing a strategy for the RELI algorithm. Right image shows the list of human cancers with activated CEGRs/ALCDs. (D) List of proteins that pulled down CEGRs/ALCDs with high scores. These proteins are detected in several cancers, and pulled down more than five CEGRs/ALCDs. (E) The RELI algorithm–based hypothesis for the activation of CEGR/ALCD‐dependent oncogenes in human cancers. HBL, hepatoblastoma.
FIGURE 2.
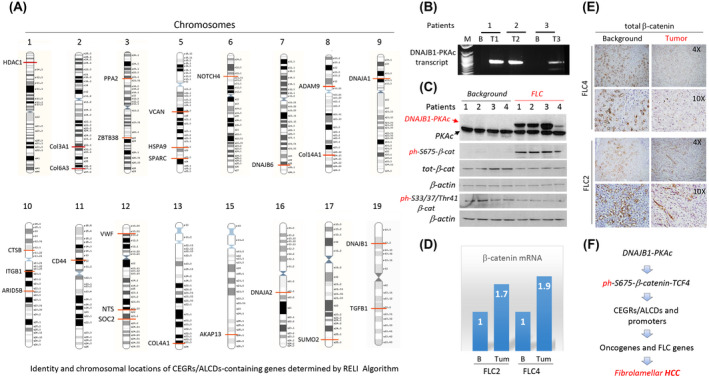
Experimental data that provide a rationale for the studies of the DNAJB1‐PKAc‐β‐catenin‐TCF4 axis as the main cause of fibrolamellar hepatocellular carcinoma (FLC). (A) Identity of genes detected by RELI algorithm and their locations on human chromosomes. (B) Identification of the fusion DNAJB1‐PKAc transcript in patients with FLC. (C) Western blot shows expression of DNAJB1‐PKAc, total levels of β‐catenin, and levels of phosphorylated forms of β‐catenin. Antibodies (Abs) to total β‐catenin, ph‐Ser675‐β‐catenin, and ph‐Ser33/37/Thr41‐β‐catenin were used. β‐actin served as a loading control. (D) Expression of β‐catenin messenger RNA (mRNA) in patients with FLC2 and FLC4 was determined by quantitative real‐time polymerase chain reaction (PCR). (E) Staining of background and tumor sections with Abs to total β‐catenin. (D) Hypothesis for the role of the DNAJB1‐PKAc‐ph‐S675‐β‐catenin‐TCF4‐CEGRs/ALCDs axis in FLC. HCC, hepatocellular carcinoma.
β‐catenin is phosphorylated at Ser675 in patients with FLC
Looking for chromosomal locations of genes that were determined in the analyses of a gigantic data set by RELI algorithm, we found that many of them are activated in patients with FLC (Figure 2A). These genes include a number of collagens, DNAJB1, DNAJA1, CD44, VCAN and SPARC, and several transcription factors. The cause of FLC is a deletion of a 400‐kb DNA region in one copy and subsequent creation of a fusion oncoprotein DNAJB1‐PKAc kinase.[ 5 , 6 ] A previous study suggested that the cancer‐promotion activities of DNAJB1‐PKAc might be associated with DNAJB1‐PKAc‐dependent phosphorylation of β‐catenin at Ser675.[ 6 ] To test this suggestion, we initially examined specimens from 4 patients with FLC, the amounts of which were sufficient for biochemical analyses. Quantitative real‐time PCR and western blotting revealed that the fusion kinase DNAJB1‐PKAc was observed in all examined patients with FLC (Figure 2B,C). We next investigated levels of total β‐catenin and its post‐translational modifications. We found that specimens from patients with FLC have a complex pattern of β‐catenin expression. Quantitative real‐time PCR approach showed a 1.7–1.9‐fold elevation of β‐catenin mRNA in the tumor section of patients with FLC compared to the background (Figure 2D). This increase is in agreement with data obtained in further RNA‐seq studies (Figure 5). However, western blot and immunostaining with Abs to total protein showed a slight reduction of total levels of β‐catenin (Figure 2C,E). In contrast, the ph‐S675‐β‐catenin protein was dramatically elevated in tumor sections of patients with FLC (Figure 2C). Given the differences between β‐catenin mRNA and β‐catenin protein, we tested the phosphorylation of Ser33/37/Thr41 residues of β‐catenin, as they are involved in GSK3β‐dependent regulation of the stability of β‐catenin protein.[ 13 ] We did not observe significant differences in the levels of ph‐Ser33/37/Thr41‐β‐catenin between background and tumor sections of patients with FLC (Figure 2C). Western blot with antibodies to another site of phosphorylation Tyr333 did not detect this modification of β‐catenin in background and tumor sections of patients with FLC (data not shown). Taken together, we found that the main alteration of β‐catenin in patients with FLC is a dramatic increase in phosphorylation of β‐catenin at Ser675. Thus, these initial studies suggested that DNAJB1‐PKAc specifically phosphorylates β‐catenin at Ser675 in patients with FLC. Based on these observations, we hypothesized that the DNAJB1‐PKAc‐β‐catenin pathway might activate oncogenes through CEGR/ALCD‐dependent mechanisms (Figure 2F).
FIGURE 5.
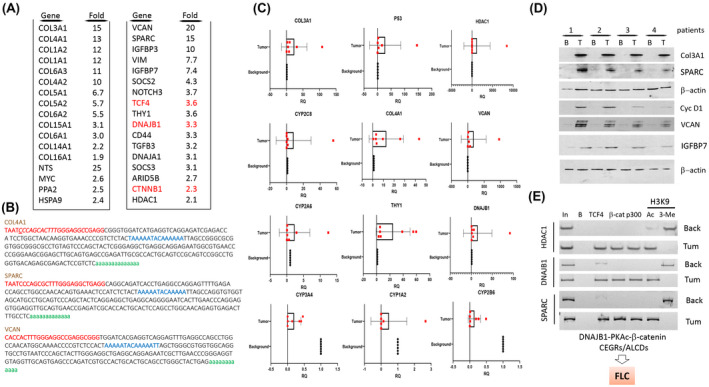
Identification of CEGR/ALCD‐containing genes that are elevated in patients with FLC. (A) RNA‐sequencing (RNA‐seq) results for patients with FLC who have elevated DNAJB1‐PKAc‐β‐catenin‐CEGRs/ALCDs pathways. Red colors show mRNAs coding for components of the DNAJB1‐PKAc‐β‐catenin‐TCF4 axis. (B) Sequences of CEGRs/ALCDs in the COL4A1, SPARC, and VCAN genes. (C) Confirmation of RNA‐seq results by quantitative real‐time PCR. (D) Expression of up‐regulated proteins detected by western blotting. (E) ChIP assay performed with CEGRs/ALCDs for HDAC1, DNAJB1, and SPARC genes.
Immunological studies showed that β‐catenin is phosphorylated at Ser675 in a large cohort of patients with FLC
To test our hypothesis, we examined available liver samples of 9 patients with FLC and a lung metastasis sample of 1 patient with FLC. Examination of the pathology of these samples showed positive staining for fibrosis (sirius red staining) and high rate of proliferation (Ki67 staining) in patients with FLC (Figure 3A). Immunostaining of FLC samples with PKAc antibodies showed that tumor sections of patients with FLC have much stronger staining than background regions (Figure 3B). In tumor sections of the livers, DNAJB1‐PKAc is detected in both the cytoplasm and the nucleus (Figure 3C). Staining of livers from 9 patients with FLC with ph‐S675‐β‐catenin antibodies showed a dramatic increase of ph‐S675‐β‐catenin, distributed in both the cytoplasm and the nucleus (Figure 3D; 6 cases with FLC are shown). Interestingly, we identified a patient with FLC who had an increase of phosphorylated β‐catenin primarily in the nuclei and observed that this patient has abundant mitotic figures in ph‐S675‐β‐catenin positive cells (Figure 3E). Molecular analyses showed that tumor sections have high levels of the DNAJB1‐PKAc fusion kinase, ph‐S675‐β‐catenin, and abundant β‐catenin‐TCF4 complexes (Figure 3F). These results show the activation of the DNAJB1‐PKAc‐ph‐S675‐β‐catenin pathway in this patient with FLC.
FIGURE 3.
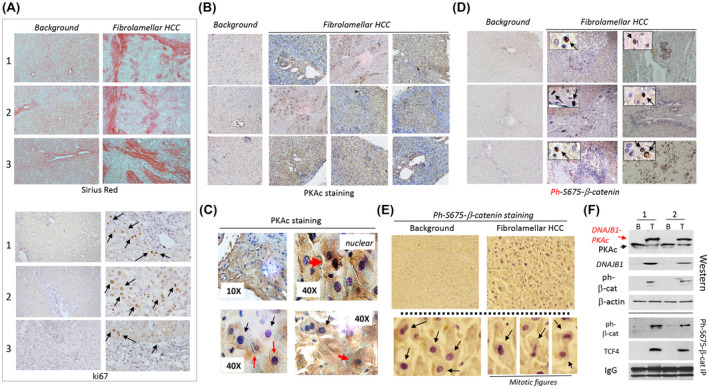
DNAJB1‐PKAc‐ph‐S675‐β‐catenin pathway is active in patients with FLC. (A) Sirius red staining and ki67 staining of background and tumor sections of patients with FLC. (B) Immunostaining of FLC livers with antibodies to PKAc. (C) High‐magnification images show PKAc‐positive cells with nuclear (red arrows) and cytoplasmic signals (black arrows). (D) Immunostaining of background and tumor sections of FLC livers with antibodies to ph‐S675‐β‐catenin. Internal images: Cells with positive nuclear staining for ph‐S675‐β‐catenin. (E) An example of ph‐S675‐β‐catenin staining of a patient's sample that had predominantly nuclear localization of the ph‐S675‐β‐catenin. Bottom: Nuclear localization of ph‐S675‐β‐catenin and mitotic figures observed in ph‐S675‐β‐catenin positive cells. (F) Western blotting and Co‐IP analyses of background (B) and tumor (T) sections of the patient with FLC. IgGs are signals of immunoglobulins G observed in Co‐IP studies. Two repeats of western blot and Co‐IP are shown.
DNAJB1‐PKAc interacts with and phosphorylates β‐catenin at Ser675 in patients with FLC, leading to the formation of β‐catenin‐TCF4‐p300 complexes
We next investigated the expression of known CEGR/ALCD‐dependent genes PGAP1, HACE1, and RUNDC1. Immunostaining of PGAP1 and ph‐S675‐β‐catenin showed almost complete co‐localization of these proteins in background and tumor regions (Figure 4A). However, tumor sections have much higher number of cells with positive signals for these two proteins. Western blotting confirmed that PGAP1, HACE1, and RUNDC1 are elevated in tumor tissues of patients with FLC (Figure 4B). Consistent with data in Figure 2B,C, DNAJB1‐PKAc and ph‐S675‐β‐catenin were elevated in tumor sections of these patients with FLC. Interestingly, TCF4 also showed an elevation in patients with FLC, while p300 was slightly varied between samples (Figure 4C). The increase of TCF4 protein is in agreement with results obtained in further studies showing an increase of TCF4 mRNA and the presence of CEGR/ALCD in the TCF4 gene (Figures 5A and 8E). Co‐IP studies revealed that TCF4 and p300 form complexes with phosphorylated β‐catenin (Figure 4D) and that these complexes bind to the TCF4 binding site in vitro (Figure 4E). ChIP assay found that the ph‐S675‐β‐catenin‐TCF4‐p300 complexes are bound to the CEGRs/ALCDs of HACE1, PGAP1, and RUNDC1 genes in tumor sections of FLC patients (Figure 4F). Thus, these studies showed that the DNAJB1‐PKAc‐β‐catenin‐TCF4‐CEGRs/ALCDs pathway operates in liver tumors of patients with FLC.
FIGURE 4.
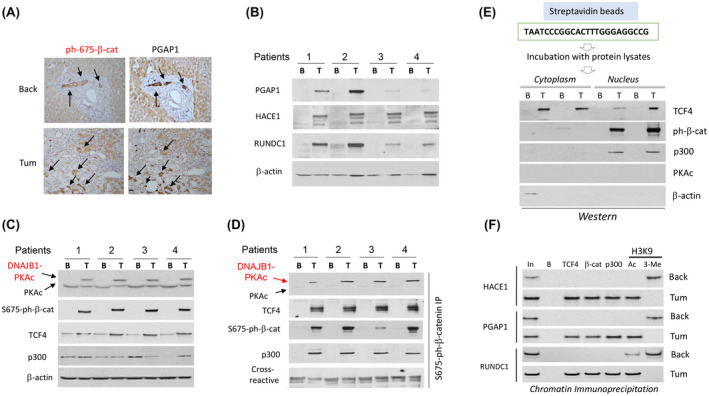
DNAJB1‐PKAc‐ph‐S675‐β‐catenin pathway activates expression of CEGR/ALCD‐containing genes in patients with FLC. (A) Immunostaining of the same areas of the liver with antibodies to ph‐S675‐β‐catenin and PGAP1. Arrows show co‐localizations of staining. (B) Western blotting shows an increase of expression of post GPI attachment to proteins 1 (PGAP1), HACE1, and RUNDC1 in tumor sections of patients with FLC. (C) Western blotting shows expression of the components of ph‐S675‐β‐catenin‐TCF4‐p300 complexes. (D) Co‐IP studies. ph‐S675‐β‐catenin was immunoprecipitated, and PKAc, TCF4, p300, and ph‐S675‐β‐catenin were detected by western blot. € Pull‐down assay. Cytoplasmic and nuclear extracts from FLC samples were incubated with streptavidin‐linked TCF4 oligomer, and the interacting proteins were examined by western blot. β‐actin is a negative control. (F) ChIP assay with CEGRs/ALCDs from three oncogenes shown on the left.
FIGURE 8.
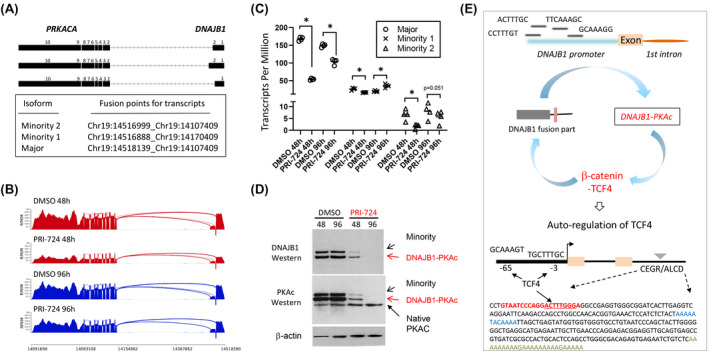
The reduction of DNAJB1‐PKAc by inhibition of β‐catenin identified an auto‐regulatory loop that supports high levels of the fusion oncoprotein in patients with FLC. (A) Diagram showing fusion points for DNAJB1‐PKAc isoforms detected in FLC organoids. (B,C) Reduction of transcripts of DNAJB1‐PKAc isoforms in FLC organoids, treated with PRI‐724 (5 μm, n = 4/group; *adjusted p < 0.05). (D) Western blotting of proteins from FLC organoids with antibodies to the N‐Terminal part of DNAJB1 and the C‐terminal part of PKAc. (E) Hypothesis for auto‐regulatory loop. Bottom image shows an additional part of the loop, in which DNAJB1‐PKAc‐β‐catenin‐TCF4 increases levels of TCF4. A sequence of the CEGR/ALCD in the TCF4 gene is shown.
RNA‐sequencing identifies CEGR/ALCD‐containing genes that are elevated in patients with FLC
Although previous reports provide RNA‐sequencing (RNA‐seq) results of FLC using adjacent non‐tumorous livers from the same patients as controls,[ 26 ] we performed RNA‐seq analyses using no liver disease controls from autopsy or donor livers. Gene‐expression profiling was performed using FLC tumor tissues from 3 patients and 4 control livers, and one FLC sample was excluded as an outlier. Our results indicate the activation of the DNAJB1‐PKAc‐β‐catenin‐CEGRs/ALCDs pathway in FLC (Table S2). We detected an increase of many collagens and other FLC‐related and cancer‐related genes such as NTS, VCAN, SPARC, CTNNB1 and CD44, and transcription factors TCF4, c‐myc, and stem cell marker Thy1 (Figure 5A). The search for the presence of CEGRs/ALCDs within genes up‐regulated in patients with FLC found 51 genes with CEGRs/ALCDs that have not been previously identified in our HBL studies. Most of these genes are shown in Figure 5A. The remaining portion are found in Table S2. In searching for locations of CEGRs/ALCDs in these identified genes, we found that most of the FLC‐specific CEGRs/ALCDs are located in introns of the corresponding genes. Figure 5B shows sequences of CEGRs/ALCDs in genes collagen type IV aplha 1 chain (COL4A1), SPARC, and VCAN (CEGR/ALCD in TCF4 gene is shown in Figure 8E). Interestingly, the FLC‐specific mRNAs included the components of the DNAJB1‐PKAc‐β‐catenin‐TCF4 axis (Figure 5A, shown in red). Quantitative real‐time PCR and western blot confirmed the increased expression of mRNAs and proteins of several genes in patients with FLC compared to paired background livers (Figure 5C,D). We next examined the status of CEGRs/ALCDs in HDAC1, DNAJB1, and SPARC genes. HDAC1 and DNAJB1 were selected for these studies because the sequences of DNAJB1 and HDAC1 CEGRs/ALCDs were found in β‐catenin ChIP‐seq data from colon cancer cells.[ 27 ] ChIP assays showed that β‐catenin‐TCF4‐p300 complexes occupy these CEGRs/ALCDs in tumor sections of patients with FLC, but not in adjacent (background) regions (Figure 5E).
The DNAJB1‐PKAc‐β‐catenin‐TCF4 pathway is preserved in FLC metastasis
A recently procured fresh lung metastasis sample from a patient with FLC was used for further examination of the β‐catenin‐TCF4 pathway. Quantitative real‐time PCR with specific primers showed that the DNAJB1‐PKAc fusion transcript is expressed in the lung metastasis (Figure 6A). Hematoxylin and eosin staining revealed the presence of lamellar structure and mitotic figures in this metastasis (Figure 6B,C). We also found intensive staining of the lung metastasis with antibodies to PKAc and ph‐S675‐β‐catenin (Figure 7B). Western blotting revealed that DNAJB1‐PKAc is highly expressed in lung metastasis and that ph‐S675‐β‐catenin is highly abundant (Figure 6D). The ph‐S675‐β‐catenin‐TCF4‐p300 complexes are also abundant in the lung metastasis (Figure 6D, right). Levels of DNAJB1, HDAC1, Thy1, PGAP1, SPARC, Col3A1, and Col1A1 proteins that are encoded by CEGR/ALCD‐containing genes were increased in lung metastasis (Figure 6E). We next examined the status of CEGRs/ALCDs in three genes (HDAC1, DNAJB1, and SPARC) and observed that β‐catenin‐TCF4‐p300 complexes occupy these CEGRs/ALCDs in lung metastasis and that H3K9 acetylation shows that these regions are open for transcription (Figure 6F). Thus, this analysis demonstrates that the DNAJB1‐PKAc‐β‐catenin‐TCF4‐CEGRs/ALCDs axis is preserved in the lung metastasis of the patient with FLC (Figure 6G).
FIGURE 6.
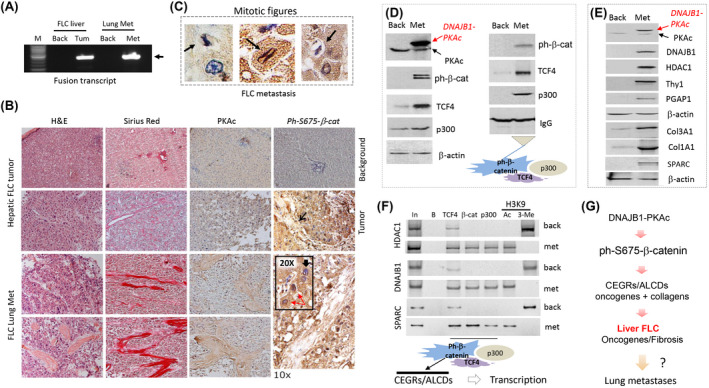
DNAJB1‐PKAc‐β‐catenin‐TCF4‐CEGRs/ALCDs pathway is preserved in lung metastasis of a patient with FLC. (A) Expression of the fusion DNAJB1‐PKAc transcript in liver tumor and lung metastasis. (B) Hematoxylin and eosin (H&E) staining, sirius red staining, and immunostaining of primary hepatic tumor (upper) and lung metastasis (bottom) of the patient with FLC with antibodies to PKAc and ph‐S675‐β‐catenin. The ×20 insert shows nuclear staining of cells with ph‐S675‐β‐catenin. Cells with nuclear (red arrows) and cytoplasmic (black arrows) staining are shown. (C) Examples of ph‐S675‐β‐catenin‐positive cells with mitotic figures are observed in lung metastasis of a patient with FLC. (D) Western blotting shows the expression of proteins of the β‐catenin‐TCF4‐p300 complexes in lung metastasis. Right: Co‐IP studies. (E) Western blotting shows the expression of CEGR/ALCD‐dependent genes in lung metastasis. (F) ChIP assay of the CEGRs/ALCDs from DNAJB1, HDAC1, and SPARC genes. (G) Hypothesis that is based on the studies of primary tumors and a lung metastasis of patients with FLC.
FIGURE 7.
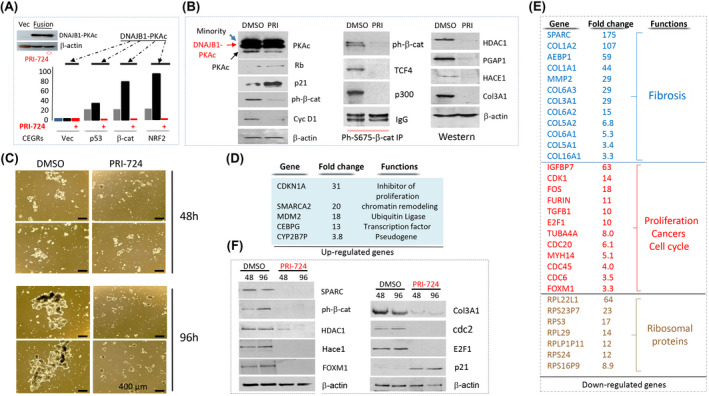
Inhibition of β‐catenin in FLC organoids reduces expression of FLC‐specific CEGR/ALCD‐containing genes and inhibits the development of FLC. (A) Western blot shows levels of DNAJB1‐PKAc in transfected cells. Bar graphs show luciferase activity of CEGR/ALCD‐luciferase constructs with CEGRs/ALCDs from p53, β‐catenin, and NRF2 genes in untreated cells, and in cells transfected with DNAJB1‐PKAc, untreated and treated with the inhibitor of β‐catenin PRI‐724 (5 μm). (B) Left: Treatment of FLC organoids with PRI‐724 (5 μm) for 24 h inhibits cyclin D1 and β‐catenin, but elevates p21 and Rb. Co‐IP study shows that PRI‐724 destroys β‐catenin‐TCF4‐p300 complexes in FLC organoids. Images on the right show levels of proteins, the genes of which contain CEGRs/ALCDs. (C) Treatment of FLC organoids with PRI‐724 (5 μm) for 96 h inhibits the proliferation of organoids and the formation of organoid structures. (D) List of top up‐regulated mRNAs that were determined by RNA‐seq in FLC organoids after treatments with PRI‐724 for 96 h (5 μm, n = 4/group). (E) List of genes reduced in FLC organoids with inhibited β‐catenin activity. (F) Western blot confirms changes of expression of proteins, the mRNAs of which were found by RNA‐seq.
Inhibition of β‐catenin in FLC organoids reduces expression of CEGR/ALCD‐dependent genes, and inhibits proliferation of FLC cells and formation of organoids
We next generated three luciferase reporter constructs with CEGRs/ALCDs from the p53, β‐catenin, and NRF2 genes. These constructs were co‐transfected with a plasmid expressing DNAJB1‐PKAc and treated with PRI‐724, an inhibitor of β‐catenin.[ 28 ] Western blot showed that the fusion kinase is expressed at identical levels in PRI‐724‐treated and untreated cells (Figure 7A). Luciferase activity was increased by CEGRs/ALCDs from all three genes, showing that CEGRs/ALCDs function as enhancers of transcription (Figure 7A). Ectopic expression of DNAJB1‐PKAc further increased the luciferase activity of these constructs. However, the inhibition of β‐catenin led to the reduction of the luciferase activity of all three CEGRs/ALCDs‐Luc reporters. These studies demonstrate that β‐catenin is required for DNAJB1‐PKAc‐mediated activation of CEGRs/ALCDs.
For further analysis, we used FLC organoids established from a patient‐derived tumor line that recapitulates the genomic mutations, transcriptome profiling, and biological alterations observed in patients with FLC.[ 20 ] The organoids were initially treated with PRI‐724 for 24 h, and the DNAJB1‐PKAc‐β‐catenin pathway was analyzed. Western blot showed that within 24 h, PRI‐724 did not change levels of the fusion protein (Figure 7B). An additional slow‐migrating DNAJB1‐PKAc protein was detected in the organoids. Our western blot and RNA‐seq data (Figure 8) indicate that this band represents the minority kinase.[ 5 ] Rb and p21 are elevated in organoids treated with PRI‐724, while cyclin D1 and ph‐S675‐β‐catenin are reduced, showing inhibition of proliferation (Figure 7B). Co‐IP studies revealed that PRI‐724 reduces β‐catenin‐TCF4‐p300 complexes in FLC organoids, which correlates with the inhibition of CEGR/ALCD‐dependent genes HDAC1, PGAP1, HACE1, and COL3A1 (Figure 7B). We next treated FLC organoids with PRI‐724 for 48 and 96 h and found that inhibition of β‐catenin inhibits formation of FLC organoid structures (Figure 7C). RNA‐seq studies found that the inhibition of β‐catenin for 96 h up‐regulates several genes that are involved in the inhibition of cell proliferation (Figure 7D, Table S3). In contrast, the inhibition of β‐catenin dramatically down‐regulates the expression of genes involved in fibrosis, cell proliferation, and other cancers (Figure 7E). Interestingly, we also observed down‐regulation of 24 members of ribosomal genes, suggesting alterations of translation in FLC organoids treated with PRI‐724. Figure 7E shows seven ribosomal proteins genes with the highest down‐regulation. Table S3 contains information for reduction of other ribosomal proteins. Reduction of several proteins in PRI‐724‐treated FLC organoids was confirmed by western blotting (Figure 7F).
Inhibition of β‐catenin by PRI‐724 reduces expression of DNAJB1‐PKAc via disruption of DNAJB1‐PKAc‐β‐catenin‐TCF4 auto‐regulation loop
Although the elevation of fusion DNAJB1‐PKAc mRNA and protein in patients with FLC has been described.[ 1 , 2 ] it is not clear how levels of the fusion transcript and protein are significantly higher than levels of a native PKAc kinase. In the studies of PRI‐724‐treated organoids, we found that the inhibition of β‐catenin leads to the reduction of DNAJB1‐PKAc fusion transcripts and protein. In FLC organoids, we detected three fusion transcripts. Figure 8A shows fusion parts for each transcript. RNA‐seq analysis revealed that treatments of organoids with inhibitor of β‐catenin for 48 h reduces all three DNAJB1‐PKAc transcripts, although the degree of inhibition is different (Figure 8B,C). Western blotting with antibodies to both fusion parts of DNAJB1 and PKAc identified major isoform and minority 1/2 isoforms, which were not separated well perhaps due to a very small difference in size. We found the reduction of fusion DNAJB1‐PKAc proteins at 48 and 96 h after the addition of PRI‐724. The inhibition of DNAJB1‐PKAc is specific, as the levels of a native PKAc kinase are not affected by the inhibition of β‐catenin (Figure 8D). These results suggest that there is an autoregulation loop in which the fusion DNAJB1‐PKAc kinase causes phosphorylation of β‐catenin at Ser675 and formation of β‐catenin‐TCF4 complexes, leading to the increase of transcription of the DNAJB1‐PKAc fusion through the binding to TCF4 sites in the promoter of the fusion part of DNAJB1 (Figure 8E). In support of autoregulation, we identified four TCF4 binding sites in the promoter of DNAJB1 (fusion part). This hypothesis is also supported by several data in the manuscript. First, our RNA‐seq analysis (Figure 5A) and western blot (Figure 4C) showed elevation of TCF4 mRNA and protein in tumors of patients with FLC. Second, TCF4 gene contains two CEGRs/ALCDs in the first and second introns, and two TCF4 binding sites in the promoter (Figure 8E). Third, the native DNAJB1 is elevated in tumors of patients with FLC (Figure 5A) and in lung metastasis of patients with FLC (Figure 6E) perhaps via β‐catenin‐mediated activation of the promoter. Taking together these results with data for PRI‐724‐mediated inhibition of DNAJB1‐PKAc, we suggest that there is an autoregulatory loop, and that this autoregulation is a mechanism by which the fusion oncoprotein increases its own expression to 5–10‐fold‐higher levels compared with native PKAc.
DISCUSSION
In the course of investigations of the mutation‐independent pathways of pediatric liver cancer hepatoblastoma, we identified genomic CEGRs/ALCDs regions that control the expression of a group of strong oncogenes.[ 15 , 16 , 18 ] RELI algorithm identified the opening of the CEGRs/ALCDs in several human cancers (Figure 1C), including FLC (Figure 2A). The current study focused on the CEGR/ALCD‐mediated activation of oncogenes by the β‐catenin‐TCF4 pathway in patients with FLC, in whom β‐catenin is activated through phosphorylation at Ser675 by the DNAJB1‐PKAc kinase. The activation of β‐catenin in FLC is consistent with other reports showing an increase of known FLC‐specific genes. Particularly, DNAJB1 and HDAC1 genes have been previously found to be activated by β‐catenin in colon cancer.[ 27 ] In addition, our RNA‐seq data indicated that MMP2 (matrix metalloproteinase 2) and LECT2 (leukocyte cell‐derived chemotaxin 2)[ 29 , 30 ] were also up‐regulated in FLC compared with control livers by 2.6‐fold and 2.2‐fold, respectively (Table S2). The ontology analysis of up‐regulated genes indicated that several biological processes related to Wnt signaling are activated in FLC tumors, such as “Wnt signaling pathway” (p‐value = 1.87E‐05), “TCF dependent signaling in response to WNT” (p‐value = 1.10E‐04), and “Regulation of Wnt‐mediated beta catenin signaling and target gene transcription” (p‐value = 2.59E‐04). Investigations of CEGRs/ALCDs are challenging. These genomic regions are observed only in the human genome, preventing the use of genetically modified mouse models. The second challenge is the large number of CEGR/ALCD‐containing oncogenes (over 200). All of these regions cannot be deleted at once. One realistic and promising approach to test the role of CERGs/ALCDs in cancer is the inhibition of CEGRs/ALCDs by therapeutic drugs. We have used this approach by treating FLC organoids with PRI‐724, an inhibitor of β‐catenin. These studies showed that the inhibition of β‐catenin leads to the repression of CEGR/ALCD‐containing oncogenes and FLC‐specific genes. Our studies were focused on the β‐catenin‐TCF4 complex as a target of the fusion DNAJB1‐PKAc kinase. However, β‐catenin can regulate expression of genes in complexes with other transcription factors such as necrosis factor kappa B (NF‐kB). In this regard, a recent report showed that β‐catenin forms β‐catenin‐NF‐κB‐CFTR transcriptional complexes in cholangiocytes, and these complexes regulate inflammation and fibrosis during ductular reaction.[ 31 ] Further studies are required to understand whether this pathway might also be involved in DNAJB1‐PKAc‐mediated FLC pathology.
CONCLUSIONS
Our studies strongly suggest that the DNAJB1‐PKAc‐β‐catenin‐TCF4‐CEGR/ALCD pathway is the main activator of fibrosis in patients with FLC. First, we identified targets of the β‐catenin‐TCF4‐CEGRs/ALCDs pathway, most of which are collagens. Second, we identified β‐catenin‐TCF4‐mediated elevation of SPARC in patients with FLC that has been shown to cause fibrosis in other settings.[ 32 , 33 , 34 ] Third, our molecular analyses showed that SPARC is activated by β‐catenin in patients with FLC and in FLC organoids (Figure 7). Fourth, the inhibition of β‐catenin by PRI‐724 dramatically (175‐fold) down‐regulated SPARC and other fibrotic genes (Figure 7). The fact that PRI‐724 inhibits the expression of CEGR/ALCD‐dependent oncogenes and blocks the proliferation and formation of FLC organoids provides a rationale for considering β‐catenin inhibitors as a therapy for FLC as well as a potential inhibitor of metastases in patients with FLC.
AUTHOR CONTRIBUTIONS
Study design: Ruhi Gulati, James Geller, Alexander Bondoc, Gregory Tiao, Matthew T. Weirauch, Sreeja Parameswaran, Soona Shin, and Nikolai Timchenko. Experiments: Ruhi Gulati, Maria Rivas and Nikolai Timchenko. Data analysis: Ruhi Gulati, Maria Rivas, Dolores Lopez‐Terrada, and Lubov Timchenko. Manuscript draft: Ruhi Gulati, Rebekah Karns, Dolores Lopez‐Terrada, Lubov Timchenko, Nikolai Timchenko, and Soona Shin. Collection and clinical characterization of samples of patients with HBL and FLC: Michael Johnston. Collection of experimental data: Michael Johnston. Experiments with samples from patients with FLC: Ashley Cast. Gene‐expression studies in BioBank: Meenasri Kumbaji. Examination of proliferation of HepG2 and Huh6 cells: Margaret A. Hanlon. Discussions: Margaret A. Hanlon, Charissa Lake, and Emily Schepers. Processing of samples from patients with FLC: Sanghoon Lee. Experiments using FLC organoids: Sanghoon Lee, Lola M. Reid, and Soona Shin. Experiments using the Xenograft model: Ping Zhou. Specimen collection and consent obtainment: Charissa Lake and Emily Schepers. RNA‐seq of samples from patients with FLC: Kyung‐Won Min and Je‐Hyun Yoon. Bio‐statistical analysis of RNA‐seq results: Rebekah Karns. Patient‐derived FLC tumor line: LMR. Specimens from patients with FLC: Dolores Lopez‐Terrada. Analyses of CEGR/ALCD pathways in tissue culture systems: Lubov Timchenko. Pathological examinations of patients with HBL and FLC: Ruhi Gulati. Collection of HBL samples: James Geller, Alexander Bondoc, and Gregory Tiao. RELI algorithm studies: Matthew T. Weirauch and Sreeja Parameswaran. Funding obtainment: Nikolai Timchenko. Data interpretation and preparation of the manuscript: All authors.
FUNDING INFORMATION
Supported by the Fibrolamellar Cancer Foundation (FCF‐0015); National Institutes of Health (R01CA159942, R37CA225807, R01AA027532, P30 DK078392, and U01AI130830); Internal Development Funds from CCHMC; William M and Ann K Grace Charitable Foundation; and the Cincinnati Children's Research Foundation ARC Award (53632).
CONFLICT OF INTEREST
LR owns stock in PhoenixSongs Biologicals.
Supporting information
Appendix S1 Supporting Information
Appendix S2 Supporting Information
Appendix S3 Supporting Information
ACKNOWLEDGMENT
The authors thank Hana Lee for the CEGR/ALCD‐luciferase constructs and help with the luciferase reporter assay, Eliane L. Wauthier (University of North Carolina at Chapel Hill) for the advice regarding the preparation of FLC organoids, and the Bioinformatics Collaborative Services at CCHMC for the analysis of fusion transcripts. This study used samples and data from the Discover Together Biobank at CCHMC. The authors thank the Discover Together Biobank for support of this study, as well as participants and their families, whose help and participation made this work possible.
Gulati R, Johnston M, Rivas M, Cast A, Kumbaji M, Hanlon MA, et al. β‐catenin cancer–enhancing genomic regions axis is involved in the development of fibrolamellar hepatocellular carcinoma. Hepatol Commun. 2022;6:2950–2963. 10.1002/hep4.2055
Contributor Information
Soona Shin, Email: soona.shin@cchmc.org.
Nikolai Timchenko, Email: nikolai.timchenko@cchmc.org.
REFERENCES
- 1. Lalazar G, Simon SM. Fibrolamellar carcinoma: recent advances and unresolved questions on the molecular mechanisms. Semin Liver Dis. 2018;38:51–9. [DOI] [PMC free article] [PubMed] [Google Scholar]
- 2. Riggle KM, Turnham R, Scott JD, Yeung RS, Riehle KJ. Fibrolamellar hepatocellular carcinoma: mechanistic distinction from adult hepatocellular carcinoma. Pediatr Blood Cancer. 2016;63:1163–7. [DOI] [PMC free article] [PubMed] [Google Scholar]
- 3. Honeyman JN, Simon EP, Robine N, Chiaroni‐Clarke R, Darcy DG, Lim IIP, et al. Detection of a recurrent DNAJB1‐PRKACA chimeric transcript in fibrolamellar hepatocellular carcinoma. Science. 2014;343:1010–4. [DOI] [PMC free article] [PubMed] [Google Scholar]
- 4. Graham RP, Jin L, Knutson DL, Kloft‐Nelson SM, Greipp PT, Waldburger N, et al. DNAJB1‐PRKACA is specific for fibrolamellar carcinoma. Mod Pathol. 2015;28:822–9. [DOI] [PubMed] [Google Scholar]
- 5. Engelholm LH, Riaz A, Serra D, Dagnæs‐Hansen F, Johansen JV, Santoni‐Rugiu E, et al. CRISPR/Cas9 engineering of adult mouse liver demonstrates that the Dnajb1‐Prkaca gene fusion is sufficient to induce tumors resembling fibrolamellar hepatocellular carcinoma. Gastroenterology. 2017;153:1662–73.e10. [DOI] [PMC free article] [PubMed] [Google Scholar]
- 6. Kastenhuber ER, Lalazar G, Houlihan SL, Tschaharganeh DF, Baslan T, Chen CC, et al. DNAJB1‐PRKACA fusion kinase interacts with β‐catenin and the liver regenerative response to drive fibrolamellar hepatocellular carcinoma. Proc Natl Acad Sci U S A. 2017;114:13076–84. [DOI] [PMC free article] [PubMed] [Google Scholar]
- 7. Johnston M, Timchenko NA. Molecular signatures of aggressive pediatric liver cancer. Arch Stem Cell Ther. 2021;2:1–4. [PMC free article] [PubMed] [Google Scholar]
- 8. Ranganathan S, Lopez‐Terrada D, Alaggio R. Hepatoblastoma and pediatric hepatocellular carcinoma: an update. Pediatr Dev Pathol. 2020;23:79–95. [DOI] [PubMed] [Google Scholar]
- 9. Haines K, Sarabia SF, Alvarez KR, Tomlinson G, Vasudevan SA, Heczey AA, et al. Characterization of pediatric hepatocellular carcinoma reveals genomic heterogeneity and diverse signaling pathway activation. Pediatr Blood Cancer. 2019;66:e27745. [DOI] [PubMed] [Google Scholar]
- 10. Eichenmüller M, Trippel F, Krueder M, Beck A, Schwarzmayr T, Haberle B, et al. The genomic landscape of hepatoblastoma and their progenies with HCC‐like features. J Hepatol. 2014;61:1312–20. [DOI] [PubMed] [Google Scholar]
- 11. Cairo S, Armengol C, de Reyniès A, Wei Y, Thomas E, Renard CA, et al. Hepatic stem‐like phenotype and interplay of Wnt/beta‐catenin and Myc signaling in aggressive childhood liver cancer. Cancer Cell. 2008;14:471–84. [DOI] [PubMed] [Google Scholar]
- 12. Min Q, Molina L, Li J, Adebayo Michael AO, Russell JO, Preziosi ME, et al. β‐catenin and yes‐associated protein 1 cooperate in hepatoblastoma pathogenesis. Am J Pathol. 2019;189:1091–104. [DOI] [PMC free article] [PubMed] [Google Scholar]
- 13. Zhang W, Meyfeldt J, Wang H, Kulkarni S, Lu J, Mandel JA, et al. β‐Catenin mutations as determinants of hepatoblastoma phenotypes in mice. J Biol Chem. 2019;294:17524–42. [DOI] [PMC free article] [PubMed] [Google Scholar]
- 14. Valanejad L, Lewis K, Wright M, Jiang Y, D'Souza A, Karns R, et al. FXR‐gankyrin axis is involved in development of pediatric liver cancer. Carcinogenesis. 2017;38:738–47. [DOI] [PMC free article] [PubMed] [Google Scholar]
- 15. Valanejad L, Cast A, Wright M, Bissig KM, Karns R, Weirauch MT, et al. PARP1 activation increases expression of modified tumor suppressors and pathways underlying development of aggressive hepatoblastoma. Commun Biol. 2018;1:1–67. [DOI] [PMC free article] [PubMed] [Google Scholar]
- 16. Johnston ME 2nd, Rivas MP, Nicolle D, Gorse A, Gulati R, Kumbaji M, et al. Olaparib inhibits tumor growth of hepatoblastoma in patient derived xenograft models. Hepatology. 2021;74:2201–15. [DOI] [PMC free article] [PubMed] [Google Scholar]
- 17. Cast A, Valanejad L, Wright M, Nguyen P, Gupta A, Zhu L, et al. C/EBP alpha‐dependent pre‐neoplastic tumor foci are the origin of hepatocellular carcinoma and aggressive pediatric liver cancer. Hepatology. 2018;67:1857–71. [DOI] [PMC free article] [PubMed] [Google Scholar]
- 18. Rivas M, Johnston ME 2nd, Gulati R, Kumbaji M, Margues Aguiar TF, Timchenko T, et al. HDAC1‐dependent repression of markers of hepatocytes and P21 is involved in development of pediatric liver cancer. Cell Mol Gastroenterol Hepatol. 2021;12:1669–82. [DOI] [PMC free article] [PubMed] [Google Scholar]
- 19. Harley JB, Chen X, Pujato M, Miller D, Maddox A, Forney C, et al. Transcription factors operate across disease loci, with EBNA2 implicated in autoimmunity. Nat Genet. 2018;50:699–707. [DOI] [PMC free article] [PubMed] [Google Scholar]
- 20. Oikawa T, Wauthier E, Dinh TA, Selitsky SR, Reyna‐Neyra A, Carpino G, et al. Model of fibrolamellar hepatocellular carcinomas reveals striking enrichment in cancer stem cells. Nat Commun. 2015;6:8070. [DOI] [PMC free article] [PubMed] [Google Scholar]
- 21. Kim D, Langmead B, Salzberg SL. HISAT: a fast spliced aligner with low memory requirements. Nat Methods. 2015;12:357–60. [DOI] [PMC free article] [PubMed] [Google Scholar]
- 22. Bray NL, Pimentel H, Melsted P, Pachter L. Near‐optimal probabilistic RNA‐seq quantification. Nat Biotechnol. 2016;34:525–7. [DOI] [PubMed] [Google Scholar]
- 23. Nicorici D, Satalan M, Edgren H, Kangaspeska S, Murumagi A, Kallioniemi O, et al. FusionCatcher—a tool for finding somatic fusion genes in paired‐end RNA‐sequencing data. bioRxiv. 2014. 10.1101/011650 [DOI] [Google Scholar]
- 24. Love MI, Huber W, Anders S. Moderated estimation of fold change and dispersion for RNA‐seq data with DESeq2. Genome Biol. 2014;15:550. [DOI] [PMC free article] [PubMed] [Google Scholar]
- 25. Pertea M, Pertea GM, Antonescu CM, Chang TC, Mendell JT, Salzberg SL. StringTie enables improved recnstruction of a transcriptome from RNA‐seq reads. Nat Biotechnol. 2015;33:290–5. [DOI] [PMC free article] [PubMed] [Google Scholar]
- 26. Simon EP, Freije CA, Farber BA, Lalazar G, Darcy DG, Honeyman JN, et al. Transcriptomic characterization of fibrolamellar hepatocellular carcinoma. Proc Natl Acad Sci U S A. 2015;112:E5916–25. [DOI] [PMC free article] [PubMed] [Google Scholar]
- 27. Bottomly D, Kyler SL, McWeeney SK, Yochum GS. Identification of beta‐catenin binding regions in colon cancer cells using ChIP‐Seq. Nucleic Acids Res. 2010;38:5735–45. [DOI] [PMC free article] [PubMed] [Google Scholar]
- 28. Kimura K, Ikoma A, Shibakawa M, Shimoda S, Harada K, Saio M, et al. Safety, tolerability, and preliminary efficacy of the anti‐fibrotic small molecule PRI‐724, a CBP/beta‐catenin inhibitor, in patients with hepatitis C virus‐related cirrhosis: a single‐center, open‐label, dose escalation phase 1 trial. EBioMedicine. 2017;23:79–87. [DOI] [PMC free article] [PubMed] [Google Scholar]
- 29. Okabe H, Delgado E, Lee JM, Yang J, Kinoshita H, Hayashi H, et al. Role of leukocyte cell‐derived chemotaxin 2 as a biomarker in hepatocellular carcinoma. PLoS One. 2014;9:e98817. [DOI] [PMC free article] [PubMed] [Google Scholar]
- 30. Qu B, Liu BR, Ya‐Ju Du YJ, Chen J, Cheng YQ, Xu W, et al. Wnt/β‐catenin signaling pathway may regulate the expression of angiogenic growth factors in hepatocellular carcinoma. Oncol Lett. 2014;4:1175–8. [DOI] [PMC free article] [PubMed] [Google Scholar]
- 31. Hu S, Russell JO, Liu S, Cao C, McGaughey J, Rai R, et al. β‐Catenin‐NF‐κB‐CFTR interactions in cholangiocytes regulate inflammation and fibrosis during ductular reaction. Elife. 2021. Oct 5. 10.7554/eLife.71310 [DOI] [PMC free article] [PubMed] [Google Scholar]
- 32. Trombetta‐Esilva J, Bradshaw AD. The function of SPARC as a mediator of fibrosis. Open Rheumatol J. 2012;6:146–55. [DOI] [PMC free article] [PubMed] [Google Scholar]
- 33. Riley HJ, Kelly RR, Van‐Laer AO, Neff LS, Dasgupta S, Baicu CF, et al. SPARC production by bone marrow‐derived cells contributes to myocardial fibrosis in pressure overload. Am J Physiol Heart Circ Physiol. 2021;320:H604–12. [DOI] [PMC free article] [PubMed] [Google Scholar]
- 34. Wang J, Ding Y, Zhou W. Albumin self‐modified liposomes for hepatic fibrosis therapy via SPARC‐dependent pathways. Int J Pharm. 2020;574:118940. [DOI] [PubMed] [Google Scholar]
Associated Data
This section collects any data citations, data availability statements, or supplementary materials included in this article.
Supplementary Materials
Appendix S1 Supporting Information
Appendix S2 Supporting Information
Appendix S3 Supporting Information


