Abstract
The recent Coronavirus Disease 2019 pandemic has highlighted the importance of indoor ventilation. In particular, ventilation is crucial in residential spaces and workspaces, where people spent most of their day. Natural ventilation is a cost-effective method for improving indoor ventilation. It can provide safe and comfortable residential and working environments without additional energy consumption. In this study, the ventilation performance was experimentally studied by measuring the concentration of ultrafine particulate matter according to the opening conditions of the windows and door of an office model in a wind tunnel. Furthermore, the internal flow structure in the office model was quantitatively analyzed through particle image velocimetry to determine the factors that affected the ventilation performance. The mean velocity inside the model and the ventilation performance increased with the opening angle of the windows. In particular, the opening condition of the door strongly affected the ventilation performance. This study is expected to provide a guideline for effectively improving the ventilation performance in indoor spaces.
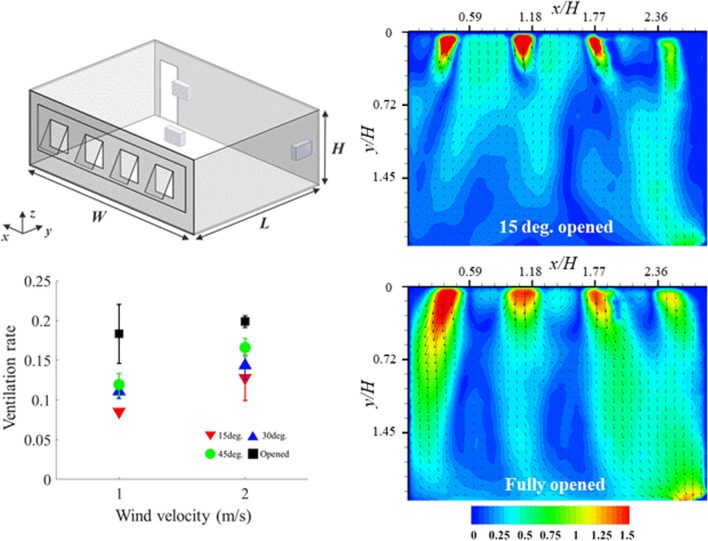
Graphical abstract
Keywords: Natural ventilation, Indoor environment, Particulate matters, Flow structures, Particle image velocimetry, Indoor air quality
Introduction
The ongoing Coronavirus Disease 2019 (COVID-19) pandemic has highlighted the importance of indoor ventilation (Bhagat et al. 2020). A number of outbreaks have occurred in confined indoor spaces, such as residential spaces and workspaces, where people spend most of their time. This indicates that virus transmission is particularly efficient in these types of indoor environments (Leclerc et al. 2020; Stadnytskyi et al. 2020). Three hundred and eighteen out of 1245 COVID-19 outbreaks have occurred in indoor spaces (Qian et al. 2021).
The World Health Organization announced that COVID-19 may spread through aerosols, which is referred to as airborne transmission, particularly in poorly ventilated indoor environments (Organization 2020). Nishiura et al. reported that the transmission of COVID-19 in a confined space was 18.7 times higher than that in an open environment (Nishiura et al. 2019). However, it is still arguable that the virus that causes COVID-19 can be spread via airborne transmission (Fennelly 2020; Lewis 2020; Morawska and Milton 2020).
Indoor ventilation strongly influences the indoor air quality, including ultrafine particulate matter (PM2.5). The exposure to indoor PM2.5 of outdoor origin has become a major threat to public health (Dominici et al. 2014). Particulate matter (PM) is divided into PM10, which comprises particles with a diameter of 10 m or less, and PM2.5, which comprises particles with a diameter of 2.5 m or less. The removal of PM10 is strongly affected by gravitational sedimentation but that of PM2.5 is not (Thatcher et al. 2002). Owing to this, airborne PM2.5 is more fatal than PM10. Therefore, recent works have focused on the removal of PM2.5 (Ryu et al. 2019; Kim et al. 2019).
In general, mechanical and natural ventilation are adopted to enhance ventilation inside an indoor space. Mechanical ventilation is applied to improve the indoor air quality in a confined space. A significant amount of energy is consumed to operate heating, ventilation, and air conditioning (HVAC) systems. According to a previous study (Orme 2001), HVAC systems account for 67.9% of the total annual energy consumption in service and residential buildings.
Natural ventilation is a cost-effective method for improving indoor ventilation. The replacement of indoor air with outdoor air can provide comfortable residential and working environments without additional energy consumption (Busch 1992). Miguel et al. stated that a detailed understanding of the relationship between wind and ventilation features is required to achieve efficient natural ventilation (Miguel et al. 2001). Natural ventilation provides other benefits in addition to reduction in energy consumption. A study showed that the adequate thermal comfort range for naturally ventilated buildings is significantly higher than that for buildings with mechanical HVAC systems (Dear and Brager 2002).
Experimental analysis was performed in schools considering different pollutants characterized by their origin, size, and dynamics to evaluate the effect of the ventilation strategy on indoor air quality (Stabile et al. 2017). The natural ventilation performance in a school building was analyzed through field measurement according to window opening rates, positions, and weather conditions (Park et al. 2021). In addition, the effect of natural ventilation on the deposition of PM2.5 in classrooms was experimentally investigated (Liu et al. 2018). The results showed that the deposition rate is linearly related to the natural ventilation rate.
It is necessary to conduct empirical and quantitative research on natural ventilation in indoor spaces to prevent the spread of viruses and ensure good indoor air quality. In the present study, the ventilation performance and flow structures were empirically examined according to the opening conditions of the windows and door of an office model in a wind tunnel. The flow structures were quantitatively investigated using particle image velocimetry (PIV) to determine the main parameters that affected the ventilation rate. Heretofore, there have been few studies that quantitatively verified the ventilation performance and flow structure by using an office model empirically. The results of this study will provide essential information required for ensuring efficient natural ventilation in indoor spaces.
Experimental apparatus and methods
PM measurement
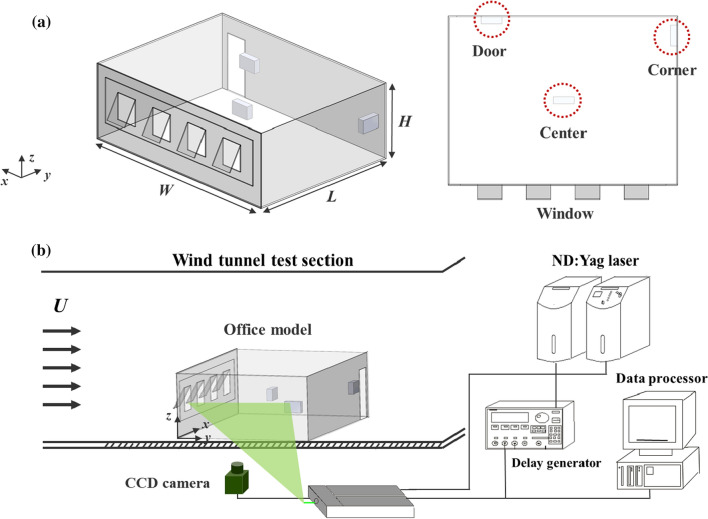
The ventilation performance was experimentally investigated using a scaled office model, with dimensions of 0.65 m (width) × 0.225 m (height) × 0.48 m (length), as shown in Fig. 1a. The model was created by simplifying the general office model, focusing on the opening conditions of the windows and door. Four windows were used in the model, and the opening angles of the windows were 15 , 30 , and 45 . Fully opened windows were also considered. One door was applied in the model, and only the closed or opened condition of door was considered.
Fig. 1.
Schematics of a Scaled office model with the experimental setup for the PM concentration measurement (isometric view (left) and top view (right)) and b PIV measurement system and wind tunnel test section. The PIV system consists of a 120 mJ Nd:YAG laser, CCD camera, workstation, and delay generator
Incense was burned to generate test particles. Burning incense mainly generates gaseous oxide products and volatile organic substance (Lin et al. 2008). The initial PM concentration inside the model was set as PM2.5 = 600–700 μg/m3. After incense particles were injected and dispersed into the test model, the PM2.5 concentration inside the model was less than 1%. After setting the initial concentration, wind tunnel experiments were carried out at wind velocities (U) of 1 and 2 m/s. The PM concentration was monitored using particle counters (SPS30, Sensirion, Switzerland) at three locations at intervals of 1 s. The three measurement devices were located at the center (x/H = 1.42, y/H = 1.05), door (x/H = 2.4, y/H = 2.1), and corner (x/H = 0.3, y/H = 2.1) of the test model, as depicted in Fig. 1a.
PIV measurement
The flow structures in the test model were quantitatively analyzed using a PIV measurement system, as shown in Fig. 1b. The system consisted of a Nd:YAG laser, delay generator, 4872 × 3248 charge-coupled device (CCD) camera, optics for generating a two-dimensional laser sheet, and workstation for data processing. PIV experiments were conducted in a closed-type subsonic wind tunnel with a test section with dimensions of 0.72 m (width) × 0.6 m (height) × 6.75 m (length). The wind velocity was U = 1 and 2 m/s for each experimental condition. The two-dimensional flow field inside the office model was measured at the central plane (z/H = 0.5).
Olive oil droplets with a mean diameter of 1–3 µm were used as tracer particles in the PIV experiments. The oil droplets generated were from a Laskin nozzle and seeded into the wind tunnel test section. Oil droplets are generally employed as tracer particles for gaseous flow because they exhibit an adequate aerodynamic response to velocity changes in wind tunnel tests (Melling 1997). The delay between a image pair was 0.00022 s. The frame rate of CCD camera was fixed with 3 frames per second. The mean velocity fields of the tracer particles were obtained by averaging 500 pairs of instantaneous velocity fields for each experimental case using PIVview (PIVTEC-GmbH, Germany). A cross-correlation PIV algorithm with an interrogation window of 64 × 64 pixels (50% overlapping) based on the fast Fourier transform was used to obtain velocity fields. In this measurement, the RMS velocity fluctuation in the uniform flow region was 0.3%. The measurement uncertainty of the PIV system was estimated to be less than 1.5%.
Results and discussion
Ventilation performance
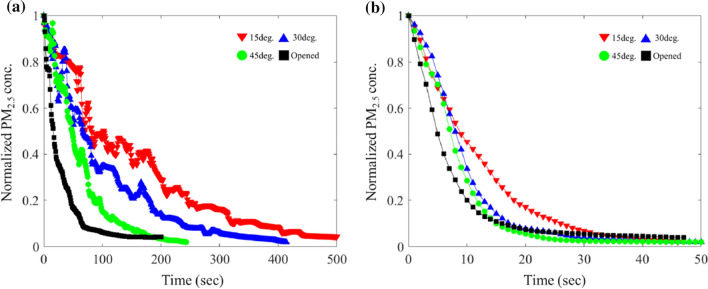
The effect of the opening conditions of the windows and door of the office model on the ventilation performance was investigating by varying the opening angle of the windows from 15 to the fully opened condition under closed and open door conditions at U = 1 m/s. Figure 2 shows the temporal variations in the PM2.5 concentration at different opening angles of the windows under closed (Fig. 2a) and open (Fig. 2b) door conditions. The PM2.5 concentration decreases faster under the open door condition compared to the closed door condition. The time scale under the closed door condition is 10 times larger than that under the open door condition. In both conditions, the rate of reduction in the PM2.5 concentration increases with opening angle of the windows.
Fig. 2.
Temporal variations in the PM2.5 concentration at different opening angles of windows under a Closed and b Open door conditions. The y-axis represents the PM2.5 concentration normalized by the initial particle concentration
As the PM2.5 concentration decreases exponentially with time, the ventilation rate (λvent) is obtained by fitting the PM2.5 concentration (C(t)) curves to the following exponential equation:
| 1 |
where Ci is the initial PM2.5 concentration and t indicates the measurement time. We used this ventilation rate to compare the ventilation performance for various opening conditions of the windows and door.
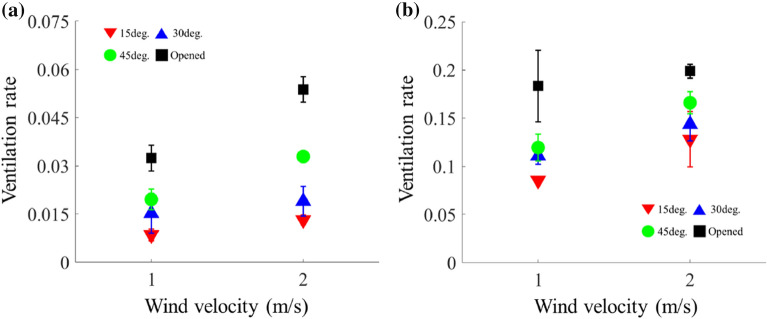
The ventilation performance at different wind velocities was quantitatively compared using the variation in the ventilation rate with the opening angle of the windows under the closed and open door conditions, as shown in Fig. 3. When all windows and the door are closed, the ventilation rate is calculated as 0.00029, which is significantly smaller than the value obtained with flow. At a given wind velocity, the ventilation rate increases with the opening angle of the windows under the open and closed door conditions. The ventilation rate is 0.0538 when the windows and door are open. In addition, the ventilation rate increases with the wind velocity.
Fig. 3.
Ventilation rate vs. wind velocity (U) at various opening angles of the windows under a Closed and b Open door conditions
The effect of the opening conditions of the windows and door and the wind velocity on the ventilation rate was quantitatively compared. When the opening angle of the windows is 15°, the ventilation rate under the open door condition is 10.0 and 9.7 times larger than that under the closed door condition at U = 1 and 2 m/s, respectively. The ratio of the ventilation rates in the closed and open door conditions gradually decreases as opening angle of the windows increases. When the windows are fully opened, the ratio is 5.7 and 3.7 and U = 1 and 2 m/s, respectively.
In the open door condition, the ventilation rate obtained when the windows are fully opened is 2.2 and 1.6 times larger than that obtained at an opening angle of 15 at U = 1 and 2 m/s, respectively. In the closed door condition, the ratio is 3.8 and 4.1 at U = 1 and 2 m/s, respectively.
The ventilation rate at U = 2 m/s is 1.7 times larger than that at U = 1 m/s when the windows are fully opened under the closed door condition. In all opening conditions of the windows and door, the ventilation rate increases by approximately 1.4 times on average as U increases from 1 to 2 m/s.
Therefore, the door condition has the strongest effect on the ventilation performance. Furthermore, the effect of the different parameters on the ventilation rate decreases in the order of the door condition, opening angle of the windows, and wind velocity. The effect of the wind velocity on the ventilation rate is expected to increase at higher velocities (Taghipour et al. 2018).
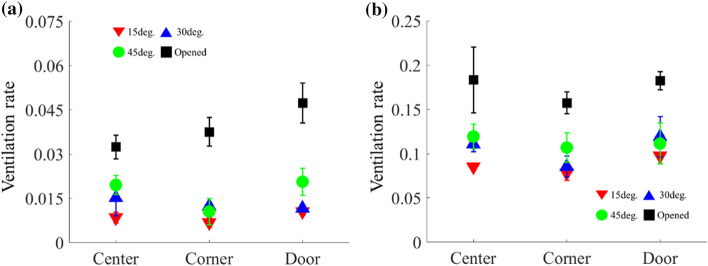
The ventilation rates around the corner and door were compared at U = 1 m/s (Fig. 4). Similar to the results obtained at the center, the ventilation rates at the corner and door increase with the opening angle of the windows. The ventilation rates at the corner are relatively low compared to the other measurement locations. The ventilation rate at the door is the largest for most cases. However, as the experiment was carried out using a scaled model rather than an actual space, the difference in the ventilation rate according to the location is relatively small.
Fig. 4.
Ventilation rates at different measurement locations under a Closed and b Open door conditions at U = 1 m/s
Flow structures
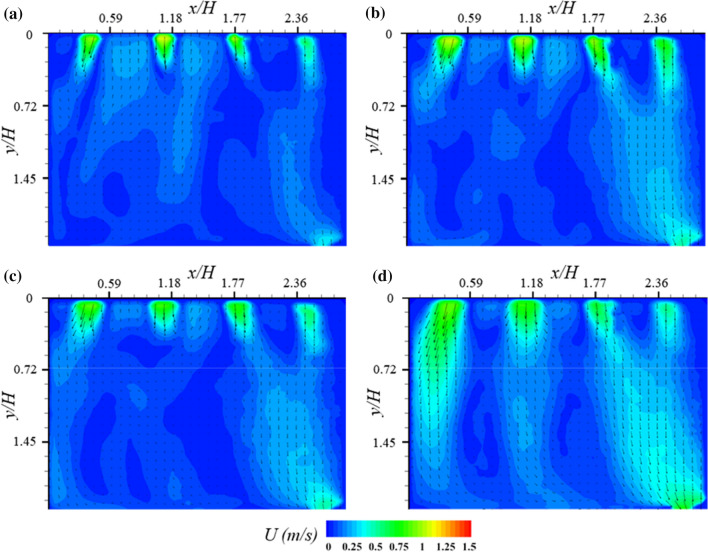
The flow structures inside the office model were analyzed through the PIV measurement to investigate the ventilation performance. Figure 5 shows the comparison of the mean velocity fields at different opening angles of the windows under the open door condition at U = 1 m/s.
Fig. 5.
Mean velocity fields inside the test model at different opening angles of windows under open door condition at U = 1 m/s: a 15 , b 30 , c 45 , and d Fully opened windows
The flow enters through the four windows at a velocity of approximately 1 m/s and exits through the door. The mean velocity increases with the opening angle of the windows. In particular, there is a distinct increase in the mean velocity in the regions behind the windows and close to the door.
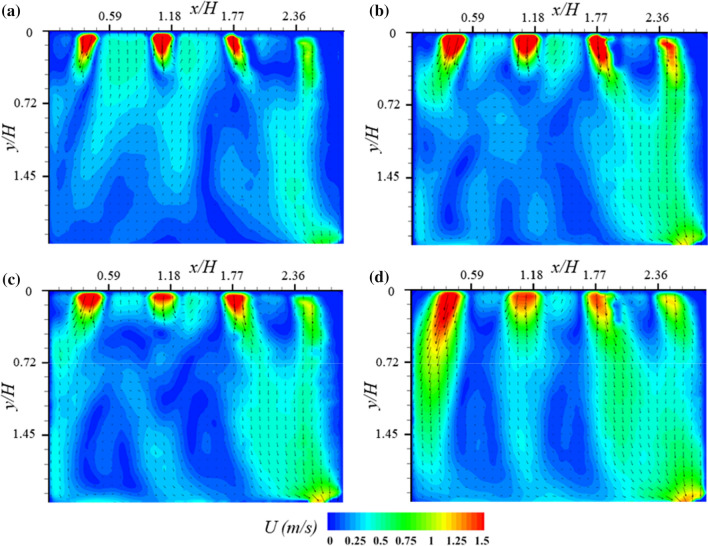
Figure 6 shows the comparison of the mean velocity fields at different opening angles of the windows under the open door condition at U = 2 m/s. The flow structure is similar to the result at U = 1 m/s, and the overall mean velocity is higher than that at U = 1 m/s. In particular, the flow velocity in the region around the corner (x/H = 0–0.59) is significantly higher than that at U = 1 m/s.
Fig. 6.
Mean velocity fields inside the test model at different opening angles of windows under open door condition at U = 2 m/s: a 15 , b 30 , c 45 , and d Fully opened windows
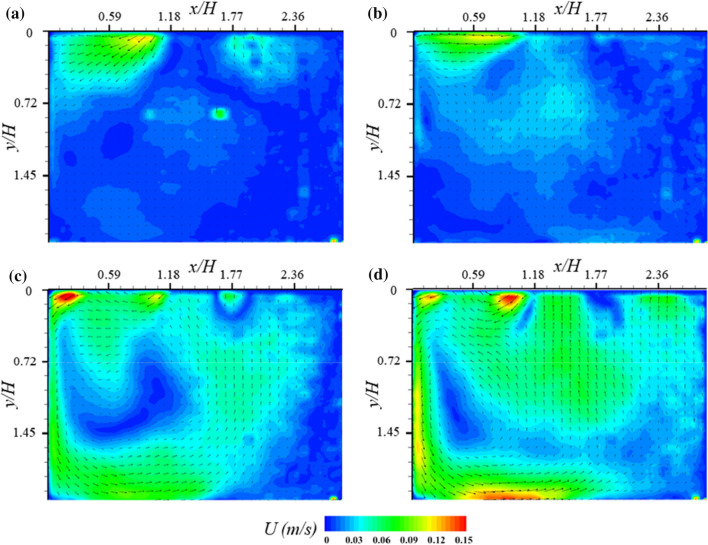
Figure 7 shows the mean velocity fields at different opening angles of the windows under the closed door condition at U = 2 m/s. The mean velocity is significantly lower than that under the open door condition at U = 2 m/s. Even when all the windows are fully opened (Fig. 7d), the maximum velocity is approximately 0.15 m/s. The mean velocity decreases because the outlet along the flow direction is closed. Thus, as the pressure inside the model increases, the flow that enters the model significantly decreases. The flow exits the model through the two windows on the right side instead of the door. Thus, a counterclockwise circulating flow structure is formed under the closed door condition.
Fig. 7.
Mean velocity fields inside the test model at different opening angles of windows under closed door condition at U = 2 m/s: a 15 , b 30 , c 45 , and d Fully opened windows
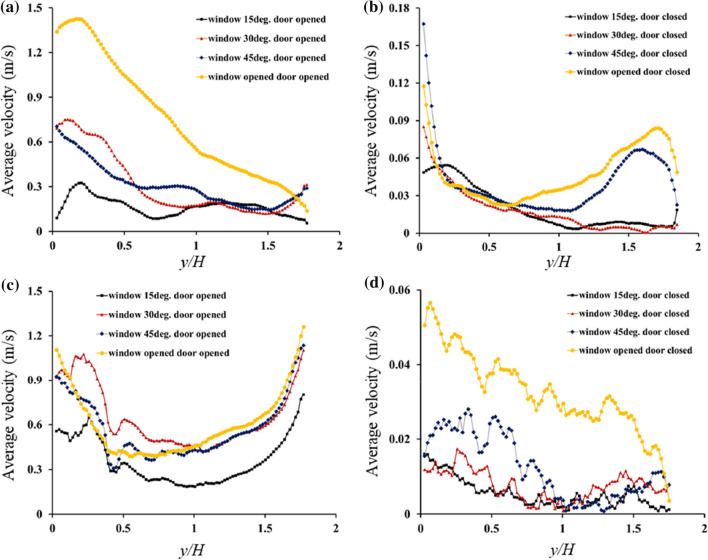
To elucidate the correlation between the mean velocity and ventilation rate at various locations, the magnitudes of the mean velocity at x/H = 0.13 (corner location) and 2.5 were extracted from mean velocity fields at different opening angles of the windows under the open and closed door conditions at U = 2 m/s. The results are shown in Fig. 8. Under the open door condition, at x/H = 0.13 (Fig. 8a), the mean velocity gradually decreases as y/H increases because there is no outlet at this location. In addition, at x/H = 2.5 (Fig. 8c), the mean velocity first decreases and then increases as y/H increases. This is because the open door is located at x/H = 2.5.
Fig. 8.
Magnitudes of mean velocity at a x/H = 0.13 and c x/H = 2.5 under open door condition and at b x/H = 0.13 and d x/H = 2.5 under closed door condition at various opening angles of windows and U = 2 m/s
Under the closed door condition (Fig. 8b and d), the mean velocity is an order of magnitude lower than that under the open door condition. At x/H = 0.13 (Fig. 8b), the initial velocity of the flow that enters the windows is relatively high. This is followed by a gradual decrease and an increase at the end. The increase at the end is due to the counterclockwise circulating flow shown in Fig. 7d. At x/H = 2.5 (Fig. 8d), the mean velocity around the windows is relatively higher than that around the door owing to the counterclockwise circulating flow structure.
Table 1 shows the mean velocity values at different opening angles of the windows at z/H = 0.5 and U = 2 m/s. Although there are local variations in the mean velocity, as shown in Fig. 8, the mean velocity of the entire field increases with the opening angle of the windows under the open and closed door conditions. This tendency is similar to that of the ventilation rate.
Table 1.
Mean velocity at z/H = 0.5 and U = 2 m/s
| Window | 15 | 30 | 45 | Fully opened |
|---|---|---|---|---|
| Door opened | 0.236 | 0.276 | 0.302 | 0.380 |
| Door closed | 0.014 | 0.016 | 0.034 | 0.045 |
When the opening angle of the windows is 15 at U = 2 m/s, the ratio of the ventilation rates under the closed and open door conditions is 9.7. In addition, the ratio of the mean velocities under the closed and open door conditions is 16.9. When the windows are fully opened, these ratios gradually decrease and reach the minimum values of 3.7 and 8.4.
To compare the effect of opening degree of window on ventilation rate and overall mean velocity, the maximum ratio of ventilation rate and mean velocity value was calculated as 4.1 and 3.2, respectively, under fully opened window and closed door condition. The effect of the door condition on both ratios is stronger than that of the opening angle of the windows. Therefore, there is a positive correlation between the ventilation rate and mean velocity.
Conclusions
This study experimentally investigated the natural ventilation performance by measuring the PM2.5 concentration under different opening conditions of the windows and door of an office model in a wind tunnel. Furthermore, the internal flow structure in the model was quantitatively analyzed through PIV measurement. When all other conditions were the same, the door condition had the strongest effect on the ventilation performance. The ventilation rate under the open door condition was approximately 10 times higher than that under the closed door condition when the opening angle of the windows was 15 . The effect of different parameters on the ventilation rate decreased in the order of the door condition, opening angle of windows, and wind velocity. The mean velocity inside the model increased with the opening angle of the windows and door and wind velocity. Thus, there was a positive correlation between the ventilation rate and mean velocity. The present study has limitations because this study is mainly focused on the opening degree of windows and door in the scaled office model. In future, the ventilation performance should be investigated considering various indoor conditions, including the interior structure and furniture with the full-scale model. The results of this study can be used as a guideline for achieving effective natural ventilation in indoor spaces.
Acknowledgements
This research was supported by the Korea National University Development Project (KNUDP) and Regional Innovation Strategy (2021RIS-004) funded by the Ministry of Education (MOE, Korea) and National Research Foundation of Korea (NRF).
Footnotes
Publisher's Note
Springer Nature remains neutral with regard to jurisdictional claims in published maps and institutional affiliations.
References
- Bhagat RK, Wykes MD, Dalziel SB, Linden P. Effects of ventilation on the indoor spread of COVID-19. J Fluid Mech. 2020;903:871. doi: 10.1017/jfm.2020.720. [DOI] [PMC free article] [PubMed] [Google Scholar]
- Busch JF. A tale of two populations: thermal comfort in air-conditioned and naturally ventilated offices in Thailand. Energy Build. 1992;18(3–4):235–249. doi: 10.1016/0378-7788(92)90016-A. [DOI] [Google Scholar]
- De Dear RJ, Brager GS. Thermal comfort in naturally ventilated buildings: revisions to ASHRAE Standard 55. Energy Build. 2002;34(6):549–561. doi: 10.1016/S0378-7788(02)00005-1. [DOI] [Google Scholar]
- Dominici F, Greenstone M, Sunstein CR. Particulate matter matters. Science. 2014;344(6181):257–259. doi: 10.1126/science.1247348. [DOI] [PMC free article] [PubMed] [Google Scholar]
- Fennelly KP. Particle sizes of infectious aerosols: implications for infection control. Lancet Resp Med. 2020;58:92. doi: 10.1016/S2213-2600(20)30323-4. [DOI] [PMC free article] [PubMed] [Google Scholar]
- H. Nishiura, H. Oshitani, T. Kobayashi, T. Saito, T. Sunagawa, T. Matsui, T. Wakita, M. COVID, R. Team, M. Suzuki, Closed environments facilitate secondary transmission of coronavirus disease 2019 (COVID-19), MedRxiv (2020).
- Kim JJ, Hann T, Lee SJ. Effect of flow and humidity on indoor deposition of particulate matter. Environ Pollut. 2019;255:113263. doi: 10.1016/j.envpol.2019.113263. [DOI] [PubMed] [Google Scholar]
- Leclerc QJ, Fuller NM, Knight LE, Funk S, Knight GM. What settings have been linked to SARS-CoV-2 transmission clusters? Wellcome Open Res. 2020;5:943. doi: 10.12688/wellcomeopenres.15889.2. [DOI] [PMC free article] [PubMed] [Google Scholar]
- Lewis D. Is the coronavirus airborne? Experts can’t agree. Nature. 2020;580(7802):175. doi: 10.1038/d41586-020-00974-w. [DOI] [PubMed] [Google Scholar]
- Lin T-C, Krishnaswamy G, Chi DS. Incense smoke: clinical, structural and molecular effects on airway disease. Clin Mol Allergy. 2008;6(1):3. doi: 10.1186/1476-7961-6-3. [DOI] [PMC free article] [PubMed] [Google Scholar]
- Liu C, Yang J, Ji S, Lu Y, Wu P, Chen C. Influence of natural ventilation rate on indoor PM 25 deposition. Build Environ. 2018;144:357–364. doi: 10.1016/j.buildenv.2018.08.039. [DOI] [Google Scholar]
- Melling A. Tracer particles and seeding for particle image velocimetry. Meas Sci Technol. 1997;8(12):1406. doi: 10.1088/0957-0233/8/12/005. [DOI] [Google Scholar]
- Miguel A, Van de Braak N, Silva A, Bot G. Wind-induced airflow through permeable materials part I: the motion equation. J Wind Eng Ind Aerodyn. 2001;89(1):45–57. doi: 10.1016/S0167-6105(00)00027-1. [DOI] [Google Scholar]
- Morawska L, Milton DK. It is time to address airborne transmission of coronavirus disease 2019 (COVID-19) Clin Infect Dis. 2020;71(9):2311–2313. doi: 10.1093/cid/ciaa939. [DOI] [PMC free article] [PubMed] [Google Scholar]
- Orme M. Estimates of the energy impact of ventilation and associated financial expenditures. Energy Build. 2001;33(3):199–205. doi: 10.1016/S0378-7788(00)00082-7. [DOI] [Google Scholar]
- Park S, Choi Y, Song D, Kim EK. Natural ventilation strategy and related issues to prevent coronavirus disease 2019 (COVID-19) airborne transmission in a school building. Sci Total Environ. 2021;789:147764. doi: 10.1016/j.scitotenv.2021.147764. [DOI] [PMC free article] [PubMed] [Google Scholar]
- Qian H, Miao T, Liu L, Zheng X, Luo D, Li Y. Indoor transmission of SARS-CoV-2. Indoor Air. 2021;31(3):639–645. doi: 10.1111/ina.12766. [DOI] [PubMed] [Google Scholar]
- Ryu J, Kim JJ, Byeon H, Go T, Lee SJ. Removal of fine particulate matter (PM25) via atmospheric humidity caused by evapotranspiration. Environ Pollut. 2019;245:253–259. doi: 10.1016/j.envpol.2018.11.004. [DOI] [PubMed] [Google Scholar]
- Stabile L, Dell'Isola M, Russi A, Massimo A, Buonanno G. The effect of natural ventilation strategy on indoor air quality in schools. Sci Total Environ. 2017;595:894–902. doi: 10.1016/j.scitotenv.2017.03.048. [DOI] [PubMed] [Google Scholar]
- Stadnytskyi V, Bax CE, Bax A, Anfinrud P. The airborne lifetime of small speech droplets and their potential importance in SARS-CoV-2 transmission. Proc Natl Acad Sci. 2020;117(22):11875–11877. doi: 10.1073/pnas.2006874117. [DOI] [PMC free article] [PubMed] [Google Scholar]
- Taghipour R, Abdo P, Huynh B. Effect of wind speed on ventilation flow through a two dimensional room fitted with a windcatcher, ASME International Mechanical Engineering Congress and Exposition. Am Soc Mech Eng. 2018;56:355. [Google Scholar]
- Thatcher TL, Lai AC, Moreno-Jackson R, Sextro RG, Nazaroff WW. Effects of room furnishings and air speed on particle deposition rates indoors. Atmos Environ. 2002;36(11):1811–1819. doi: 10.1016/S1352-2310(02)00157-7. [DOI] [Google Scholar]
- W.H. Organization, Transmission of SARS-CoV-2: implications for infection prevention precautions: scientific brief, 09 July 2020, World Health Organization, 2020.


