

Key Points
Question
How does the association of COVID-19 vaccination and prior SARS-CoV-2 infection with subsequent SARS-CoV-2 infection and severe COVID-19 outcomes change over time?
Findings
In a cohort study of 10.6 million North Carolina residents from March 2020 to June 2022, receipt of a primary COVID-19 vaccine series compared with being unvaccinated, receipt of a booster compared with primary vaccination, and prior SARS-CoV-2 infection compared with no prior infection were all significantly associated with lower risk of SARS-CoV-2 infection and resulting hospitalization and death. The estimates for the associated protection decreased over time, especially for the outcome of infection, and varied by type of circulating variant.
Meaning
Receipt of COVID-19 vaccines and boosters, as well as prior SARS-CoV-2 infection, were associated with protection against SARS-CoV-2 infection (including Omicron) and severe COVID-19 outcomes, although the associated protection waned over time.
Abstract
Importance
Data about the association of COVID-19 vaccination and prior SARS-CoV-2 infection with risk of SARS-CoV-2 infection and severe COVID-19 outcomes may guide prevention strategies.
Objective
To estimate the time-varying association of primary and booster COVID-19 vaccination and prior SARS-CoV-2 infection with subsequent SARS-CoV-2 infection, hospitalization, and death.
Design, Setting, and Participants
Cohort study of 10.6 million residents in North Carolina from March 2, 2020, through June 3, 2022.
Exposures
COVID-19 primary vaccine series and boosters and prior SARS-CoV-2 infection.
Main Outcomes and Measures
Rate ratio (RR) of SARS-CoV-2 infection and hazard ratio (HR) of COVID-19–related hospitalization and death.
Results
The median age among the 10.6 million participants was 39 years; 51.3% were female, 71.5% were White, and 9.9% were Hispanic. As of June 3, 2022, 67% of participants had been vaccinated. There were 2 771 364 SARS-CoV-2 infections, with a hospitalization rate of 6.3% and mortality rate of 1.4%. The adjusted RR of the primary vaccine series compared with being unvaccinated against infection became 0.53 (95% CI, 0.52-0.53) for BNT162b2, 0.52 (95% CI, 0.51-0.53) for mRNA-1273, and 0.51 (95% CI, 0.50-0.53) for Ad26.COV2.S 10 months after the first dose, but the adjusted HR for hospitalization remained at 0.29 (95% CI, 0.24-0.35) for BNT162b2, 0.27 (95% CI, 0.23-0.32) for mRNA-1273, and 0.35 (95% CI, 0.29-0.42) for Ad26.COV2.S and the adjusted HR of death remained at 0.23 (95% CI, 0.17-0.29) for BNT162b2, 0.15 (95% CI, 0.11-0.20) for mRNA-1273, and 0.24 (95% CI, 0.19-0.31) for Ad26.COV2.S. For the BNT162b2 primary series, boosting in December 2021 with BNT162b2 had the adjusted RR relative to primary series of 0.39 (95% CI, 0.38-0.40) and boosting with mRNA-1273 had the adjusted RR of 0.32 (95% CI, 0.30-0.34) against infection after 1 month and boosting with BNT162b2 had the adjusted RR of 0.84 (95% CI, 0.82-0.86) and boosting with mRNA-1273 had the adjusted RR of 0.60 (95% CI, 0.57-0.62) after 3 months. Among all participants, the adjusted RR of Omicron infection compared with no prior infection was estimated at 0.23 (95% CI, 0.22-0.24) against infection, and the adjusted HRs were 0.10 (95% CI, 0.07-0.14) against hospitalization and 0.11 (95% CI, 0.08-0.15) against death after 4 months.
Conclusions and Relevance
Receipt of primary COVID-19 vaccine series compared with being unvaccinated, receipt of boosters compared with primary vaccination, and prior infection compared with no prior infection were all significantly associated with lower risk of SARS-CoV-2 infection (including Omicron) and resulting hospitalization and death. The associated protection waned over time, especially against infection.
This study uses data from March 2020 to June 2022 to examine the association of the primary and booster COVID-19 vaccines with SARS-CoV-2 infection, hospitalization, and death.
Introduction
COVID-19 continues to be a global public health emergency. Vaccination is a major tool to combat this pandemic, but its effectiveness wanes over time and tends to be lower against new variants. Surveillance data from North Carolina, a state with 10.6 million residents, was previously used to estimate the effectiveness of the 3 COVID-19 vaccines deployed in the US—BNT162b2 (Pfizer-BioNTech), mRNA-1273 (Moderna), and Ad26.COV2.S (Janssen/Johnson & Johnson)—in reducing the risk of COVID-19 from December 11, 2020, to September 8, 2021.1 Waning effectiveness was attributed to both declining immunity over time and the emergence of the Delta variant.1
This article reports a new analysis of the North Carolina surveillance data from March 2, 2020, through June 3, 2022. The expanded data allowed evaluation of the association of the 3 vaccines with SARS-CoV-2 infection, hospitalization, and death over 16 months, including the time during which the Omicron variant was predominant. The data also allowed evaluation of the association of boosters with outcomes for more than 8 months and of the waning immunity acquired by SARS-CoV-2 infection with different variants over 2 years, including 6 months during which Omicron was predominant.
Methods
This study was approved by the University of North Carolina at Chapel Hill Institutional Review Board. This activity was determined to be public health surveillance as defined in 45 CFR §46.102(l) (US Department of Health and Human Services, Title 45 Code of Federal Regulations, §46 Protection of Human Subjects) and thus informed consent was not required.
Data Sources
North Carolina COVID-19 Surveillance System
The North Carolina COVID-19 surveillance system is a web-based central repository of person-based communicable disease investigation database. Laboratories report COVID-19 test results electronically to the North Carolina COVID-19 surveillance system, which leads to identification of cases meeting the definition by polymerase chain reaction or antigen testing. Local health departments gather additional demographic and clinical outcome data. Race and ethnicity were self-reported with fixed categories and were collected as part of the US Department of Health and Human Services COVID-19 laboratory reporting requirements.2
COVID-19 Vaccine Management System
The COVID-19 vaccine management system is a secure, cloud-based system that schedules appointments and tracks vaccine administration information. COVID-19 vaccine management system records are transferred daily to the North Carolina Department of Health and Human Services Business Intelligence Data Platform, where data are cleansed, transformed, and normalized to create a recipient-based view of COVID-19 vaccination history.
Study Design
We extracted individual-level data on vaccination histories from December 11, 2020, to June 3, 2022, and on SARS-CoV-2 infection, hospitalization, and death from March 2, 2020, to June 3, 2022, by linking the North Carolina COVID-19 surveillance system and COVID-19 vaccine management system databases through a master patient index (eMethods in the Supplement). We used the 2020 bridged-race population estimates produced by the US Census Bureau to determine the total number of residents with each combination of demographic variables, ie, age, sex, race and ethnicity, geographic region (Coastal Plain, Piedmont, Mountains), and county-level vaccination rate.
Exposures
The exposure variables included BNT162b2, mRNA-1273, and Ad26.COV2.S vaccines, as well as SARS-CoV-2 infection during periods of pre-Delta, Delta, or Omicron variant predominance.
Outcomes
The primary outcome was SARS-CoV-2 infection determined by polymerase chain reaction or antigen testing. The secondary outcomes were COVID-19–related hospitalization and death, which were documented by local health departments; for cases reported from January 1, 2022, forward, vital records criteria were introduced to expand COVID-19–related death surveillance.
Statistical Analysis
We treated SARS-CoV-2 infections as recurrent events and formulated the association of vaccination and prior infection with the rate of infection through the multiplicative intensity model.3 In addition, we used the Cox regression model4 to formulate the association of vaccination and prior infection with the hazard of hospitalization or death. We indexed time by calendar date to control for time-varying confounders (eg, type of circulating variant, level of community transmission) by comparing disease incidence between vaccinated and unvaccinated participants, as well as between previously infected and uninfected participants, on the same date.1,5
In the first set of analyses, the association parameters for 1-dose BNT162b2, 2-dose BNT162b2, 1-dose mRNA-1273, 2-dose mRNA-1273, and 1-dose Ad26.COV2.S, as well as for prior infection, were estimated simultaneously under a single model, such that the association of one exposure (vaccination or prior infection) with each outcome was estimated while adjusting for the other exposure and assuming no interaction. Participants were censored at the time of receipt of booster. The time-varying association of vaccination with each outcome was characterized by a continuous piecewise linear function of time elapsed since the first dose for the log rate ratio (RR) or hazard ratio (HR), with change points placed at approximately every month.1 The time-varying association of prior infection with each outcome was modeled in a similar manner, with positive results within 2 weeks of the initial diagnosis being treated as the same infection. Of note, only participants who survived their initial infection could be reinfected. Additional analyses were performed by allowing the associations of vaccination and prior infection with outcomes to depend on the time periods of vaccination and prior infection, respectively. Subgroup analysis by age (12-17, 18-34, 35-49, 50-64, and ≥65 years) was also planned.
The second set of analyses was concerned with estimating the effectiveness of the booster among participants who had completed a primary vaccine series. The time-varying association of booster with each outcome was characterized by a continuous piecewise linear function of time elapsed since boosting for the log RR or HR between booster and primary vaccination, with change points placed at approximately every month. The analyses on the outcome of infection were performed separately for 6 common combinations of primary and booster vaccines, whereas the analyses on the outcomes of hospitalization and death were performed for all combinations together because of small numbers of events.
The third set of analyses was designed to assess the interaction between booster vaccination and prior infection (ie, how the estimated effectiveness of the booster by itself depends on the prior infection status) among participants who had completed a primary vaccine series. The association parameters for prior infection among participants with primary vaccination and for booster among previously infected vs previously uninfected participants were estimated under a single model.
In all analyses, we included demographic variables (age, sex, race and ethnicity, geographic region, county-level vaccination rate) as covariates to adjust for potential confounding by individual characteristics and geographic location. We also included the date of primary series as a covariate when estimating booster parameters. The parameters in each model were estimated by maximizing the partial likelihood with potentially censored observations.3,4 The effectiveness of vaccination or prior infection was estimated by 1 minus the estimated RR or HR multiplied by 100%; corresponding 95% CIs were constructed.
Some individuals with COVID-19 were not contacted to gather information about clinical outcomes. Analysis on the outcome of hospitalization or death was based on complete cases (ie, participants with known hospitalization status or known survival status).
The details of the statistical analysis, including the sensitivity analysis with missing data, are shown in the eMethods in the Supplement. Given the large number of analyses and the absence of a priori hypotheses, the study findings should be interpreted as exploratory. All analyses were performed in the R package DOVE3.
Results
Study Population
The Table summarizes demographic characteristics, vaccine uptakes, and clinical outcomes of the study cohort. The state of North Carolina has a total of 10 600 823 residents, 67% of whom had received at least 1 dose of a COVID-19 vaccine. The administration of the 3 vaccines varied over time (eFigures 1-2 in the Supplement). From March 2, 2020, to June 3, 2022, a total of 2 771 364 cases of SARS-CoV-2 infection were reported, among which 62 420 were known to cause hospitalization and 24 561 were known to cause death.
Table. Demographic Characteristics of the North Carolina Population According to Vaccine Uptake and Clinical Outcomes From March 2, 2020, to June 3, 2022.
| Characteristic | Vaccine uptake, No.a | Clinical outcomes, No.b | Overall | |||||||||
|---|---|---|---|---|---|---|---|---|---|---|---|---|
| BNT162b2 | mRNA-1273 | Ad26.COV2.S | Infection | Hospitalization | Death | |||||||
| 1 dose | Primary | Booster | 1 dose | Primary | Booster | Primary | Booster | |||||
| All residents | 266 820 | 3 521 440 | 1 672 497 | 151 174 | 2 160 179 | 1 201 961 | 440 129 | 150 531 | 2 771 364 | 62 420/984 768 | 24 561/1 702 256 | 10 600 823 |
| Age, median (IQR), y | 28 (15-45) | 42 (23-60) | 53 (35-67) | 42 (28-58) | 55 (39-68) | 60 (46-70) | 44 (30-57) | 48 (33-59) | 34 (20-51) | 64 (51-75) | 72 (62-82) | 39 (20-58) |
| Age group, y | ||||||||||||
| ≤11 | 46 281 | 312 607 | 27 553 | 35 | 125 | 15 | 19 | 2 | 325 324 | 620/121 020 | 9/202 982 | 1 499 766 |
| 12-17 | 36 292 | 363 652 | 113 738 | 3977 | 23 069 | 7649 | 8907 | 2755 | 231 970 | 614/85 854 | 25/144 954 | 806 634 |
| 18-34 | 80 665 | 731 234 | 259 252 | 52 120 | 405 105 | 145 003 | 136 681 | 38 125 | 862 437 | 4635/278 731 | 395/506 228 | 2 432 304 |
| 35-49 | 52 359 | 712 138 | 332 531 | 37 249 | 451 429 | 213 501 | 118 411 | 39 626 | 598 863 | 8421/200 985 | 1588/358 406 | 1 991 144 |
| 50-64 | 35 545 | 726 446 | 434 645 | 32 606 | 599 483 | 359 386 | 132 083 | 53 786 | 467 804 | 17 299/172 532 | 5327/293 632 | 2 056 433 |
| ≥65 | 15 678 | 675 363 | 504 778 | 25 187 | 680 968 | 476 407 | 44 028 | 16 237 | 284 966 | 30 831/125 646 | 17 217/196 054 | 1 814 542 |
| Sex | ||||||||||||
| Female | 134 774 | 1 946 199 | 953 901 | 77 354 | 1 189 186 | 673 136 | 199 930 | 73 615 | 1 498 740 | 30 670/529 310 | 11 473/914 635 | 5 448 241 |
| Male | 132 046 | 1 575 241 | 718 596 | 73 820 | 970 993 | 528 825 | 240 199 | 76 916 | 1 272 624 | 31 750/455 458 | 13 088/787 621 | 5 152 582 |
| Racec | ||||||||||||
| American Indian or Alaska Native | 4800 | 40 313 | 15 022 | 2517 | 25 918 | 12 221 | 4511 | 1262 | 47 376 | 926/16 620 | 363/32 167 | 180 238 |
| Asian or Pacific Islander | 12 066 | 203 474 | 101 847 | 4533 | 75 429 | 44 083 | 17 984 | 7609 | 85 598 | 916/24 357 | 321/45 348 | 391 163 |
| Black | 80 646 | 776 233 | 320 844 | 42 077 | 485 985 | 261 564 | 83 356 | 28 901 | 695 984 | 17 645/244 116 | 5790/412 844 | 2 453 861 |
| White | 169 308 | 2 501 420 | 1 234 784 | 102 047 | 1 572 847 | 884 093 | 334 278 | 112 759 | 1 942 406 | 42 933/699 675 | 18 087/1 211 897 | 7 575 561 |
| Ethnicityc | ||||||||||||
| Hispanic | 48 254 | 397 174 | 124 722 | 20 749 | 189 585 | 79 127 | 52 628 | 14 658 | 373 796 | 8008/151 187 | 2339/234 746 | 1 052 435 |
| Non-Hispanic | 218 566 | 3 124 266 | 1 547 775 | 130 425 | 1 970 594 | 1 122 834 | 387 501 | 135 873 | 2 397 568 | 54 412/833 581 | 22 222/1 467 510 | 9 548 388 |
| Geographic region | ||||||||||||
| Coastal | 67 375 | 716 451 | 307 791 | 48 153 | 662 530 | 356 515 | 106 600 | 29 816 | 771 824 | 21 208/327 274 | 7394/577 854 | 2 934 844 |
| Piedmont | 179 692 | 2 544 081 | 1 237 977 | 84 102 | 1 174 561 | 658 566 | 269 373 | 99 148 | 1 719 011 | 35 541/542 876 | 13 601/902 918 | 6 501 788 |
| Mountain | 19 753 | 260 908 | 126 729 | 18 919 | 323 088 | 186 880 | 64 156 | 21 567 | 280 529 | 5671/114 618 | 3566/221 484 | 1 164 191 |
| County-level vaccination rate, % | ||||||||||||
| <59 | 68 294 | 701 427 | 286 293 | 49 909 | 676 947 | 356 752 | 95 089 | 25 471 | 873 533 | 26 409/365 102 | 10 140/612 511 | 3 206 679 |
| 59-70 | 91 664 | 1 261 685 | 592 904 | 58 964 | 864 188 | 482 467 | 163 707 | 52 933 | 1 015 420 | 24 990/385 648 | 9769/694 929 | 3 966 835 |
| >70 | 106 862 | 1 558 328 | 793 300 | 42 301 | 619 044 | 362 742 | 181 333 | 72 127 | 882 411 | 11 021/234 018 | 4652/394 816 | 3 427 309 |
The “1 dose” column shows the number of participants who have received only 1 dose, the “Primary” column shows the number of participants who have completed the primary series, and the “Booster” column shows the number of participants who have received at least 1 booster dose of any vaccine.
Numbers of infections and hospitalizations are reported, including reinfections and rehospitalizations from the same individual. There are missing data on hospitalization and death. Numbers of known hospitalizations and deaths are shown in the numerator and numbers of infections with known hospitalization and survival status are shown in the denominator.
Race and ethnicity are self-reported using prefixed categories.
Association of Primary Vaccination With Outcomes
Figure 1A-C and eTable 1A-C in the Supplement show the estimates for the effectiveness of primary vaccination in reducing the rate of SARS-CoV-2 infection and the hazard of hospitalization or death. The adjusted RR of the BNT162b2 2-dose regimen against infection was 0.46 (95% CI, 0.45-0.46) (estimated effectiveness, 54.3% [95% CI, 53.6%-55.0%]), the adjusted HR against hospitalization was 0.14 (95% CI, 0.12-0.16) (estimated effectiveness, 85.8% [95% CI, 83.7%-87.7%]), and the adjusted HR against death was 0.10 (95% CI, 0.08-0.13) (estimated effectiveness, 89.6% [95% CI, 87.0%-91.6%]) at 7 months after the first dose; at 12 months after the first dose, and the adjusted RR against infection was 0.63 (95% CI, 0.61-0.64) (estimated effectiveness, 37.5% [95% CI, 36.0%-39.0%]), the adjusted HR against hospitalization was 0.41 (95% CI, 0.34-0.51) (estimated effectiveness, 58.8% [95% CI, 49.3%-66.5%]), and the adjusted HR against death was 0.25 (95% CI, 0.19-0.32) (estimated effectiveness, 75.2% [95% CI, 67.7%-81.0%]). The adjusted RR of the mRNA-1273 2-dose regimen against infection was 0.31 (95% CI, 0.30-0.32) (estimated effectiveness, 69.2% [95% CI, 68.5%-69.9%]), the adjusted HR against hospitalization was 0.10 (95% CI, 0.09-0.12) (estimated effectiveness, 89.8% [95% CI, 88.1%-91.3%]), and the adjusted HR against death was 0.07 (95% CI, 0.06-0.09) (estimated effectiveness, 93.0% [95% CI, 91.1%-94.5%]) at 7 months after the first dose; at 12 months after the first dose, the adjusted RR for infection was 0.53 (95% CI, 0.52-0.54) (estimated effectiveness, 47.2% [95% CI, 45.8%-48.5%]), the adjusted HR for hospitalization was 0.35 (95% CI, 0.29-0.43) (estimated effectiveness, 64.7% [95% CI, 57.2%-70.9%]), and the adjusted HR for death was 0.30 (95% CI, 0.25-0.38) (estimated effectiveness, 69.6% [95% CI, 62.3%-75.5%]). The adjusted RR of the Ad26.COV2.S single-dose regimen against infection was 0.40 (95% CI, 0.38-0.42) (estimated effectiveness, 60.2% [95% CI, 58.3%-62.0%]), the adjusted HR against hospitalization was 0.30 (95% CI, 0.24-0.39) (estimated effectiveness, 69.7% [95% CI, 60.8%-76.5%]), and the adjusted HR against death was 0.23 (95% CI, 0.16-0.34) (estimated effectiveness, 76.7% [95% CI, 65.9%-84.0%]) at 7 months; at 12 months, the adjusted RR against infection was 0.49 (95% CI, 0.45-0.54) (estimated effectiveness, 50.7% [95% CI, 46.3%-54.7%]), the adjusted HR against hospitalization was 0.44 (95% CI, 0.32-0.59) (estimated effectiveness, 56.3% [95% CI, 41.0%-67.7%]), and the adjusted HR against death was 0.26 (95% CI, 0.14-0.50) (estimated effectiveness, 73.6% [95% CI, 50.4%-85.9%]). eFigure 3 in the Supplement compares the 3 vaccines for each outcome.
Figure 1. Effectiveness of Primary Vaccination Series and Prior Infection in Reducing the Risk of SARS-CoV-2 Infection, Hospitalization, or Death.
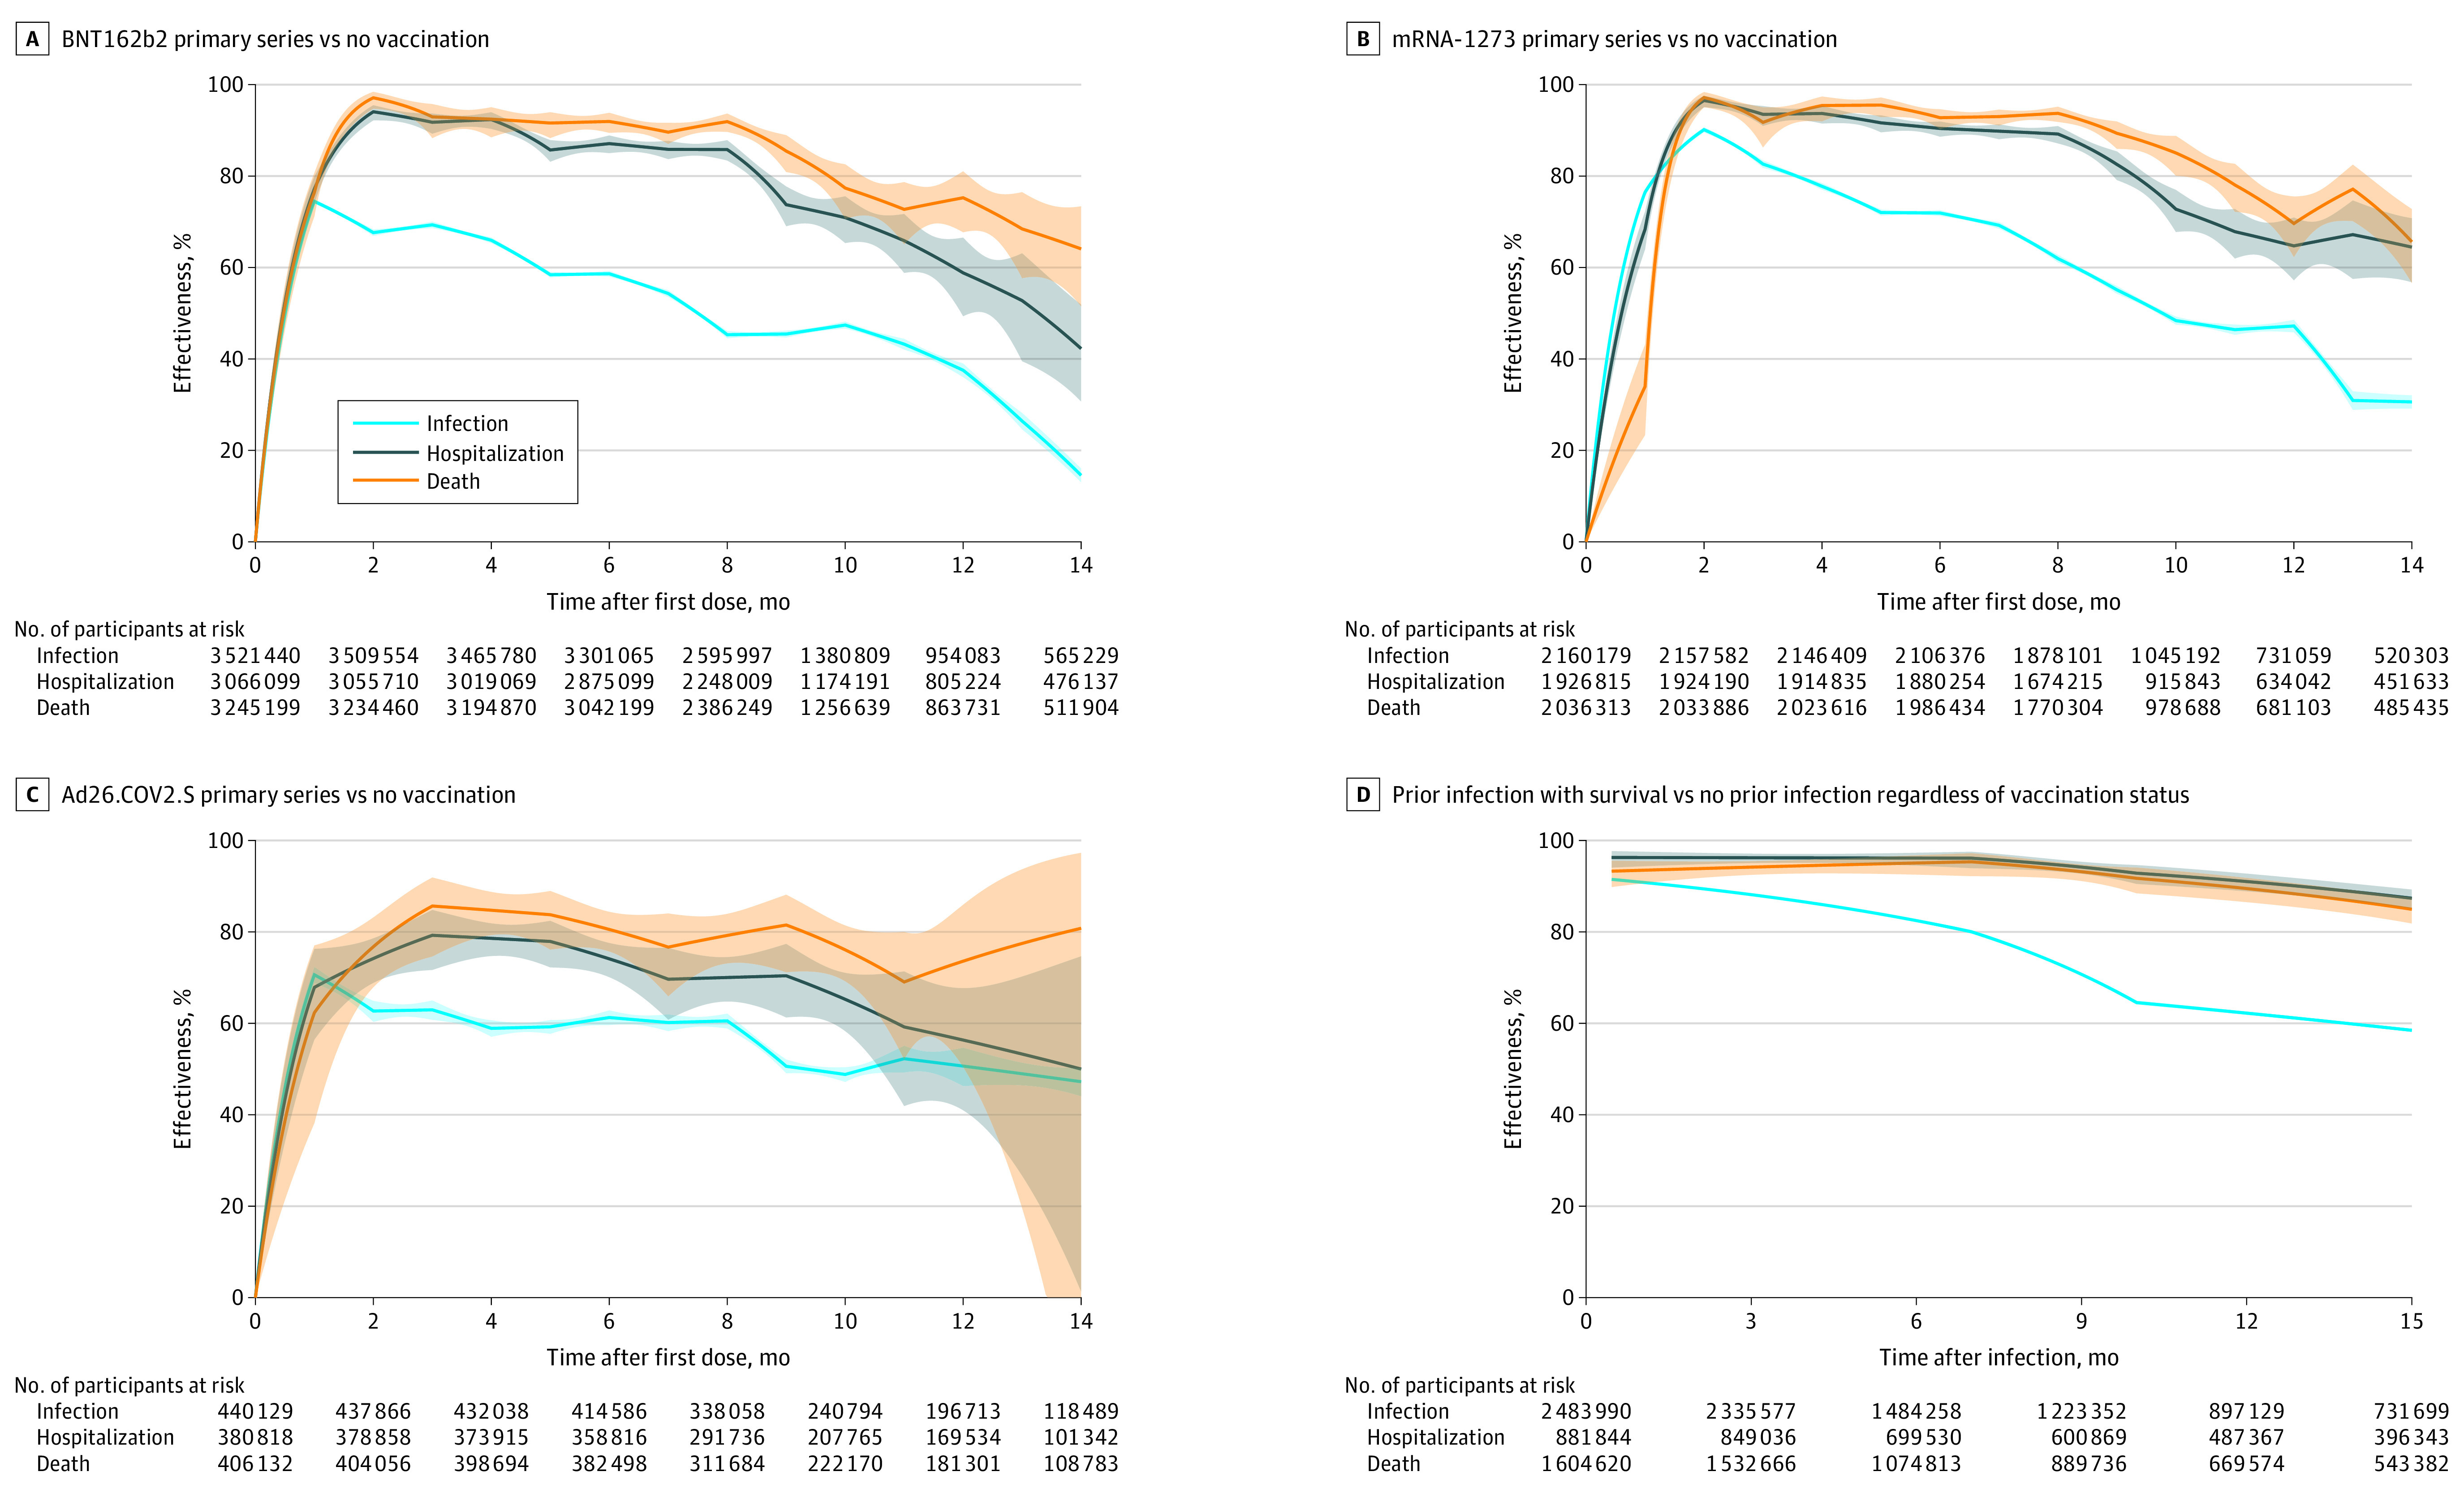
Estimates of effectiveness are shown by solid curves, and 95% CIs are shown by shaded bands. The steep upward trends seen early in panels A-C, but not in panel D, represent the ramp-up period of vaccination. Each curve is truncated at 15 months or when the number at risk hits 15% of the relevant sample. D, Comparison of prior infection with survival to no prior infection among all participants (vaccinated and not), with 98.6% of all participants surviving the prior infection. Home testing for infection is not included. Further detail can be found in eTable 1 in the Supplement.
Figure 2A-I and eTable 2A-I in the Supplement show estimates for the effectiveness of the 3 primary vaccine series by vaccine cohort (ie, participants vaccinated during a specific time period). For participants vaccinated between December 2020 and March 2021, the adjusted RR of the primary BNT162b2 series against infection varied from 0.35 (95% CI, 0.34-0.36) (estimated effectiveness, 65.2% [95% CI, 64.3%-66.1%]) at 7 months to 0.56 (95% CI, 0.55-0.58) (estimated effectiveness, 43.7% [95% CI, 42.3%-45.1%]) at 9 months (when the Omicron variant emerged), the adjusted RR of the primary mRNA-1273 series against infection varied from 0.25 (95% CI, 0.24-0.25) (estimated effectiveness, 75.4% [95% CI, 74.6%-76.2%]) at 7 months to 0.41 (95% CI, 0.40-0.42) (estimated effectiveness, 59.0% [95% CI, 57.7%-60.3%]) at 9 months, and the adjusted RR of the single-dose Ad26.COV2.S vaccine against infection varied from 0.41 (95% CI, 0.37-0.45) (estimated effectiveness, 59.1% [95% CI, 55.2%-62.6%]) at 7 months to 0.63 (95% CI, 0.59-0.67) (estimated effectiveness, 37.3% [95% CI, 32.9%-41.5%]) at 9 months.
Figure 2. Effectiveness of Primary Vaccination Series by Date of First Dose and of Prior Infection by Type of Variant in Reducing the Risk of SARS-CoV-2 Infection, Hospitalization, or Death.

A-I, Each batch corresponds to 2 months, but may contain more months to achieve a large number of vaccinated individuals. J-L, Comparison of prior infection with survival to all participants with no prior infection regardless of vaccination status, with 98.6% of all participants surviving the prior infection. Home testing for infection is not included. The color bars indicate predominant variants. Estimates of effectiveness are shown by solid curves, and 95% CIs are shown by shaded bands. Each curve starts at the median date of each batch and is truncated when the number at risk hits 15% of the relevant sample. Further detail, including numbers at risk, can be found in eTable 2 in the Supplement.
Estimated vaccine effectiveness varied across age groups (eFigure 4A-I in the Supplement). Interpreting the differences should account for the different vaccine schedules among age groups (eFigure 2 in the Supplement).
Association of Prior Infection With Outcomes
Figure 1D and eTable 1D in the Supplement show the estimates for the effectiveness of prior SARS-CoV-2 infection compared with no prior infection in reducing the rate of future infection and the risk of hospitalization or death caused by reinfection (assuming the same immunity conferred by prior infection itself for the vaccinated and unvaccinated participants) given those who survived initial infection. The adjusted RR against future infection was 0.14 (95% CI, 0.13-0.14) (estimated effectiveness, 86.5% [95% CI, 86.3%-86.6%]), the adjusted HR against future hospitalization was 0.04 (95% CI, 0.03-0.05) (estimated effectiveness, 96.2% [95% CI, 95.1%-97.0%]), and the adjusted HR against death was 0.06 (95% CI, 0.04-0.07) (estimated effectiveness, 94.5% [95% CI, 92.8%-95.8%]) after 4 months; the adjusted RR against future infection was 0.24 (95% CI, 0.24-0.25) (estimated effectiveness, 75.8% [95% CI, 75.5%-76.1%]), the adjusted HR against hospitalization was 0.05 (95% CI, 0.04-0.06) (estimated effectiveness, 95.2% [95% CI, 93.6%-96.5%]), and the adjusted HR against death was 0.06 (95% CI, 0.04-0.08) (estimated effectiveness, 94.4% [95% CI, 92.0%-96.0%]) after 8 months; and the adjusted RR against infection was 0.38 (95% CI, 0.37-0.38) (estimated effectiveness, 62.2% [95% CI, 61.9%-62.6%]), the adjusted HR against hospitalization was 0.09 (95% CI, 0.07-0.11) (estimated effectiveness, 91.0% [95% CI, 88.9%-92.7%]), and the adjusted HR against death was 0.11 (95% CI, 0.08-0.14) (estimated effectiveness, 89.5% [95% CI, 86.5%-91.8%]) after 12 months. The estimates across age groups are shown in eFigure4 J-L in the Supplement.
Figure 2J-L and eTable 2J-L in the Supplement show the estimates for the effectiveness of prior SARS-CoV-2 infection with different variants against reinfection and resulting hospitalization and death. The adjusted RR of Omicron infection against reinfection was 0.23 (95% CI, 0.22-0.24) (estimated effectiveness, 76.8% [95% CI, 75.7%-78.0%]) after 4 months. The adjusted HR of Delta or Omicron infection against hospitalization caused by reinfection was 0.12 (95% CI, 0.08-0.17) (estimated effectiveness, 88.1% [95% CI, 82.9%-91.7%]) and against death caused by reinfection was 0.13 (95% CI, 0.09-0.18) (estimated effectiveness, 87.0% [95% CI, 81.6%-90.9%]) after 5 months.
Association of Booster Vaccination With Outcomes
Figure 3A-F and eTable 3A-F in the Supplement show the estimates for the relative effectiveness of the 6 common combinations of primary and booster vaccines, compared with the primary series only, in reducing the rate of SARS-CoV-2 infection. Estimated relative effectiveness peaked around 2 to 4 weeks, then declined over time. The adjusted RR of receiving a third dose of BNT162b2 between September 22, 2021, and November 30, 2021, was 0.33 (95% CI, 0.32-0.35) (estimated effectiveness, 66.8% [95% CI, 65.0%-68.5%]) and in December 2021 was 0.39 (95% CI, 0.38-0.40) (estimated effectiveness, 61.2% [95% CI, 60.0-62.4]) after 1 month and, after 3 months, the RR of receiving the third dose between September 22, 2021, and November 30, 2021, was 0.61 (95% CI, 0.60-0.62) (estimated effectiveness, 39.3% [95% CI, 38.4%-40.3%]) and in December 2021 was 0.84 (95% CI, 0.82-0.86) (estimated effectiveness, 16.2% [95% CI, 13.9%-18.3%]). Estimates varied across age groups (eFigure 5A-F in the Supplement).
Figure 3. Effectiveness of Booster Vaccination Relative to Primary Series Only by Date of Booster in Reducing the Risk of SARS-CoV-2 Infection, Hospitalization, or Death.

The dates of booster were grouped into 2-4 batches, such that each batch contains a large number of booster doses; the US Food and Drug Administration recommended booster doses on September 22, 2021. Home testing for infection is not included. The color bars indicate predominant variants/linages. Estimates of effectiveness are shown by solid curves, and 95% CIs are shown by shaded bands. Each curve starts at the median date of each batch. Further detail, including numbers at risk, can be found in eTable 3 in the Supplement.
For the BNT162b2 primary series, boosting with BNT162b2 in December 2021 had the adjusted RR of 0.39 (95% CI, 0.38-0.40) (estimated effectiveness, 61.2% [95% CI, 60.0%-62.4%]) after 1 month and 0.84 (95% CI, 0.82-0.86) (estimated effectiveness, 16.2% [95% CI, 13.9%-18.3%]) after 3 months, whereas boosting with mRNA-1273 in December 2021 reduced the adjusted RR to 0.32 (95% CI, 0.30-0.34) (estimated effectiveness, 68.4% [95% CI, 66.2%-70.5%]) after 1 month and 0.60 (95% CI, 0.57-0.62) (estimated effectiveness, 40.5% [95% CI, 37.7%-43.2%]) after 3 months. For the mRNA-1273 primary series, boosting with mRNA-1273 in December 2021 had the adjusted RR of 0.38 (95% CI, 0.37-0.39) (estimated effectiveness, 62.1% [95% CI, 60.7%-63.5%]) after 1 month and 0.85 (95% CI, 0.83-0.88) (estimated effectiveness, 14.7% [95% CI, 12.1%-17.3%]) after 3 months, whereas boosting with BNT162b2 in December 2021 reduced the adjusted RR to 0.34 (95% CI, 0.30-0.38) (estimated effectiveness, 66.1% [95% CI, 61.9%-70.0%]) after 1 month and 0.73 (95% CI, 0.66-0.80) (estimated effectiveness, 27.0% [95% CI, 19.6%-33.7%]) after 3 months.
Figure 3G-H and eTable 3G-H in the Supplement show the relative effectiveness against hospitalization and death. For participants receiving booster doses before September 22, 2021, when the US Food and Drug Administration recommended the BNT162b2 booster, the adjusted HR against hospitalization was 0.54 (95% CI, 0.28-1.00) (estimated effectiveness, 45.7% [95% CI, 0.0%-71.9%]) and death was 0.70 (95% CI, 0.31-1.00) (estimated effectiveness, 29.8% [95% CI, 0.0%-68.9%]) at 1 month, whereas for participants receiving booster doses between September 22, 2021, and November 30, 2021, the adjusted HR against hospitalization at 1 month was 0.14 (95% CI, 0.11-0.18) (estimated effectiveness, 85.8% [95% CI, 81.6%-89.1%]) and against death was 0.10 (95% CI, 0.06-0.16) (estimated effectiveness, 90.2% [95% CI, 84.3%-93.9%]).
The results from Figures 2 and 3 can be combined to estimate the effectiveness of the booster compared with no vaccination (Figure 4; eTable 4 in the Supplement). For participants who received the first dose of BNT162b2 in April 2021 to May 2021 and the third dose of BNT162b2 between September 22, 2021, and November 30, 2021, the adjusted RR of the booster relative to no vaccination against infection was 0.20 (95% CI, 0.19-0.21) (estimated effectiveness, 79.9% [95% CI, 78.8%-81.0%]) at 1 month and 0.60 (95% CI, 0.59-0.61) (estimated effectiveness, 40.5% [95% CI, 39.5%-41.4%]) at 5 months after boosting.
Figure 4. Effectiveness of Booster Vaccination Compared With No Vaccination in Reducing the Risk of SARS-CoV-2 Infection for Receipt of the First Dose in April – May 2021 and Receipt of Booster Dose Between September 22, 2021, and November 30, 2021, by Primary and Booster Combination.

Home testing for infection is not included. Estimates of effectiveness are shown by solid curves, and 95% CIs are shown by shaded bands. Further detail can be found in eTable 4 in the Supplement.
Interaction Between Booster Vaccination and Prior Infection
Figure 5 and eTable 5 in the Supplement show the interactions of booster vaccination and prior infection. Among participants without prior infection, the adjusted RR of booster vaccination (compared with primary series only) against SARS-CoV-2 infection was 0.37 (95% CI, 0.36-0.38) (estimated effectiveness, 62.9% [95% CI, 62.3%-63.6%]), the adjusted HR against hospitalization was 0.17 (95% CI, 0.13-0.22) (estimated effectiveness, 82.7% [95% CI, 77.6%-86.7%]), and the adjusted HR against death was 0.12 (95% CI, 0.08-0.19) (estimated effectiveness, 87.7% [95% CI, 80.9%-92.1%]) after 1 month; the adjusted RR against infection was 0.59 (95% CI, 0.58-0.60) (estimated effectiveness, 40.6% [95% CI, 39.7%-41.6%]), the adjusted HR against hospitalization was 0.27 (95% CI, 0.22-0.32) (estimated effectiveness, 73.3% [95% CI, 68.0%-77.7%]), and the adjusted HR against death was 0.22 (95% CI, 0.18-0.28) (estimated effectiveness, 77.8% [95% CI, 71.8%-82.5%]) after 3 months. Among participants with prior infection, the adjusted RR of booster vaccination against SARS-CoV-2 infection was 0.46 (95% CI, 0.43-0.49) (estimated effectiveness, 53.9% [95% CI, 50.8%-56.8%]) and the adjusted HR against hospitalization was 0.50 (95% CI, 0.30-0.84) (estimated effectiveness, 49.7% [95% CI, 16.2%-69.8%]) after 1 month, and the adjusted RR against infection was 0.80 (95% CI, 0.75-0.85) (estimated effectiveness, 20.3% [95% CI, 15.2%-25.2%]) and the adjusted HR for hospitalization was 0.56 (95% CI, 0.39-0.81) (estimated effectiveness, 43.8% [95% CI, 19.4%-60.9%]) after 3 months. Among all recipients of primary vaccination, the adjusted RR of prior infection compared with no prior infection against subsequent infection was 0.34 (95% CI, 0.33-0.35) (estimated effectiveness, 65.7% [95% CI, 64.6%-66.7%]) and the adjusted HR against subsequent hospitalization was 0.25 (95% CI, 0.18-0.34) (estimated effectiveness, 75.3% [95% CI, 65.7%-82.3%]) after 6 months; after 15 months, the adjusted RR against infection was 0.71 (95% CI, 0.69-0.72) (estimated effectiveness, 29.5% [95% CI, 27.7%-31.3%]) and the adjusted HR against hospitalization was 0.35 (95% CI, 0.29-0.43) (estimated effectiveness, 65.0% [95% CI, 57.3%-71.2%]).
Figure 5. Effectiveness of Booster Vaccination and Prior Infection in Reducing the Risk of SARS-CoV-2 Infection, Hospitalization, or Death Among Participants With Primary Vaccination.

C, Comparison of prior infection with survival to no prior infection among all recipients of primary vaccination regardless of boosting status, with 99.2% of primary vaccine recipients surviving the prior infection. Home testing for infection is not included. Estimates of effectiveness are shown by solid curves, and 95% CIs are shown by shaded bands. Results on the outcome of death are not shown in Panels B and C due to a small number of events. The steep upward trends seen early on in panels A and B, but not in panel C, represent the ramp-up period for booster. Each curve is truncated at 15 months or when the number at risk hits 15% of the relevant sample. Further detail can be found in eTable 5 in the Supplement.
The interaction between booster vaccination and prior infection is shown by primary and booster combination and by age group in eFigures 6 and 7 in the Supplement.
Sensitivity Analysis
Many individuals with COVID-19 were not contacted to determine clinical outcomes. Thus, hospitalization status was known for only 35.5% of SARS-CoV-2 infections and survival status was known for 63.2%. However, the proportions of missing records on hospitalization and death were similar between vaccinated and unvaccinated participants (eFigure 8 in the Supplement). A sensitivity analysis with missing data imputation (eMethods in the Supplement) yielded similar results (eFigures 9-10 in the Supplement).
Discussion
The findings from this study suggest that the estimated effectiveness of all 3 vaccines was high, especially against hospitalization and death, although the effectiveness decreased over time. After the emergence of the Omicron variant, the estimated vaccine effectiveness was lower against infection, but estimated effectiveness against hospitalization and death remained high. Previous SARS-CoV-2 infection was associated with lower risks of infection, hospitalization, and death. However, the protection waned over time, especially against the outcome of infection, and the risk of reinfection with Omicron became appreciable after 4 months. Boosting for previously uninfected persons was associated with protection, especially against hospitalization and death, while boosting also was associated with additional protection to previously infected individuals.
Estimated effectiveness of boosters (relative to primary series only) was found to wane rapidly over 4 to 6 months, especially during the period in which Omicron was predominant. To our knowledge, this result has not been previously reported, because the follow-up periods of previous studies were less than 4 months and only mean effectiveness over the study period was estimated.6,7,8,9
The association of vaccine boosters with Omicron infection was previously studied in Qatar and the UK.6,7 The Qatar study had a follow-up period of only 35 days. The UK study had follow-up of up to 9 weeks, but it did not consider severe outcomes. A recent study in US veterans found that heterologous boosting was associated with less protection than homologous boosting after mRNA primary vaccination, although there were only 362 infections.8 By contrast, the present study found that heterologous boosting was associated with greater protection than homologous boosting for mRNA vaccines.
A recent “test-negative” study of the US adult population assessed the association between 3 doses of mRNA vaccine and symptomatic infection by Delta and Omicron variants.9 However, disease incidence was ascertained for 3 weeks (December 10, 2021, to January 1, 2022), and severe outcomes were not considered.
Several other studies also found that infection with SARS-CoV-2 was associated with protection against reinfection.10,11,12,13 However, only 1 study assessed the protection of Omicron infection against reinfection with Omicron.13 That study had only 15 days of follow-up and did not investigate the outcomes of hospitalization or death caused by reinfection.
Limitations
This study has several limitations. First, there was potential confounding bias. All analyses adjusted for demographic factors and avoided confounding due to time trends. However, it was not possible to control for unmeasured confounders, such as masking and other preventive measures. Second, many infections, especially milder cases, are undiagnosed or unreported, and the state does not collect at-home testing results. In addition, there were substantial missing data on hospitalization and death. As at-home testing increased in availability in January 2022, the data on infection became less reliable, although this should not have had the same effect on rates of hospitalization and death. Estimates of vaccine effectiveness would be biased if ascertainment varied by vaccination status, and estimates for effectiveness of prior infection would be diluted by underreporting of prior infections. Third, the models did not account for non–COVID-19 deaths, and the effectiveness of prior infection was assessed without considering its severity and only among the survivors, although only 1% of infected individuals died. Fourth, migration during the pandemic was not accounted for. Fifth, the COVID-19 vaccine management system does not include vaccination through a federal entity (Department of Defense, Veterans Health Administration, Indian Health Service, Federal Bureau of Prisons), which included approximately 6% of the total first doses administered in the state. Sixth, additional doses for participants who are immunocompromised were not separated from booster doses, so the estimated effectiveness of boosters might be diluted. Seventh, this study was based on data from a single state. Although North Carolina is similar to the US population in terms of demographics, circulating variants, and vaccination programs, there might be individual-level characteristics (socioeconomic, behavioral) or state-level characteristics (lockdowns or mandates) that differ across the country. Eighth, the boosters included in this study may soon be supplanted by boosters directed at the newer subvariants. Additional studies would be required to estimate effectiveness of new boosters.
Conclusions
Receipt of primary COVID-19 vaccine series compared with being unvaccinated, receipt of boosters compared with primary vaccination, and prior infection compared with no prior infection were all significantly associated with lower risk of SARS-CoV-2 infection (including Omicron) and resulting hospitalization and death. The associated protection waned over time, especially against infection.
eMethods
eFigures
eTables
References
- 1.Lin D-Y, Gu Y, Wheeler B, et al. Effectiveness of Covid-19 vaccines over a 9-month period in North Carolina. N Engl J Med. 2022;386(10):933-941. doi: 10.1056/NEJMoa2117128 [DOI] [PMC free article] [PubMed] [Google Scholar]
- 2.US Dept of Health and Human Services . COVID-19 Pandemic Response, Laboratory Data Reporting: CARES Act Section 18115. Updated January 8, 2021. Accessed January 11, 2022. https://www.hhs.gov/sites/default/files/covid-19-laboratory-data-reporting-guidance.pdf
- 3.Andersen PK, Gill RD. Cox’s regression model for counting processes: a large sample study. Ann Stat. 1982;10(4):1100-1120. doi: 10.1214/aos/1176345976 [DOI] [Google Scholar]
- 4.Cox DR. Regression models and life-tables. J R Stat Soc B. 1972;34(2):187-202. [Google Scholar]
- 5.Fintzi J, Follmann D. Assessing vaccine durability in randomized trials following placebo crossover. Stat Med. 2021;40(27):5983-6007. doi: 10.1002/sim.9001 [DOI] [PMC free article] [PubMed] [Google Scholar]
- 6.Andrews N, Stowe J, Kirsebom F, et al. Covid-19 vaccine effectiveness against the omicron (B.1.1.529) variant. N Engl J Med. 2022;386(16):1532-1546. doi: 10.1056/NEJMoa2119451 [DOI] [PMC free article] [PubMed] [Google Scholar]
- 7.Abu-Raddad LJ, Chemaitelly H, Ayoub HH, et al. Effect of mRNA vaccine boosters against SARS-CoV-2 omicron infection in Qatar. N Engl J Med. 2022;386(19):1804-1816. doi: 10.1056/NEJMoa2200797 [DOI] [PMC free article] [PubMed] [Google Scholar]
- 8.Mayr FB, Talisa VB, Shaikh O, Yende S, Butt AA. Effectiveness of homologous or heterologous Covid-19 boosters in veterans. N Engl J Med. 2022;386(14):1375-1377. doi: 10.1056/NEJMc2200415 [DOI] [PMC free article] [PubMed] [Google Scholar]
- 9.Accorsi EK, Britton A, Fleming-Dutra KE, et al. Association between 3 doses of mRNA COVID-19 vaccine and symptomatic infection caused by the SARS-CoV-2 Omicron and Delta variants. JAMA. 2022;327(7):639-651. doi: 10.1001/jama.2022.0470 [DOI] [PMC free article] [PubMed] [Google Scholar]
- 10.Goldberg Y, Mandel M, Bar-On YM, et al. Protection and waning of natural and hybrid immunity to SARS-CoV-2. N Engl J Med. 2022;386(23):2201-2212. doi: 10.1056/NEJMoa2118946 [DOI] [PMC free article] [PubMed] [Google Scholar]
- 11.Hall V, Foulkes S, Insalata F, et al. ; SIREN Study Group . Protection against SARS-CoV-2 after Covid-19 vaccination and previous infection. N Engl J Med. 2022;386(13):1207-1220. doi: 10.1056/NEJMoa2118691 [DOI] [PMC free article] [PubMed] [Google Scholar]
- 12.Altarawneh HN, Chemaitelly H, Hasan MR, et al. Protection against the omicron variant from previous SARS-CoV-2 infection. N Engl J Med. 2022;386(13):1288-1290. doi: 10.1056/NEJMc2200133 [DOI] [PMC free article] [PubMed] [Google Scholar]
- 13.Chemaitelly H, Ayoub HH, Coyle P, et al. Protection of omicron sub-lineage infection against reinfection with another Omicron sub-lineage. Nat Commun. 2022;13(1):4675. doi: 10.1038/s41467-022-32363-4 [DOI] [PMC free article] [PubMed] [Google Scholar]
Associated Data
This section collects any data citations, data availability statements, or supplementary materials included in this article.
Supplementary Materials
eMethods
eFigures
eTables