

Abstract
Uterine serous carcinoma (USC), an aggressive variant of endometrial cancer representing approximately 10% of endometrial cancer diagnoses, accounts for ∼39% of endometrial cancer-related deaths. We examined the role of genomic alterations in advanced-stage USC associated with outcome using paired primary-metastatic tumors (n = 29) treated with adjuvant platinum and taxane chemotherapy. Comparative genomic analysis of paired primary-metastatic patient tumors included whole exome sequencing and targeted gene expression. Both PLK3 amplification and the tumor immune microenvironment (TIME) in metastatic tumors were linked to time-to-recurrence (TTR) risk without any such association observed with primary tumors. TP53 loss was significantly more frequent in metastatic tumors of platinum-resistant versus platinum-sensitive patients and was also associated with increased recurrence and mortality risk. Increased levels of chr1 breakpoints in USC metastatic versus primary tumors co-occur with PLK3 amplification. PLK3 and the TIME are potential targets for improving outcomes in USC adjuvant therapy.
Graphical Abstract
Graphical Abstract.
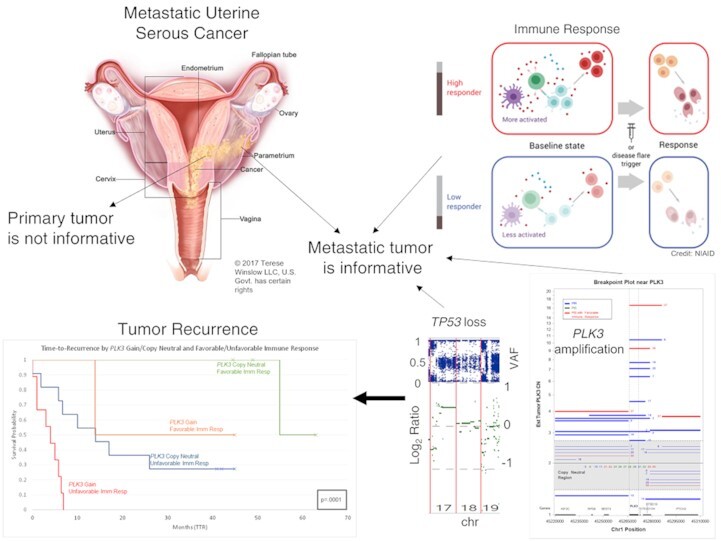
PLK3 amplifications, TP53 loss, and immune status of the metastatic (and not the primary) tumor are highly informative for outcomes in metastatic uterine serous cancer. The metastatic uterine cancer illustration is used with permission © 2017 Terese Winslow LLC, U.S. Govt. has certain rights. Also, the Immune Response figure is from the US NIAID.
INTRODUCTION
Endometrial cancer remains the most common gynecologic malignancy in the United States. In 2021, it was estimated that 66 570 new cases of endometrial cancer would be diagnosed, and 12 940 deaths would occur, a 30% increase over the past 10 years (1). Based on the Surveillance, Epidemiology, and End Results (SEER) database, it is suggested that the increase in mortality may be related to an increased rate of advanced stage cancers and high-risk histology (2) such as uterine serous carcinoma (USC).
Although USC represents ∼10% of all endometrial cancer diagnoses, it accounts for up to 39% of endometrial cancer related deaths (3–5). This disproportionate difference between incidence and death emphasizes the need for an understanding of USC etiology to improve treatment strategies. Risk factors for USC include breast cancer, BRCA gene mutation, and history of tamoxifen therapy. Molecular abnormalities include p53 mutations and HER-2/neu gene amplification (4). Poor prognosis of stage III and IV USC occurs in 40% of patients compared to 15% of patients with more common endometrioid endometrial carcinoma (4,5).
Substantive results utilizing paired primary and metastatic samples that examine somatic copy number alterations (sCNA) in addition to point mutations are relatively rare. A study of metastatic breast cancer paired primary breast cancer and metastatic brain tumors from 14 patients identified more sCNAs and higher tumor mutational burden in metastatic brain than in the primary breast cancer (6). Conversely, a separate study of 33 matched primary and recurrent metastatic breast cancer samples found a high rate of concordance (up to 85%) between them (7). Kawamata et al. (8) and Vakiani et al. (9) in studies of 16 and 84 patients, respectively identified relatively few interesting differences between paired primary and metastatic colorectal cancers. Perhaps more relevant to our study, Gibson et al. (10) examined 35 paired primary-metastatic cases of endometrial cancer (EC) constituting both endometrioid (26 cases) and non-endometrioid (nine cases of serous, clear-cell, etc.) types. The serous subtype within non-endometrioid tumors tend to be more deleterious with poor outcomes. In general, Gibson found similar magnitudes of somatic mutations and sCNAs between primary and metastatic pairs, although there were a handful of exceptions in the endometrioid subtype where metastatic samples had >90% genome-wide sCNA while the paired primary had <25% of its genome affected. However, whether EC patients had similar or different primary-metastatic pair genomic characteristics, Gibson provided no analysis of metastatic characteristics with clinical outcomes.
We have previously identified genes associated with responsiveness to platinum-based chemotherapy in high grade serous ovarian cancer (11,12). More recently, we characterized the tumor immune microenvironment (TIME) and associated it with long term disease-free survival in high grade serous ovarian, uterine corpus endometrial and high mutational load breast cancer (13). In this study, we examined paired primary and metastatic tumor samples of 29 high grade USC metastatic patients treated with adjuvant platinum and taxane chemotherapy to determine the association of genomic alterations at either tumor site with outcome. Genomic analysis of paired primary and metastatic tumors with the Nanostring Pan Cancer IO360 panel and whole exome sequencing (WES) revealed that sCNA and the TIME in the metastatic tumor and not the primary tumor were linked to outcomes following adjuvant platinum-based chemotherapy.
MATERIALS AND METHODS
Study population
After obtaining Institutional Review Board approval (Atrium Health, Research Protocol Approval, IRB File# 07019-23E), women who underwent standard surgical staging for serous endometrial carcinoma at Carolinas Medical Center by the Gynecology Oncology group at Levine Cancer Institute from 1 January 2014 to 30 December 2018, were identified through the Levine Cancer Institute tumor registry and the Carolinas Medical Center pathology database. Inclusion criteria were serous histology, primary surgical staging (hysterectomy, bilateral salpingo-oophorectomy, lymphadenectomy, omentectomy and resection of metastatic tumor), Stage III or IV disease, and treatment with adjuvant platinum- and taxane-based chemotherapy (NCCN Clinical Practice Guidelines in Oncology – Uterine Neoplasms, Versions 1-2022; http://www.nccn.org/professionals/physicians-gls/pdf/uterine.pdf).
Histologic analysis
All specimens were fixed in 10% formalin, paraffin-embedded and stained with hematoxylin and eosin. Slides from all specimens were reviewed by a gynecologic pathologist to confirm diagnosis while primary and metastatic tumor blocks containing sufficient tumor volume and cellularity were used for genomic analysis. Tumor regions on slides were marked to assist with macrodissection for enrichment of tumor.
Genomic analysis
Archived formalin-fixed paraffin-embedded tumor blocks of paired primary and metastatic tumor from 29 patients with complete clinical treatment/response information were used to obtain 5–8 unstained slides sectioned at 10-μm thickness. The unstained tissue sections were used for extraction of RNA and DNA. We used Qiagen's Allprep DNA/RNA FFPE kit to simultaneously purify genomic DNA and total RNA from formalin-fixed, paraffin embedded (FFPE) tissue sections.
DNA and RNA were released sequentially by differential solubilization of the same FFPE sample. FFPE tissue sections were first deparaffinized using xylene. The tissue was then digested with proteinase K to enable cell lysis and release of the RNA into the supernatant while the DNA and other insoluble material are precipitated. The sample was then centrifuged to separate the RNA containing supernatant from the DNA containing pellet. The RNA containing supernatant was heated to partially reverse formalin crosslinks before application to a RNeasy Mini spin column where the total RNA was bound to the membrane. An on-column DNase digestion was performed to ensure purification of DNA-free RNA. Following DNase digestion, contaminants were removed through column washing and total RNA was eluted in Nuclease-free water.
After removal of the supernatant containing the RNA, the DNA pellet was further digested with proteinase K to release the genomic DNA. The DNA containing supernatant was heated to partially reverse formalin crosslinking. The supernatant was then applied to a QIAamp MinElute spin column where the genomic DNA was bound to the membrane and contaminants were removed through subsequent membrane washes. The genomic DNA was then eluted in ATE buffer.
Comparative genomic analysis of paired primary and metastatic patient tumor samples included: (a) NanoString PanCancer IO 360 Gene Expression Panel assay to characterize differing tumor microenvironments and (b) WES to characterize small and copy number (CN) variants. Small variants are defined as single nucleotide variants (SNVs) or short insertions/deletions (indels) typically <100 bases in size.
The NanoString PanCancer IO 360 Gene Expression Panel assays 770 genes, reflective of three important components of the tumor microenvironment, the tumor cells, the immune response, and the stromal cells. Isolated RNA was assessed by sample source using TapeStation for the percentage of fragments (fragmentation score) between 50 and 300 nt. Based on a linear function that increased input for higher fragmentation scores, the input level for samples ranged from 100 to 1000 ng in proportion to the fragmentation score (higher scores implied higher levels of fragmentation which led to higher input levels to the assay). After the first round of testing, all 60 samples were evaluated for provenance and consistency between paired samples. Several samples were repeated at the same or higher input levels to potentially boost detection rates for some samples that initially had low detection rates. Analysis went forward with the best of the two runs for each sample based on detection rates. A small subset of samples (patient ID #1 Met, patient ID #9 Met and Primary, patient ID #12 Met, patient ID #20 Distant Met, and patient ID#28, Primary) yielded unacceptable NanoString results from either run. All samples that had unacceptable results had high fragmentation scores between 89% and 94% which were at the upper end of the fragmentation score range [47%, 96%].
Analysis of gene expression from the NanoString PanCancer IO360 was split into two gene groups. One group of nearly 350 genes were primarily associated with cancer (common signaling pathways, cell cycle and proliferation, and tumor-intrinsic factors) while the remaining genes were used to support immune-related analysis. Information on the IO360 content is available at https://nanostring.com/support-documents/io-360-gene-list/.
For WES, we used the Agilent SureSelect Human All Exon (14,15) enrichment platform that targets ∼60 Mb of the human exonic regions. The SureSelect system employs ∼120-base RNA probes to capture known coding DNA sequences (CDS) from the NCBI Consensus CDS Database as well as other major RNA coding sequence databases, such as Sanger miRBase. The probes (or ‘baits’) cover > 99% of RefSeq, CCDS and GENCODE gene content. Libraries were constructed using the Agilent v6 SureSelect enrichment method for all 60 samples in the study and sequenced on NovaSeq sequencers to a median total read depth of approximately 155M paired-end (2 × 100) reads. Median bases on target exceeded 80%. After deduplication, typically 88% of target regions exceeded 50× in depth per sample and 67% exceeded 100× in depth with a mean depth across samples exceeding 170×. WES assays were successfully performed for all samples in the study.
All nucleic acid isolation and genomic assays were conducted at Q2 Solutions Genomics (Durham, NC USA).
Bioinformatics/statistical analysis
WES: We detected SNVs after BWA-MEM 0.7.10 (Burrows-Wheeler Alignment Maximal Exact Matches) alignment using VarSeq 1.4.7 variant calling with an hg19 reference. Copy number calls of autosomes were made using CNVkit v.0.9.5 (16) via a panel of normals (PON) generated separately from a female-only cohort of 30 normal blood samples. Thresholds for calling CN events were adjusted by sample based on tumor purity estimates except in cases where copy-neutral loss of heterozygosity (LOH) occurred.
Tumor purity was primarily estimated using allele frequency (AF) associated with ploidy- and near ploidy-level changes as a key indicator. We identified large regions throughout the individual genomes by sample with non-homozygous AF consistently deviating from 0.5 AF in the heterozygote state in one or more chromosomes. We then split the non-homozygous positions from these regions into positions that had AF >0.5 and <0.5. Given relative log ratio data of depths to the PON, if the sample had a possible loss in the region, we estimated tumor purity as 2 – (1/AF) for those positions where AF > 0.5 and estimated tumor purity as (1 – 2 × AF)/(1 – AF) where AF < 0.5. In addition, given relative log ratio data of depths to the PON, if the sample had a possible gain in the region, we estimated tumor purity as (2 × AF – 1)/((CN gain) × (1 – AF)) for those positions where AF > 0.5 and estimated tumor purity as ((1/AF) – 2)/CN where AF < 0.5. We then averaged all estimates for a sample to provide a final estimate of tumor purity for the sample. Exceptions included those regions that were loss or gains based on relative depth but were not obviously as extreme in AF as the positions chosen, most likely due to tumor heterogeneity. Tumor purity estimates by sample are provided in the Main Study Table (Supplemental Table S1).
Some statistical analysis was restricted to patients for which we had both RNA and WES results, especially for Cox proportional hazards (PH) modeling or factors that were critical to our multivariable Cox PH modeling. Cox PH modeling was carried out using SAS PHREG. Statistical tests comparing means of various continuous factors (such as number of breakpoints) between distinct patient groups (e.g. PtR versus PtS patients) were generally carried out using standard two-sample t-tests. However, some comparisons of PtS and PtR patients involved proportions (such as the proportion of patients with TP53 LOH) in which case the two-proportion Z-test was used. When paired primary vs. metastatic tumor characteristics were compared statistically, we used paired t-tests.
Defining platinum-sensitive and platinum-resistant patients
Patient outcome following surgery and adjuvant platinum-based chemotherapy treatment is defined as platinum-resistant (PtR) for time-to-recurrence (TTR) of approximately 6 months or less following last course of treatment versus platinum-sensitive (PtS) for TTR equal to or greater than 6 months following the last course of treatment, allowing for a period of time (∼1 month) between when symptoms occur and when a diagnosis is made. All patients were tracked to at least 40 months or until time of recurrence. Some analysis and graphs use the PtS versus PtR status when patients are dichotomized into two groups, while some survival analysis uses TTR and overall survival (OS) of patients as a continuous factor.
RESULTS
Patient and tumor characteristics
Our study was focused on genomic analysis of paired primary and metastatic tumors from 29 patients diagnosed with high-grade uterine serous carcinoma. Two of the 29 patients had more than one paired metastatic site analyzed. As shown in Table 1, the study was overwhelmingly advanced stage patients (97%) with 52% of African descent. The patient demographics are consistent with other studies (17,18) that found incidence rates of more aggressive uterine serous and clear cell carcinomas in patients of African descent to be 1.6 to 3 times the rate seen in people of European descent. All patients in the current cohort were treated with adjuvant platinum-based chemotherapy following surgical excision of primary and metastatic tumors except for two patients who received neo-adjuvant chemotherapy.
Table 1.
Patient demographics
| Number of patients | 29 | |
| Number of patients with paired metastases | 29# | |
| Age (years) | ||
| Range | 50–80 | |
| Median | 67 | |
| Race | ||
| Caucasian | 11 | |
| African American | 15 | |
| Other | 3 | |
| Stage | ||
| Stage II | 1 | |
| Stage III | 20 | |
| Stage IV | 8 | |
| Paired site of metastasis | ||
| Cervix | 2 | |
| Sigmoid colon | 1 | |
| Fallopian tube | 1 | |
| Omentum | 6 | |
| Omentum/colon# | 1 | |
| Omentum/breast# | 1 | |
| Para-aortic lymph node | 3 | |
| Pelvic lymph node | 13 | |
| Vagina | 1 | |
| Treatment | ||
| Carboplatin AUC 4–6 cycles/Paclitaxel 175 mg/m2 | ||
| Adjuvant treatment | 24* | |
| Neo-adjuvant treatment | 2** | |
| Adjuvant carboplatin/paclitaxel/gemcitabine 800 mg/m2 | 2*** | |
| Adjuvant carboplatin/paclitaxel/taxotere | 1** | |
| Number of patients platinum-sensitive (PtS) | 14 | |
#For two patients, two metastatic sites were analyzed; *20 patients received 6 cycles of treatment whereas four patients received 4 cycles; ** patients received 6 cycles; *** one patient received 6 cycles and one patient received 4 cycles.
Analysis of expression and the immune response in the tumor microenvironment
We measured RNA expression for all patients (both primary and metastatic samples) using the NanoString IO 360 panel to examine relevant immune landscape signatures (13,19) as well as expression of 350 cancer-related genes. We categorized these immune signatures as pro-tumor (primarily regulatory factors), anti-tumor, or pleiotropic. Test results comparing the expression level between PtS and PtR patients for both their primary and metastatic tumors are provided in Supplemental Table S2a (described in Supplemental Table S2b) for the immune signatures and in Supplemental Table S3a and b for certain cancer-related genes. Several anti-tumor immune signatures were associated (P < 0.05) with treatment response (PtS versus PtR patients) in the metastatic tumor but none were associated in the primary tumor. In each case, the mean level of anti-tumor immune expression was higher for PtS patients than PtR. In addition, only one primary immune-related signature (aDC, a pleiotropic signature of active dendritic cells) significantly differentiated PtS vs. PtR patients (aDC, P = 0.0469). In addition, no statistically significant differences (FDR > 0.05 in all cases) in the expression of the several hundred cancer-related genes assayed by the IO360 panel were observed between PtS and PtR patients for either primary or metastatic tumors.
Characterization of paired primary and metastatic tumors by WES
All patient tumors (both primary and metastatic) were examined via WES for individual variants, breakpoints, and sCNA. We detected a larger number of breakpoints in metastatic compared to primary tumors both overall (paired t-test P < 0.0001) and for several chromosomes. When comparing breakpoints between paired metastatic and primary tumors, chromosomes 1, 3, 4, 6, 8, 9, 10, 11, 12, 16, 17, 18, 19, 20, 21 and 22 had significantly higher mean levels of breakpoints in the metastatic than the primary tumor (q < 0.05, using Benjamini-Hochberg step-up correction). In general, there was evidence of more frequent widespread chromosomal damage (breakpoints and CN alterations) in the metastatic compared to the paired primary tumor as seen in Figure 1 (paired t-test P = 0.01).
Figure 1.
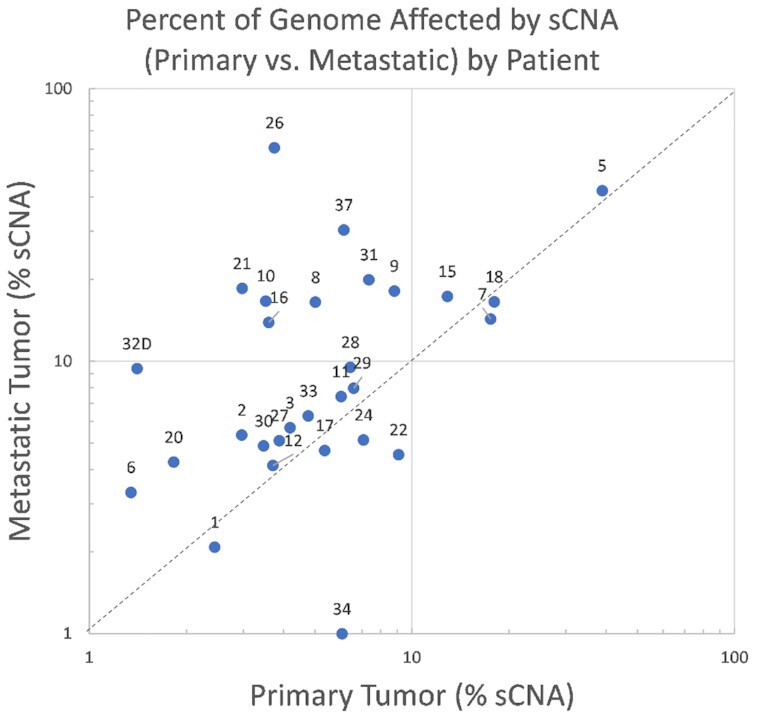
A comparison of the percent of the genome under sCNA by patient for the uterine serous cancer metastatic-primary pairs where the metastatic alteration percent is on the Y-axis and the primary alteration percent is on the X-axis.
Although remarkable differences in the number of breakpoints in primary tumors between PtS and PtR patients (Supplemental Table S4a) were not observed, the mean number of breakpoints for primary tumors in chromosomes 1, 8, 11, 17 (Figure 1A) was observed to be higher and approached near significance in PtS versus PtR patients (chr1 P-value = 0.059, chr8 P-value = 0.056, chr11 P-value = 0.068, chr17 P-value = 0.058). Conversely, metastatic tumors showed significant differences in breakpoints between PtS and PtR patients for chr 1 (two-sample t-test P = 0.045) (Supplemental Table S4b). Chromosome 1 in metastatic tumors had noticeable breakpoint magnitude differences compared to other chromosomes that are not completely explained by its larger size alone (Figure 2B).
Figure 2.

(A, B) Differences in average number of breakpoints between PtS and PtR patients by chromosome (bands show one standard error in each direction) for primary and metastatic tumors. Only metastatic tumors had significant (P = 0.045) differences in breakpoints for chromosome 1.
We examined chr 1 in more detail to determine whether there were regions of CN change that would be useful in distinguishing PtS and PtR patients and identified a series of common breakpoints across multiple tumor samples around PLK3. Figure 3A shows metastatic samples from patients 2, 5, 7, 8, 9, 15, 16, 17, 18, 20, 30 and 37 all having elevated copy number at PLK3 with 75% of these samples having a breakpoint exactly at one end of PLK3 (Figure 3B). In addition, 10 of 12 (83%) of these patients were PtR, with the remaining two samples being PtS having favorable immune activity in the metastatic tumor immune microenvironment (TIME). All seven PLK3 copy-normal samples with unfavorable TIME immune activity and four PLK3 copy-normal samples with favorable TIME cytotoxic immune activity were PtS.
Figure 3.

(A, B) Genomic region with estimated CN changes in PLK3 metastatic tumors relative to immune signature and treatment outcomes for patients having both measurements. (B) Breakpoint locations and estimated CN status for all patients around gene PLK3. The numbers next to lines correspond to study patient IDs. Each line represents a genomic region between breakpoints where the CN is estimated to be uniform for that patient. The estimated CN is indicated by the height of the line except for lines in the gray region where all patients in gray for the respective subregion spanned by the line are assumed to have copy neutral diploid status.
We also observed a highly significant difference (P < 0.0001) in the proportion of PtR patients (92.5%) compared to PtS patients (7.5%) with TP53 copy loss in the metastatic tumor. Figure 4 illustrates the differences in patient status for patients with normal TP53 copy number vs. TP53 loss or gain and their corresponding immune status. Interestingly, patients 2, 5, 7, 8, 15 and 16, which are the only patients simultaneously having TP53 loss, PLK3 CN gain, and unfavorable TIME in their metastatic tumor, were all PtR patients.
Figure 4.
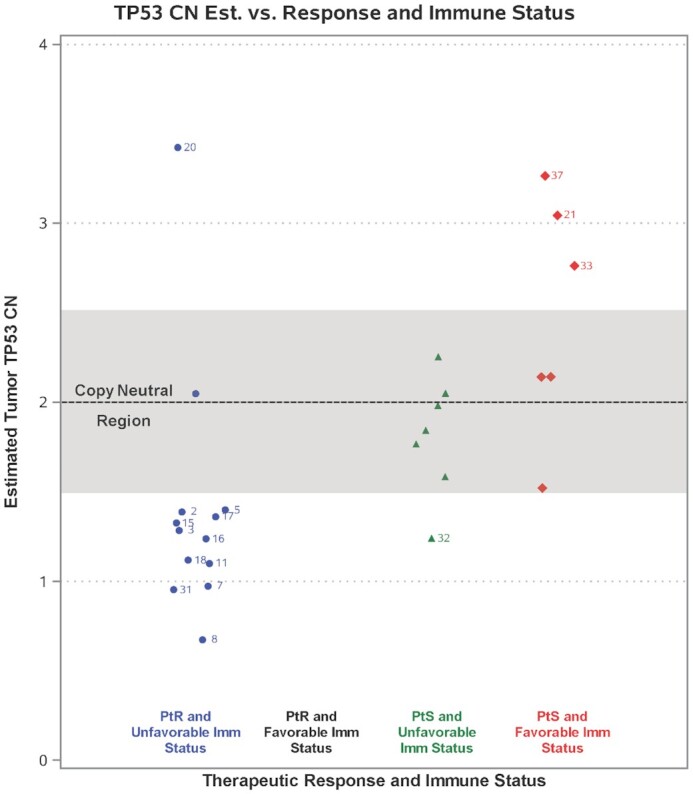
Estimated sCNA changes for TP53 and their association with PtS/PtR patients and immune status in their metastatic tumors for patients having both measurements. The numbers shown correspond to patient IDs.
In the UCEC TCGA dataset of advanced stage primary serous tumors (20), TP53 LOH was reported in 74% (43/58) of patients who were treated with adjuvant platinum-based chemotherapy. We found no association of TP53 LOH with OS in the TCGA cohort (P = 0.93). Similarly, in the current cohort, TP53 LOH in the primary tumor was not associated with OS either individually (P = 0.37) or jointly with other risk factors such as immune status and PLK3 CN status. However, the current cohort exhibited a strong association between OS and TP53 LOH in the metastatic tumor (P = 0.0008). Interestingly, in the current cohort, 48% of patients had differences in TP53 loss status between primary and metastatic tumors with the majority of these having TP53 LOH in the primary tumor only. Therefore, for USC advanced stage tumors in the current cohort, TP53 CN status of the primary tumor is not definitive in indicating the CN status of TP53 in the metastatic tumor. The estimated median OS for the advanced stage serous (platinum-treated) patients in the UCEC TCGA cohort with TP53 LOH in primary tumors was 32 months (95% CI [22,∞]) compared to the current cohort that had an estimated median OS of 15 months (95% CI [4,32]) and 52.4 months (95% CI [26,∞]) with and without TP53 LOH respectively in their metastatic tumors.
Survival analysis
In addition to evaluating outcomes as a binary state, either PtS or PtR, we also analyzed several prognostic factors potentially related to TTR and OS using survival analysis, specifically using Cox proportional hazards modeling. Since we had up to five years follow-up for some patients, Cox models are statistically more powerful in finding associations of important factors with patient survival and remove the dependence on determining a relevant time threshold (e.g, 6-month survival) to split patients into two groups as the threshold chosen could be somewhat arbitrary. We defined a binary factor called ‘immune response’ to be favorable or unfavorable, computed as the ratio of cytotoxic lymphocytic activity (CLIS) to TGFB1 expression (an important immune suppression factor in the TIME) where favorable response was defined as those in the top quartile of that ratio. We then employed a multivariable Cox PH regression model that included PLK3 copy number level, TP53 loss status, and our criterion for unfavorable/favorable immune response in the metastatic TIME for analysis of both TTR and OS (Table 2A and B). The hazard ratio (HR) estimate for TTR associated with unfavorable immune response in the metastatic tumor increased from 10 to 66 when including the PLK3 and TP53 CN cofactors (Table 2A) versus when examining immune status alone (Supplemental Tables 5a–5d). The CN level of PLK3 was highly significant in the multivariable TTR model (P = 0.0029) and the multivariable OS model (P = 0.0060) with similar HR estimates in each, implying that each additional copy of PLK3 in the metastatic tumor increased recurrence risk by approximately 43%. Advanced stage patients having eight or more copies of PLK3 had an estimated increased risk of recurrence due to PLK3 that was more than 15x compared to patients with normal PLK3 CN in their metastatic tumor.
Table 2.
(a and b) Multivariable Cox PH regression using three genomic risk factors from the metastatic tumor simultaneously for association with time to recurrence (a) and overall survival (b)
| (a) Time to recurrence (TTR) – N = 26 | |||||
|---|---|---|---|---|---|
| Genomic risk factor | Cox Param. | Chi-square | P-value | HR Est | 95% CI |
| Estimate | Statistic | Intervals (CI) | |||
| PLK3 sCNA Gain (per copy) | 0.357 | 8.87 | 0.0029 | 1.43 (per copy) | (1.13,1.81) |
| TP53 loss versus CN normal | 2.495 | 8.49 | 0.0036 | 12.20 | (2.26,66.7) |
| Immune response (unfavorable versus favorable) | 4.197 | 5.35 | 0.0207 | 66.49 | (1.90,2329) |
| (b) Overall survival (OS) – N = 26 | |||||
| Genomic risk factor | Cox Param. | Chi-square | P-value | HR Est | 95% CI |
| Estimate | Statistic | Intervals (CI) | |||
| PLK3 sCNA Gain (per copy) | 0.255 | 7.54 | 0.0060 | 1.29 (per copy) | (1.08,1.55) |
| TP53 loss versus CN normal | 1.793 | 7.17 | 0.0074 | 5.99 | (1.62,22.2) |
| Immune response (unfavorable versus favorable) | 2.169 | 3.41 | 0.0649 | 8.75 | (0.87,87.6) |
Details of Cox PH univariable analysis of these genomic risk factors with the current study cohort using TTR and OS as endpoints are available in Supplemental Tables 5a–5d. The importance of PLK3 CN alterations in metastases can be easily overlooked as it is not significantly associated with outcomes individually (univariable model P = 0.36 and 0.12 for TTR and OS respectively for the metastatic tumor). However, its interplay with immune response as shown in the multivariable model demonstrates its significant role in quantifying risk and potential impact. While analysis of PLK3 CN is highlighted due to having the largest number of ∼20 breakpoints within 10 kilobases (kb) of the gene in chr1 in the metastatic tumors, we also examined whether other genes had similar characteristics (high number of breakpoints within 10kb as well as association of CN with TTR) in metastatic tumors in a genome-wide analysis. The results are provided in Supplemental Figure 1 and Supplemental Tables 6a and 6b). When limited to genes that have a history of CN associations with outcomes such as IGF1R (21,22), and other relevant genes such as PPP2R1A, FGFR1, FGFR3, ERBB2, and PPP2CA, we found IGF1R and PPP2R1A had significant associations (P = 0.008 and P = 0.012) with TTR especially in the presence of immune response and TP53 LOH status but were not as significant as PLK3 (P = 0.0029). In addition, when we performed an analysis agnostic with regard to the wider genome, 56 genes from 38 gene neighborhoods were identified as having >14 breakpoints within 10 kb of the gene in metastatic tumors from chromosomes 2–22. From this set, two genes having previous associations with cancer cell proliferation, DDX5 (23) and EIF4A2 (24) had comparable raw p-values to PLK3 when performing Cox PH multivariable modeling associations with TTR. When results for DDX5 and EIF4A2 were adjusted for multiple comparisons (due to genome-wide testing), these genes were still significant but not of the same magnitude as PLK3 (Supplemental Table 6b). Like PLK3, amplified DDX5 and EIF4A2 implied higher risk of recurrence for both. EIF4A2 amplifications have been identified as recurring CN changes in uterine cancer patients (25) but with no documented association with outcomes. In contrast, we observed IGF1R amplification was associated with better outcomes in uterine serous, similar to what has been established in non-small cell lung cancer (21,22) and consistent with higher IGF1R expression being associated with better disease-free survival and OS in endometrial cancer (26).
Kaplan-Meier plots also illustrate the relationship between PLK3 CN gain and immune status with TTR. Figure 5 indicates the stark differences between patients who have PLK3 copy-neutral status and favorable immune status versus patients with PLK3 gains and unfavorable immune status. Notably, all nine patients (33% of study) with PLK3 gain and an unfavorable immune status were PtR.
Figure 5.

Kaplan–Meier plot of PLK3 Copy-neutral/PLK3 Gain relative to Favorable/Unfavorable Immune status for TTR in the metastatic tumor.
DISCUSSION
Advanced endometrial carcinomas have a poor prognosis and unlike other solid tumors both incidence and mortality are on the rise for this malignancy (4,5). While USC represents only 10% of all endometrial cancers, it accounts for 39% of deaths indicating the urgent need for understanding USC biology and development of novel effective treatment strategies (3–5). While comprehensive genomic analysis of endometrial cancers has been reported, studies focused on USC are limited with p53 mutations and HER-2/neu gene amplification representing major molecular abnormalities (4). Indeed, overexpression of Her2/neu has led to a targeted novel treatment strategy (27,28). Genomic analysis of endometrial carcinomas (20) have led to its re-classification, with USC considered to be similar to high-grade serous ovarian cancer (HGSOC) and basal-like breast cancer.
Since surgery followed by adjuvant chemotherapy is standard of care for USC, our strategy focused on comparative analysis of paired primary and metastatic tumors to evaluate not only genomic differences but also their relevance to outcome. The present results suggest that the PLK3 copy number gains, TP53 LOH, and TIME in the metastatic, but not primary tumor, is associated with outcome following adjuvant platinum-based chemotherapy. This indicates a potential paradigm-changing aspect to USC treatment as, historically, metastatic tumors were not typically considered as having unique information pertaining to clinical outcomes.
Our previous report (13) found that favorable immune status based on the primary immune signature (cytotoxic lymphocyte immune signature, or CLIS), linked to outcomes in HGSOC, was also strongly linked to outcomes (P = 0.001) with better OS (HR = 0.633 95% CI [0.48,0.84]) after accounting for age and tumor stage in a multivariable Cox PH regression for the large TCGA cohort (n = 370) of primary uterine corpus endometrial carcinoma (UCEC) patients that included both serous and endometrioid tumors. If one examines only the serous subset for advanced stage UCEC tumors (in this same TCGA cohort), the HR estimate for CLIS is lower (HR = 0.42) but the 95% confidence interval is noticeably more variable (95% CI [0.16 1.1], P = 0.078) possibly due to the much smaller sample size (n = 26) and in part due to the lack of RNA-seq expression data for a substantial proportion of tumors. For OS in the current cohort of USC patients based on their metastatic TIME, the comparable statistics were HR = 0.568, 95% CI [0.345,0.933], P = 0.0254. Since the TCGA dataset provides genomic information almost exclusively on primary tumors (i.e. very few metastatic tumors) and does not report TTR information for UCEC tumors, a direct comparison of PtS and PtR outcomes with TCGA using the current cohort is not possible.
We found no significant association of established pathological or likely pathological small variants of TP53 in metastatic or primary tumors with TTR or OS (P = 0.33 for both) or in delineating PtR vs. PtS patients (P = 0.81 for metastatic tumors and P = 0.36 for primary). These small variants were detected in 38% and 28% of the metastatic and matched primary tumor, respectively. In contrast, we identified that 12 of 15 (80%) PtR patients had strong evidence of TP53 loss while only one of 14 (7%) PtS patients had any evidence of TP53 CN loss in their metastatic tumors.
Arlt et al. (29) indicated chromosome 1p32-33 is frequently deleted in USC while Herzog et al. (30) found a candidate tumor suppressor gene on chromosome 1p that is important in the development of uterine papillary serous carcinoma. However, our study demonstrates a role for chromosome 1 breakpoints, specifically those indicating amplifications around the PLK3 gene (which is also in 1p), in USC patient outcome to adjuvant platinum-based chemotherapy. In addition, our study suggests this association can only be identified at the metastatic tumor site rather than the primary tumor site (which is more frequently studied). Our study shows the potentially important role of sCNA in USC and is congruous with recent findings where sCNA and expression were found to be more prognostic than mutational status (small mutations) across the TCGA-related indications (31).
Polo-like kinases (including PLK3) are a family of 5 serine/threonine kinases that play an essential role in cell cycle, mitotic entry, DNA replication and stress response (32). Various mechanisms have been described for PLK3’s potential role in mediating oncogenesis (32,33). In particular, interaction between Plk3 and the tumor-suppressor protein p53 were demonstrated whereby Plk3 phosphorylates Ser-20 of p53 in an ATM-dependent manner (33). Knocking out PLK3 attenuated S20 phosphorylation as well as transactivation and oncogenicity of gain-of-function mutated p53. In two observational studies of female cancers, PLK3 expression levels were found to be prognostic with higher levels associated with shortened survival times (34,35). While little is known about the role of PLK3 in resistance to anti-tumor drugs, it has been reported that knocking down PLK3 increases stability of p73 and promotes cisplatin induced apoptosis along with up-regulation of p73 (36). PLK3 is also reported to have a role in DNA damage involving regulation of CtlP during double strand break repair in G1 (37). Given the clear CN amplification patterns related to PLK3 in the current cohort, PLK3 should be considered for future research as a potential drug target and as a diagnostic for advanced stage USC patients at risk of recurrence.
The overall TIME showed some evidence of differences between paired primary and metastatic samples with regards to immune cells. We examined several immune landscape signatures (Supplemental Table S2a) and found only T cell trafficking that had sufficient correlation (r = 0.55, P < 0.01) between primary and metastatic pairs where the association was clearly non-zero. Other immune-related expression signatures such as CLIS, B cells, TGFB1, M2TAM and especially stromal response signatures such as IFNG response, TGFB1 response, and wound healing (19) had low or even negative correlation (all with |r| < 0.05) between primary and metastatic tumors. This is not completely unexpected as the metastatic tumor invades tissue outside the uterine lining where conditions promoting and regulating tumor activity could vary depending on the metastatic site. It does indicate the importance of examining the metastatic TIME in advanced stage USC related to both TTR and OS as the immune signatures found to be the most strongly associated with outcomes were the molecular measurements from the metastatic site.
Previously, in contrast to this study, no notable differences in somatic mutations between primary and metastatic USC were reported (10). Moreover, endometrial cancer has been shown to have a very high frequency of homologous recombination-related gene mutations among the various cancer types (38). Given the importance of homologous recombination deficiency (HRD) in serous ovarian tumors and that the number of breakpoints in the metastatic tumors (and not primary tumors) was found to be associated with USC outcomes, we initially investigated HRD status for possible association with USC outcomes and as a potential driver for (metastatic) breakpoints (see Supplemental Table S7 for homologous recombination repair genes considered and their tiers of importance). However, whether we examined the larger set of 34 genes associated with HRD status (Supplemental Table S8a and S8b) or only the top tier (Supplemental Table S9), we saw no clear association of HRD with PtR vs. PtS patients whether we examined small variants (SNVs and indels), sCNAs, or some combination of the two. Negative results may be due to our sample size even though it is a relatively large collection of matched primary-metastatic tumors. We also examined small variants in HRD genes weighted using the tiered system with no positive result (analysis results in Supplemental Table S8b). We further examined other key genes for small variants such as POLE, NF1 and PTEN and found no significant association with PtR vs. PtS status (Supplemental Table S9).
This study was retrospective using archived uterine serous tumors that had both primary and paired metastasis. A lack of matching normal material limited our ability to clearly delineate somatic vs. germline small variants, impacting our ability to estimate tumor mutational burden (TMB) accurately (39). Without matched normal results, TMB is typically overestimated; thus, TMB analysis was not performed. Since immune response is an important factor related to patient response, we plan future studies of USC incorporating TMB and other information using matched normals. However, we feel the detected CN changes have much more certainty of being somatic given their magnitude (several genes have large numbers of amplifications), severity (TP53 loss is not well tolerated), and pattern.
As stated previously, the percentage of the genome altered in USC metastatic tumors was noticeably larger on average versus paired USC primary tumors (P = 0.018). In particular, the frequency of large-loss and medium loss events was 2.4× higher on average in metastatic tumors versus its primary pair (Supplemental Table S8b). In contrast, the frequency of small nonsynonymous TP53 variants and well as LOH events were noticeably correlated between primary and metastatic pairs (Supplemental Table S8b). However, neither large or medium loss events as measured in primary or metastatic tumors were useful in distinguishing PtS versus PtR patients in our cohort. As indicated previously, TP53 small variant status was not significant when comparing PtS vs. PtR patients in our study (Supplemental Tables S8b and S9). Instead, we found TP53 LOH status and PLK3 sCNA gains in the metastatic tumor (and not the primary) to be much more informative of outcomes among the DNA-related factors. The genomic information from the metastatic tumor is much more informative than from the primary tumor for predicting outcomes as shown in Table 3, even for factors such as CLIS or unfavorable immune response where there is not a statistically significant difference between paired primary and metastatic tumors.
Table 3.
Summary of key univariable genomic risk factors and their potential differences between paired metastatic and primary USC tumors and their association (or lack thereof) with outcomes. Evidence of differences are indicated by P-values
| Primary tumor | Metastatic tumor | ||||||
|---|---|---|---|---|---|---|---|
| Genomic Risk Factor | Mean(m) or Proportion(p) Differences between Primary and Metastatic | Mean(m) or Proportion(p) Differences between PtR and PtS patients | TTR Association (survival analysis) | OS Association (survival analysis) | Mean(m) or Proportion(p) Differences between PtR and PtS patients | TTR Association (survival analysis) | OS Association (survival analysis) |
| CLIS (immune activitya | —(m) | — (m) | — | — | P= 0.0201 (m) | P= 0.0091 | P= 0.0221 |
| Unfavorable immune responsea | — (p) | — (p) | — | — | P= 0.0052 (p) | P= 0.0252 | P= 0.0272 |
| Chr 1 breakpointsb | P = 0.0113 (m) | P= 0.0593 (m) | P = 0.032 | P= 0.0612 | P = 0.0442 (m) | P= 0.0032 | — |
| PLK3 amplificationb | P = 0.0443 (p) | — (p) | — | — | P=0.0352 (p) | —4 | —4 |
| TP53 LOHb | — (p) | — (p) | — | — | P< 0.00012 (p) | P< 0.00012 | P = 0.00082 |
| Whole genome breakpoints5b | P< 0.00013 (m) | — (m) | — | — | — (m) | P=.072 | — |
| Genome alteration %age5b | P = 0.0183 (m) | — (m) | P= 0.0823 | — | — (m) | — | P = 0.0282 |
— Not significant for univariable model (P > 0.10)
a N = 27 for primary tumors and N = 26 for metastatic tumors (see Supplementary Table S1).
b N = 29 for both primary and metastatic tumors.
1Higher levels or presence of the feature were associated with reduced risk.
2Higher levels or presence of the feature were associated with increased risk.
3Metastatic samples had larger means/proportions than primary.
4Highly significant in a multivariable survival analysis (Cox PH regression) when measured by estimated CN rather than normal vs. amplified . See Table 2a and b.
5Tested on log scale.
When examining population group or ancestry regarding association with response to treatment, neither European or African ancestry was found to be significant with either TTR or OS in univariable analysis. Since other reports have linked ancestry with outcome (17,18), our study may be underpowered to discern those potential associations.
In summary, our comparative genomic analysis of paired primary and metastatic USC tumors provides insight regarding the unique importance of the metastatic tumor based on genomic alterations and TIME dysregulation that are linked to outcomes following adjuvant chemotherapy. It demonstrates the value of examining multiple genomic factors simultaneously in determining risk of recurrence or death in advanced stage USC. Our results also suggest that both PLK3 and the TIME are potential targets that could improve outcomes of adjuvant therapy in USC. Currently only PLK1-specific inhibitors are reported in the literature: a Phase Ib study of onvansertib plus combination therapy in relapse/refractory AML suggested antileukemic activity in patients with target (TCTP) engagement (40). Unfortunately, no data on PLK3 specific inhibitors is currently published. While PLK1-specific inhibitors in combination therapy are being evaluated in clinical trials, PLK3 specific inhibitors when available could be potentially important in tumors such as platinum-refractory USC that exhibit PLK3 amplification.
DATA AVAILABILITY
NanoString normalized and raw expression files and WES CN calls (cns data) for all samples, as well as all clinical/demographic info are available at GSE205209.
Supplementary Material
ACKNOWLEDGEMENTS
Author contributions: R.G. conceived and designed the study. W.J., R.G. and M.G. wrote the article. W.J. conducted all statistical analysis. D.T. contributed the samples for study, identifying metastatic sites, and patient clinical characterization as well as reviewing the article. C.L. conducted the pathology for all samples and reviewed the article. W.J., R.G. and M.G. conducted final review of all data and the article.
Contributor Information
Wendell Jones, Bioinformatics, Q2 Solutions Genomics, Durham, NC, USA.
David Tait, Levine Cancer Institute, Atrium Health, Charlotte, NC, USA.
Chad Livasy, Carolinas Pathology Group, Charlotte, NC, USA.
Mahrukh Ganapathi, Levine Cancer Institute, Atrium Health, Charlotte, NC, USA.
Ram Ganapathi, Levine Cancer Institute, Atrium Health, Charlotte, NC, USA.
SUPPLEMENTARY DATA
Supplementary Data are available at NAR Cancer Online.
FUNDING
Carolinas Gynecological Cancer Research Fund through Atrium Health Foundation (in part).
Conflict of interest statement. W.J. is an employee of Q2 Solutions.
REFERENCES
- 1. Siegel R.L., Miller K.D., Jemal A.. Cancer statistics, 2018. CA: Cancer J. Clin. 2018; 68:7–30. [DOI] [PubMed] [Google Scholar]
- 2. Ueda S.M., Kapp D.S., Cheung M.K., Shin J.Y., Osann K., Husain A., Teng N.N., Berek J.S., Chan J.K.. Trends in demographic and clinical characteristics in women diagnosed with corpus cancer and their potential impact on the increasing number of deaths. Am. J. Obstet. Gynecol. 2008; 198:218. [DOI] [PubMed] [Google Scholar]
- 3. Hamilton C.A., Cheung M.K., Osann K., Chen L., Teng N.N., Longacre T.A., Powell M.A., Hendrickson M.R., Kapp D.S., Chan J.K.. Uterine papillary serous and clear cell carcinomas predict for poorer survival compared to grade 3 endometrioid corpus cancers. Br. J. Cancer. 2006; 94:642–646. [DOI] [PMC free article] [PubMed] [Google Scholar]
- 4. Lee E.K., Fader A.N., Santin A.D., Liu J.F.. Uterine serous carcinoma: molecular features, clinical management, and new and future therapies. Gynecol. Oncol. 2021; 160:322–332. [DOI] [PubMed] [Google Scholar]
- 5. Ferriss J.S., Erickson B.K., Shih I.M., Fader A.N.. Uterine serous carcinoma: key advances and novel treatment approaches. Int. J. Gynecol. Cancer. 2021; 31:1165–1174. [DOI] [PubMed] [Google Scholar]
- 6. Tyran M., Carbuccia N., Garnier S., Guille A., Adelaïde J., Finetti P., Touzlian J., Viens P., Tallet A., Goncalves A.et al.. a comparison of DNA mutation and copy number profiles of primary breast cancers and paired brain metastases for identifying clinically relevant genetic alterations in brain metastases. Cancers. 2019; 11:665. [DOI] [PMC free article] [PubMed] [Google Scholar]
- 7. Meric-Bernstam F., Frampton G.M., Ferrer-Lozano J., Yelensky R., Pérez-Fidalgo J.A., Wang Y., Palmer G.A., Ross J.S., Miller V.A., Su X.et al.. Concordance of genomic alterations between primary and recurrent breast cancer. Mol. Cancer Ther. 2014; 13:1382. [DOI] [PMC free article] [PubMed] [Google Scholar]
- 8. Kawamata F., Patch A. M., Nones K., Bond C., McKeone D., Pearson S.A., Homma S., Liu C., Fennell L., Dumenil T.et al.. Copy number profiles of paired primary and metastatic colorectal cancers. Oncotarget. 2017; 9:3394–3405. [DOI] [PMC free article] [PubMed] [Google Scholar]
- 9. Vakiani E., Janakiraman M., Shen R., Sinha R., Zeng Z., Shia J., Cercek A., Kemeny N., D’Angelica M., Viale A.et al.. Comparative genomic analysis of primary versus metastatic colorectal carcinomas. J. Clin. Oncol. 2012; 30:2956–2962. [DOI] [PMC free article] [PubMed] [Google Scholar]
- 10. Gibson W.J., Hoivik E.A., Halle M.K., Taylor-Weiner A., Cherniack A.D., Berg A., Holst F., Zack T.I., Werner H.M., Staby K.M.et al.. the genomic landscape and evolution of endometrial carcinoma progression and abdominopelvic metastasis. Nat. Genet. 2016; 48:848–855. [DOI] [PMC free article] [PubMed] [Google Scholar]
- 11. Ganapathi M.K., Jones W.D., Sehouli J., Michener C.M., Braicu I.E., Norris E.J., Biscotti C.V., Vaziri S.A., Ganapathi R.N.. Expression profile of COL2A1 and the pseudogene SLC6A10P predicts tumor recurrence in high-grade serous ovarian cancer. Int. J. Cancer. 2016; 138:679–688. [DOI] [PubMed] [Google Scholar]
- 12. Miller K.R., Patel J.N., Zhang Q., Norris E.J., Symanowski J., Michener C., Sehouli J., Braicu I., Destephanis D.D., Sutker A.P.et al.. HOXA4/HOXB3 gene expression signature as a biomarker of recurrence in patients with high-grade serous ovarian cancer following primary cytoreductive surgery and first-line adjuvant chemotherapy. Gynecol. Oncol. 2018; 149:155–162. [DOI] [PubMed] [Google Scholar]
- 13. Jones W.D., Michener C.M., Biscotti C., Braicu I., Sehouli J., Ganapathi M.K., Ganapathi R.N.. RNA Immune Signatures from Pan-Cancer Analysis Are Prognostic for High-Grade Serous Ovarian Cancer and Other Female Cancers. Cancers. 2020; 12:620. [DOI] [PMC free article] [PubMed] [Google Scholar]
- 14. Norris E.J., Jones W.D., Surleac M.D., Petrescu A.J., Destephanis D., Zhang Q., Hamadeh I., Kneisl J.S., Livasy C.A., Ganapathi R.N.et al.. Clonal lineage of high grade serous ovarian cancer in a patient with neurofibromatosis type 1. Gynecol. Oncol. Rep. 2018; 23:41–44. [DOI] [PMC free article] [PubMed] [Google Scholar]
- 15. Chen R., Im H., Snyder M.. Whole-exome enrichment with the Agilent SureSelect human all exon platform. Cold Spring Harb. Protoc. 2015; 7:626–633. [DOI] [PMC free article] [PubMed] [Google Scholar]
- 16. Talevich E., Shain A.H., Botton T., Bastian B.C.. CNVkit: genome-wide copy number detection and visualization from targeted DNA sequencing. PLoS Comp. Biol. 2016; 12:e1004873. [DOI] [PMC free article] [PubMed] [Google Scholar]
- 17. Long B., Liu F.W., Bristow R.E.. Disparities in uterine cancer epidemiology, treatment, and survival among African Americans in the United States. Gynecol. Oncol. 2013; 130:652–659. [DOI] [PMC free article] [PubMed] [Google Scholar]
- 18. Setiawan V.W., Pike M.C., Kolonel L.N., Nomura A.M., Goodman M.T., Henderson B.E.. Racial/ethnic differences in endometrial cancer risk: the multiethnic cohort study. Am. J. Epidemiol. 2007; 165:262–270. [DOI] [PubMed] [Google Scholar]
- 19. Thorsson V., Gibbs D.L., Brown S.D., Wolf D., Bortone D.S., Ou Yang T.H., Porta-Pardo E., Gao G.F., Plaisier C.L., Eddy J.A.et al.. the Immune Landscape of Cancer. Immunity. 2018; 48:812–830. [DOI] [PMC free article] [PubMed] [Google Scholar]
- 20. Cancer Genome Atlas Research Network Kandoth C., Schultz N., Cherniack A.D., Akbani R., Liu Y., Shen H., Robertson A.G., Pashtan I., Shen R., Benz C.C.et al.. Integrated genomic characterization of endometrial carcinoma. Nature. 2013; 497:67–73. [DOI] [PMC free article] [PubMed] [Google Scholar]
- 21. Dziadziuszko R., Merrick D.T., Witta S.E., Mendoza A.D., Szostakiewicz B., Szymanowska A., Rzyman W., Dziadziuszko K., Jassem J., B. Jret al.. Insulin-like growth factor receptor 1 (IGF1R) gene copy number is associated with survival in operable non–small-cell lung cancer: a comparison between IGF1R fluorescent in situ hybridization, protein expression, and mRNA expression. JCO. 2010; 28:2174. [DOI] [PMC free article] [PubMed] [Google Scholar]
- 22. Al-Saad S., Richardsen E., Kilvaer T.K., Donnem T., Andersen S., Khanehkenari M., Bremnes R.M., Busund L.T.. the impact of MET, IGF-1, IGF1R expression and EGFR mutations on survival of patients with non-small-cell lung cancer. PLoS One. 2017; 12:e0181527. [DOI] [PMC free article] [PubMed] [Google Scholar]
- 23. Du C., Li D.Q., Li N., Chen L., Li S.S., Yang Y., Hou M.X., Xie M.J., Zheng Z D.. DDX5 promotes gastric cancer cell proliferation in vitro and in vivo through mTOR signaling pathway. Sci. Rep. 2017; 7:42876. [DOI] [PMC free article] [PubMed] [Google Scholar]
- 24. Chen Z. H., Qi J.J., Wu Q.N., Lu J.H., Liu Z.X., Wang Y., Hu P.S., Li T., Lin J.F., Wu X.Y.et al.. Eukaryotic initiation factor 4A2 promotes experimental metastasis and oxaliplatin resistance in colorectal cancer. J. Exp. Clin. Cancer Res. 2019; 38:196. [DOI] [PMC free article] [PubMed] [Google Scholar]
- 25. Saglam O., Tang Z., Tang G., Medeiros L.J., Toruner G.A.. KAT6A amplifications are associated with shorter progression-free survival and overall survival in patients with endometrial serous carcinoma. PLoS One. 2020; 15:e0238477. [DOI] [PMC free article] [PubMed] [Google Scholar]
- 26. Joehlin-Price A.S., Stephens J.A., Zhang J., Backes F.J., Cohn D.E., Suarez A.A.. Endometrial cancer insulin-like growth factor 1 receptor (IGF1R) expression increases with body mass index and is associated with pathologic extent and prognosis. Cancer Epidemiol. Biomark. Prev. 2016; 25:438–445. [DOI] [PMC free article] [PubMed] [Google Scholar]
- 27. Fader A.N., Roque D.M., Siegel E., Buza N., Hui P., Abdelghany O., Chambers S.K., Secord A.A., Havrilesky L., O’Malley D.M.et al.. Randomized phase II trial of carboplatin-paclitaxel versus carboplatin-paclitaxel-trastuzumab in uterine serous carcinomas that overexpress human epidermal growth factor receptor 2/neu. J. Clin. Oncol. 2018; 36:2044–2051. [DOI] [PubMed] [Google Scholar]
- 28. Fader A.N., Roque D.M., Siegel E., Buza N., Hui P., Abdelghany O., Chambers S.K, Secord A.A., Havrilesky L., O’Malley D.M.et al.. Randomized phase II trial of carboplatin-paclitaxel compared with carboplatin-paclitaxel-trastuzumab in advanced (Stage III-IV) or recurrent uterine serous carcinomas that overexpress Her2/Neu (NCT01367002): updated overall survival analysis. Clin. Cancer Res. 2020; 26:3928–3935. [DOI] [PMC free article] [PubMed] [Google Scholar]
- 29. Arlt M.F., Li M., Herzog T.J., Goodfellow P.J.. a 1-Mb bacterial clone contig spanning the endometrial cancer deletion region at 1p32-p33. Genomics. 1999; 57:62–69. [DOI] [PubMed] [Google Scholar]
- 30. Herzog T. J., Kowalski L. D., Liu H., Arlt M., Swisher E.. Evaluation of a region on chromosome 1p in ovarian serous carcinoma that is frequently deleted in uterine papillary serous carcinoma. Gynecol. Oncol. 2001; 82:139–142. [DOI] [PubMed] [Google Scholar]
- 31. Smith J.C., Sheltzer J.M.. Genome-wide identification and analysis of prognostic features in human cancers. Cell Rep. 2022; 38:110569. [DOI] [PMC free article] [PubMed] [Google Scholar]
- 32. Helmke C., Becker S., Strebhardt K.. the role of Plk3 in oncogenesis. Oncogene. 2016; 35:135–147. [DOI] [PubMed] [Google Scholar]
- 33. Vaughan C.A., Singh S., Subler M.A., Windle J.J., Inoue K., Fry E.A., Pillappa R., Grossman S.R., Windle B., Yeudall W.A.et al.. the oncogenicity of tumor-derived mutant p53 is enhanced by the recruitment of PLK3. Nat. Commun. 2021; 12:704. [DOI] [PMC free article] [PubMed] [Google Scholar]
- 34. Weichert W., Denkert C., Schmidt M., Gekeler V., Wolf G., Köbel M., Dietel M., Hauptmann S.. Polo-like kinase isoform expression is a prognostic factor in ovarian carcinoma. Br. J. Cancer. 2004; 90:815–821. [DOI] [PMC free article] [PubMed] [Google Scholar]
- 35. Weichert W., Kristiansen G., Winzer K.J., Schmidt M., Gekeler V., Noske A., Müller B.M., Niesporek S., Dietel M., Denkert C.. Polo-like kinase isoforms in breast cancer: expression patterns and prognostic implications. Virchows Arch. 2005; 446:442–450. [DOI] [PubMed] [Google Scholar]
- 36. Sang M., Ando K., Okoshi R., Koida N., Li Y., Zhu Y., Shimozato O., Geng C., Shan B., Nakagawara A.et al.. Plk3 inhibits pro-apoptotic activity of p73 through physical interaction and phosphorylation. Genes Cells. 2009; 14:775–788. [DOI] [PubMed] [Google Scholar]
- 37. Barton O., Naumann S. C., Diemer-Biehs R., Künzel J., Steinlage M., Conrad S., Makharashvili N., Wang J., Feng L., Lopez B.S.et al.. Polo-like kinase 3 regulates CtIP during DNA double-strand break repair in G1. J. Cell Biol. 2014; 206:877–894. [DOI] [PMC free article] [PubMed] [Google Scholar]
- 38. Heeke A. L., Pishvaian M. J., Lynce F., Xiu J., Brody J. R., Chen W. J., Baker T. M., Marshall J. L., Isaacs C.. Prevalence of Homologous Recombination-Related Gene Mutations Across Multiple Cancer Types. JCO Precis. Oncol. 2018; 2018:PO.17.00286. [DOI] [PMC free article] [PubMed] [Google Scholar]
- 39. Parikh K., Huether R., White K., Hoskinson D., Beaubier N., Dong H., Adjei A. A., Mansfield A. S.. Tumor mutational burden from tumor-only sequencing compared with germline subtraction from paired tumor and normal specimens. JAMA Network Open. 2020; 3:e200202. [DOI] [PMC free article] [PubMed] [Google Scholar]
- 40. Zeidan A.M., Ridinger M., Lin T.L., Becker P.S., Schiller G.J., Patel P.A., Spira A.I., Tsai M.L., Samuëlsz E., Silberman S.L.et al.. A Phase Ib study of onvansertib, a novel oral PLK1 inhibitor, in combination therapy for patients with relapsed or refractory acute myeloid leukemiaThe PLK1 inhibitor, onvansertib, in combinations for R/R AML. Clin. Cancer Res. 2020; 26:6132–6140. [DOI] [PubMed] [Google Scholar]
Associated Data
This section collects any data citations, data availability statements, or supplementary materials included in this article.
Supplementary Materials
Data Availability Statement
NanoString normalized and raw expression files and WES CN calls (cns data) for all samples, as well as all clinical/demographic info are available at GSE205209.