Abstract
Effective drug delivery to the brain is critical for the treatment of glioblastoma (GBM), an aggressive and invasive primary brain tumor that has a dismal prognosis. Radiation therapy, the mainstay of brain tumor treatment, works by inducing DNA damage. Therefore, inhibiting DNA damage response (DDR) pathways can sensitize tumor cells to radiation and enhance cytotoxicity. AZD1390 is an inhibitor of ataxia-telangiectasia mutated kinase, a critical regulator of DDR. Our in vivo studies in the mouse indicate that delivery of AZD1390 to the central nervous system (CNS) is restricted due to active efflux by P-glycoprotein (P-gp). The free fraction of AZD1390 in brain and spinal cord were found to be low, thereby reducing the partitioning of free drug to these organs. Coadministration of an efflux inhibitor significantly increased CNS exposure of AZD1390. No differences were observed in distribution of AZD1390 within different anatomic regions of CNS, and the functional activity of P-gp and breast cancer resistance protein also remained the same across brain regions. In an intracranial GBM patient–derived xenograft model, AZD1390 accumulation was higher in the tumor core and rim compared with surrounding brain. Despite this heterogenous delivery within tumor-bearing brain, AZD1390 concentrations in normal brain, tumor rim, and tumor core were above in vitro effective radiosensitizing concentrations. These results indicate that despite being a substrate of efflux in the mouse brain, sufficient AZD1390 exposure is anticipated even in regions of normal brain.
SIGNIFICANCE STATEMENT
Given the invasive nature of glioblastoma (GBM), tumor cells are often protected by an intact blood-brain barrier, requiring the development of brain-penetrant molecules for effective treatment. We show that efflux mediated by P-glycoprotein (P-gp) limits central nervous system (CNS) distribution of AZD1390 and that there are no distributional differences within anatomical regions of CNS. Despite efflux by P-gp, concentrations effective for potent radiosensitization are achieved in GBM tumor–bearing mouse brains, indicating that AZD1390 is an attractive molecule for clinical development of brain tumors.
Introduction
Tumors in the central nervous system (CNS), either primary or metastatic, are almost uniformly lethal and have a dismal prognosis despite the aggressive treatment strategy of surgery, radiation therapy (RT), and chemotherapy. The median survival of glioblastoma (GBM) patients is approximately 15 months and is 7 to 8 months for patients with brain metastases (Moravan et al., 2020; Tan et al., 2020). The overall poor brain tumor control after RT for either primary or metastatic brain tumors is a primary motivation for development of novel radiosensitizing molecules for the treatment of brain tumors.
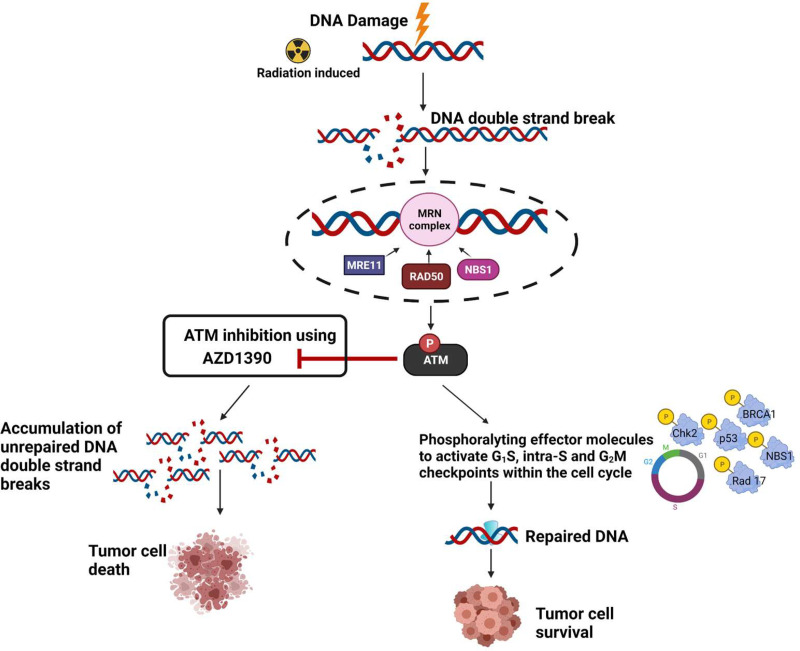
Unrepaired DNA double-strand breaks are the lethal lesion associated with RT, and ataxia-telangiectasia mutated (ATM) kinase is a crucial component of DNA damage response (DDR) involved in the repair of these lesions (Kastan and Lim, 2000) (Fig. 1). Modulating cell cycle checkpoints, DNA repair, and cell survival are key functions of ATM (Weber and Ryan, 2015; Lee and Paull, 2021). Therefore, inhibition of ATM, when combined with RT, can lead to potent radiosensitization (Fig. 1). However, patients with a homozygous mutation in ATM suffer from a rare disorder called ataxia-telangiectasia (AT) syndrome, which is characterized by profound hypersensitivity to RT (Gatti, 2009; Pollard and Gatti, 2009). Severe radiation toxicities have been observed in patients with AT, even leading to death (Pritchard et al., 1982; Tamminga et al., 2002). It is therefore critical to understand the potential impacts of ATM inhibitors on both tumor and normal brain tissues.
Fig. 1.
Rationale for ATM inhibition using AZD1390 for radiosensitization of tumor cells.
ATM inhibition has been demonstrated to effectively radiosensitize CNS metastases of breast cancer (Tew et al., 2021) and GBM cells (Golding et al., 2012; Biddlestone-Thorpe et al., 2013; Karlin et al., 2018), particularly GBM stem cells that show enhanced radioresistance (Carruthers et al., 2015). AZD1390, a potent ATM inhibitor (Durant et al., 2018a), is currently in phase I clinical trials (NCT03423628) with RT for GBM and brain metastases. A careful evaluation of mechanisms that influence the CNS delivery of AZD1390 is therefore key in understanding is optimal potential uses for brain tumor treatment.
A key limiting factor in CNS distribution of therapeutics is the presence of the blood-brain barrier (BBB). The unique nature of the BBB allows selective entry of molecules to brain as needed for its nutrition, growth, and development while restricting entry of other circulating molecules (Abbott et al., 2010). A major component of this restrictive entry is the presence of ATP binding cassette (ABC) transporters that actively efflux molecules back into the bloodstream, thereby preventing their entry into the CNS. Two key players of this active efflux at the BBB are P-glycoprotein (P-gp) and breast cancer resistance protein (Bcrp). These proteins in the ABC superfamily of transporters are involved in the limited CNS delivery of a multitude of anticancer agents for brain tumors (Löscher and Potschka, 2005). Through this study, we evaluate the role of P-gp and Bcrp in limiting the CNS delivery of AZD1390. We also evaluate the functional activity of P-gp and Bcrp across different anatomic regions of the CNS.
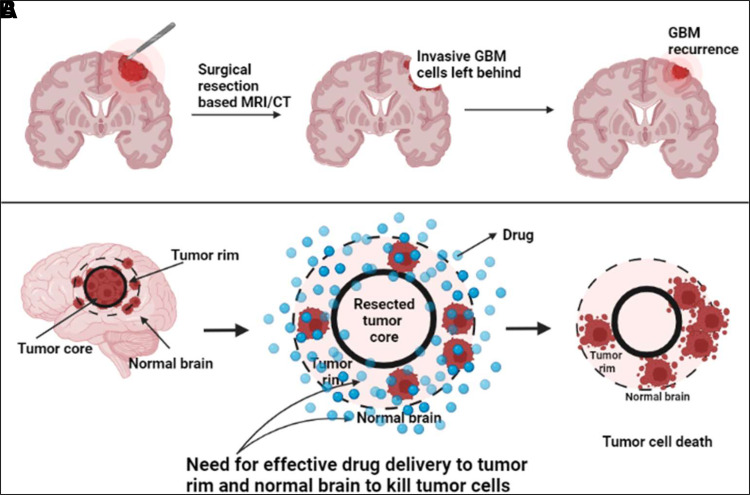
In addition to the presence of active efflux limiting CNS delivery of chemotherapeutics, the variability in the BBB disruption in and around the tumor also limits drug delivery (Parrish et al., 2015). Although it has been shown that the BBB is often leaky and disrupted in case of GBM, this disruption is almost always heterogenous because of the highly infiltrative nature of GBM. With maximum leakiness at the tumor core followed by adjacent tumor rim, integrity of the BBB is intact in surrounding normal brain area (Sarkaria et al., 2018). Because of the infiltrative nature of GBM, complete surgical resection is impossible, leaving behind tumor cells in the surrounding normal brain regions, thereby leading to tumor recurrence (Agarwal et al., 2011b). It is therefore important for molecules to be able to cross an intact BBB and to be delivered to the tumor cells sheltered behind it for effective treatment of GBM (Fig. 2). To evaluate these differences in drug accumulation within brain tumors, we examine the spatial distribution of AZD1390 in tumor-bearing mice brains.
Fig. 2.
Need for the development of brain-penetrant ATM inhibitors for radiosensitization in GBM. (A) Incomplete surgical resection due to invasive nature of GBM leads to tumor recurrence. (B) Ability to target tumor cells residing behind a relatively intact BBB in normal brain for effective treatment.
Recently published reports indicate that AZD1390 is a brain-penetrant ATM inhibitor, and although it is a substrate of active efflux in rodents from in vitro studies, it has “low efflux liability” in humans (Durant et al., 2018b; Jucaite et al., 2021). Our aim is to thoroughly investigate the role of active efflux by P-gp and Bcrp in limiting the CNS delivery of AZD1390 in mice, examine the functional activity of P-gp and Bcrp within different anatomic regions of the CNS, and evaluate its distribution within GBM patient–derived xenograft (PDX) tumors to determine its potential as a radiosensitizing agent in brain tumors.
Materials and Methods
Chemicals and Reagents
AZD1390 was obtained from AstraZeneca. Dasatinib was purchased from LC Laboratories. Elacridar was purchased from Toronto Research Chemicals. Rapid equilibrium dialysis (RED) base plate and inserts (8 kDa molecular mass cutoff, cellulose membrane) were purchased from Thermo Fisher Scientific. All other reagents were high-performance liquid chromatography-grade and were purchased from Thermo Fisher Scientific or Sigma-Aldrich.
Determination of Fraction Unbound of AZD1390 Using RED
Binding of AZD1390 was conducted in plasma, brain homogenate, and spinal cord homogenate as per the following revisions to the manufacturer’s protocol (Thermo Fisher Scientific). Mouse brain and spinal cord homogenates were freshly prepared in three volumes (w/v) of phosphate-buffered saline (PBS) (pH 7.4) on the day of experiment. Mouse plasma used was also pH-adjusted to 7.4. RED base plate was washed in 70% ethanol, dried overnight, and allowed to warm up to 37°C before the experiment. RED inserts were added to the base plate and loaded with 300 μl of AZD1390 spiked in either plasma, brain, or spinal cord homogenate in the donor compartment at a final concentration of 5 μM in 0.475% of DMSO. Five hundred microliters of PBS with 0.475% DMSO was loaded into the receiver compartment. An adhesive covering was used to seal the RED plate, and it was allowed to equilibrate on an orbital shaker at 37°C for 24 hours at 600 rpm. At the end of 24 hours, donor and receiver samples were collected and stored at −80°C prior to liquid chromatography–tandem mass spectrometry (LC-MS/MS) analysis.
Unbound fraction (fu) in the plasma was calculated using the ratio of the measured concentration in the buffer (receiver compartment) to the measured concentration in the plasma (donor compartment). For brain and spinal cord, the fu was calculated considering the dilution factor (D = 4) introduced by homogenizing the two tissues in PBS.
 |
where fu,diluted is the ratio of the measured concentration in the buffer (receiver compartment) to the measured concentration in the brain or spinal cord homogenate (donor compartment).
Animals
For pharmacokinetic studies, Friend leukemia virus strain B (FVB) wild-type, Bcrp1−/− (Bcrp knockout, BKO), Mdr1a/b−/− (P-gp knockout, PKO) and Mdr1a/b−/− Bcrp1−/− (P-gp and Bcrp knockout/triple knockout, TKO) mice (equal males and females) aged 8–14 weeks were used. Breeding license was purchased from Taconic Biosciences Inc. (Germantown, NY) and animal colonies were developed and maintained as per the breeding protocol in the Research Animal Resources housing facility at the Academic Health Center, University of Minnesota (Minneapolis, MN). Animals were maintained on a 12-hour light/dark cycle with unlimited access to food and water. Animal genotypes were routinely verified using tail snip (TransnetYX, Cordova, TN). All of the pharmacokinetic studies and surgeries were approved by the University of Minnesota Institutional Animal Care and Use Committee and carried out in accordance with the guidelines established by the National Institutes of Health (Bethesda, MD).
Tumor distribution studies were performed using female athymic nude mice (Hsd:Athymic Nude-Foxn1nu; Envigo, Indianapolis, IN) aged 4 to 5 weeks. Mice were implanted with an intracranial tumor (GBM PDX G12) transduced with a lentiviral vector for expression of enhanced green fluorescent protein and firefly luciferase 2 (G12-eGFP-FLUC2). Animals were maintained on a 12-hour light/dark cycle with unlimited access to food and water. All studies using animals were approved by the Institutional Animal Care and Use Committee, Mayo Clinic (Rochester, MN).
Drug Formulation and Dose
AZD1390 was formulated at a dose of 5 mg/kg into a solution with 30% (1:1 – ETOH: Cremophor EL) and 70% saline for intravenous administration using tail vein injection. AZD1390 was formulated at a dose of 10 mg/kg as a suspension with 0.5% w/v hydroxypropyl methylcellulose (HPMC) and 0.1% w/v Tween 80 for oral dosing using oral gavage in pharmacokinetic studies. For oral dosing in the tumor distribution study with GBM 12 tumors, AZD1390 was given at a dose of 20 mg/kg in the same formulation. In the steady-state infusion study, AZD1390 was loaded at a concentration of 10 mg/ml in DMSO and administered at a rate of 10 μg/h using Alzet osmotic pump (1003D; Durect Corporation, Cupertino, CA). Elacridar was formulated in a microemulsion at a 10-mg/kg dose (Sane et al., 2012) and was administered intraperitoneally for the efflux inhibition study with AZD1390.
CNS Distribution of AZD1390 after Intravenous and Oral Administration
CNS distribution and systemic pharmacokinetics of AZD1390 was evaluated after an intravenous bolus dose of 5 mg/kg in FVB wild-type, BKO, PKO, and TKO mice. Similarly, a single oral dose of 10 mg/kg of AZD1390 was administered to FVB wild-type and TKO mice. Blood, brain, and spinal cord were harvested from 10 minutes to 12 hours (n = 4 at each time point) after dose administration. Blood samples were stored on ice and immediately centrifuged at 7500 rpm for 10 minutes to separate plasma. Brain and spinal cord were immediately dipped in ice-cold saline on collection and rolled on tissue paper to wipe off excess blood. Samples were stored at −80°C and analyzed using LC-MS/MS.
CNS Distribution of AZD1390 with Pharmacological Inhibition of Efflux Using Elacridar
Impact of pharmacological inhibition of P-gp and Bcrp efflux was evaluated using the coadministration of elacridar in FVB wild-type and TKO mice along with AZD1390. Ten milligrams per kilogram AZD1390 was administered using oral gavage along with 10 mg/kg elacridar administered intraperitoneally at the same time. Blood, brain, and spinal cord were harvested 2 hours (n = 4) after AZD1390 and elacridar dose. Blood samples were stored on ice and immediately centrifuged at 7500 rpm for 10 minutes to separate plasma. Brain and spinal cord were immediately dipped in ice-cold saline upon collection and rolled on tissue paper to wipe off excess blood. Samples were stored at −80°C and analyzed using LC-MS/MS.
Distribution of AZD1390 within Different Anatomic Regions of the CNS after Steady-State Infusion
CNS distribution of AZD1390 at steady state was evaluated by implanting Alzet osmotic pumps into the intraperitoneal cavity of FVB wild-type, BKO, PKO, and TKO mice to release AZD1390 at 10 μg/h (Agarwal et al., 2010). Twenty-four hours after the pump implantation (greater than eight half-lives), mice were sacrificed and blood, brain, and spinal cord were collected (n = 5 for each genotype). Blood samples were stored on ice and immediately centrifuged at 7500 rpm for 10 minutes to separate plasma. Brain and spinal cord were immediately dipped in ice-cold saline on collection and rolled on tissue paper to wipe off excess blood. Brain was quickly dissected into the following anatomic regions: cortex, cerebellum, hypothalamus and thalamus, and spinal cord. Samples were stored at −80°C and analyzed using LC-MS/MS.
Regional Distribution of AZD1390 in G12 PDX TumorBearing Mouse Brains
AZD1390 was dosed orally at 20 mg/kg to the G12-eGFP-FLUC2 tumor–bearing mice 18 days after tumor implantation. Blood and brain were collected at 4 and 12 hours after the oral dose. Blood samples were stored on ice and immediately centrifuged at 7500 rpm for 10 minutes to separate plasma. Brain was immediately dipped in ice-cold saline on collection and rolled on tissue paper to wipe off excess blood and flash frozen. Frozen brains were sliced and punched using fluorescence-guided punch biopsy technique described earlier (Gampa et al., 2020; Talele et al., 2021). Tumor-bearing brains were divided into the following regions: tumor core (tumor regions with fluorescence intensity five times greater than the background), tumor rim (tumor regions with fluorescence intensity three to five times greater than the background, and normal brain (not above background fluorescence). Samples were stored at −80°C and analyzed using LC-MS/MS.
LC-MS/MS Analysis
Concentrations of AZD1390 within the plasma, brain, spinal cord, and tumor region specimens were evaluated using LC-MS/MS analysis. Brain, spinal cord, and tumor regions were homogenized in three volumes of 5% bovine serum albumin prior to analysis. Twenty-five microliters plasma and 100 μl of brain and spinal cord homogenate were used for analysis. AZD1390 and the internal standard, dasatinib, were extracted from each unknown and standard matrix by liquid-liquid extraction using five volumes of ice-cold ethyl acetate and one volume of ice-cold pH 11 buffer (sodium bicarbonate–sodium hydroxide buffer solution). Samples were then vortexed for 5 minutes followed by centrifugation at 7500 rpm for 10 minutes. Sample tubes were then cooled at −80°C for 20 minutes to conveniently separate the supernatant organic phase containing the drug. This supernatant was dried under nitrogen gas followed by reconstitution with mobile phase prior to injection. A reverse-phase liquid chromatographic separation method was used on the ACQUITY ultraperformance liquid chromatography (UPLC) system (Waters Corporation, Milford, MA) paired with the Micromass Quattro Ultima mass spectrometer (Waters Corporation) operated in the positive ionization mode. 7.5 μl of the reconstituted sample was injected into the UPLC system at a flow rate of 0.5 ml/min into a Synergy 4μm Polar-RP 80Å column (75 × 2 mm; Phenomenex, Torrance, CA) for chromatographic separation. An isocratic method with a runtime of 4 minutes was developed. The mobile phase composition was 65% distilled and filtered water with 0.1% formic acid and 35% acetonitrile with 0.1% formic acid. The retention time was 0.9 minutes for AZD1390 and 0.84 minutes for dasatinib. The mass-to-charge (m/z) transition for AZD1390 was 478.3 → 126.06, and dasatinib was 488.21 → 400.99. MassLynx (Waters Corporation) software was used to acquire and analyze the LC-MS/MS data. The limit of quantification (LOQ) was 1 ng/ml for all matrices. For every sample run, the standard calibration curve was linear from 1 to 2000 ng/ml (weighted 1/Y2) with a coefficient of variation less than 15%. All of the measured concentrations fell within the range of the standard curve.
Pharmacokinetic Calculations and Noncompartmental Analysis
Noncompartmental analysis (NCA) was performed using Phoenix WinNonlin Version 8.3 (Certara USA Inc., Princeton, NJ), to obtain pharmacokinetic parameters from the concentration-time profiles after intravenous and oral dosing in the plasma, brain, and spinal cord. Exposure after dosing, measured by area under the curve (AUC) for plasma, brain, and spinal cord, is calculated by the linear trapezoidal integration method. In this method, the AUC until the last measured time point (AUClast) is calculated by area integration and the AUC0→∞ is extrapolated by dividing the concentration at the last measured time point (Clast) by the first-order terminal elimination rate constant (λz), estimated from the log-linear portion of the concentration-time profile by the linear regression of time versus log concentration. The percentage of AUC extrapolation from the last measured time-point (tlast) to infinity was <10% in all cases, indicating adequate capture of drug exposure from our pharmacokinetic study design. Variances for AUClast are determined by Phoenix using the Bailer method (Bailer, 1988). We determined the variances for AUC0→∞ using the Yuan modification of the Bailer method (Yuan, 1993).
Other pharmacokinetic parameters using NCA are calculated using the following equations:
 |
 |
 |
where mean residence time (MRT)inf is the area under the first moment curve to infinity divided by area under the curve to infinity. The volume of distribution at steady state (Vss) is calculated for intravenous bolus dose. For oral administration, apparent volume of distribution (Vd/F) is calculated by:
 |
The brain or spinal cord tissue partition coefficients (Kp) were calculated using the following equation for intravenous and oral administration:
 |
The steady-state brain region or spinal cord tissue partition coefficient (Kp) was calculated using:
 |
An instantaneous tissue partition coefficient (Kpt) was determined for the efflux inhibition study and tumor distribution study of AZD1390 at a particular time point for brain, spinal cord, tumor core, and rim as follows:
 |
The free brain or spinal cord tissue partition coefficients (Kpuu) were determined as follows:
 |
Free distribution advantage (DAfree) was used to compare the relative unbound exposure in the brain and spinal cord for AZD1390 between the genetic knockout mice (BKO, PKO, and TKO) and wild-type mice.
 |
Oral bioavailability of AZD1390 was calculated using oral and intravenous doses and exposures using the following equation:
 |
Statistical Analysis
Data were presented using the GraphPad Prism software (Version 8; GraphPad software, La Jolla, CA). Data are represented as mean ± standard deviation in all figures and tables. Statistical tests were also conducted within GraphPad Prism and in all cases, P < 0.05 was considered statistically significant. For comparisons between two groups, an unpaired Student t test was used to generate P values. For comparisons among multiple groups, one-way analysis of variance (ANOVA) followed by multiple comparisons using the Holm-Sidak test were used to generate adjusted P values.
Results
Pharmacokinetics after Intravenous Administration of AZD1390
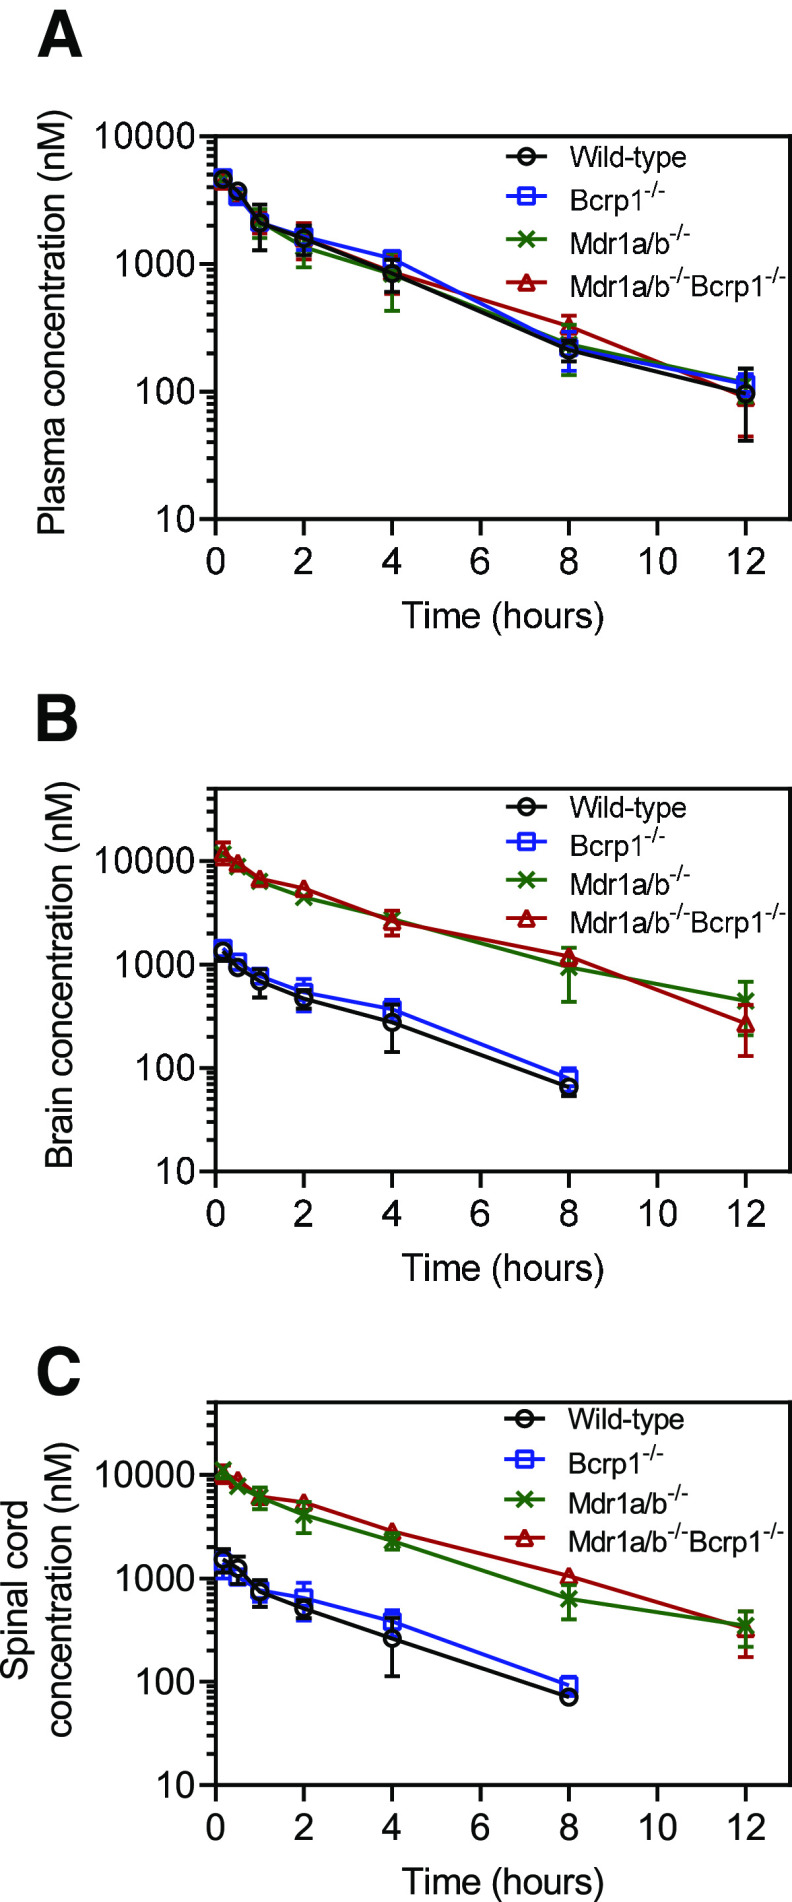
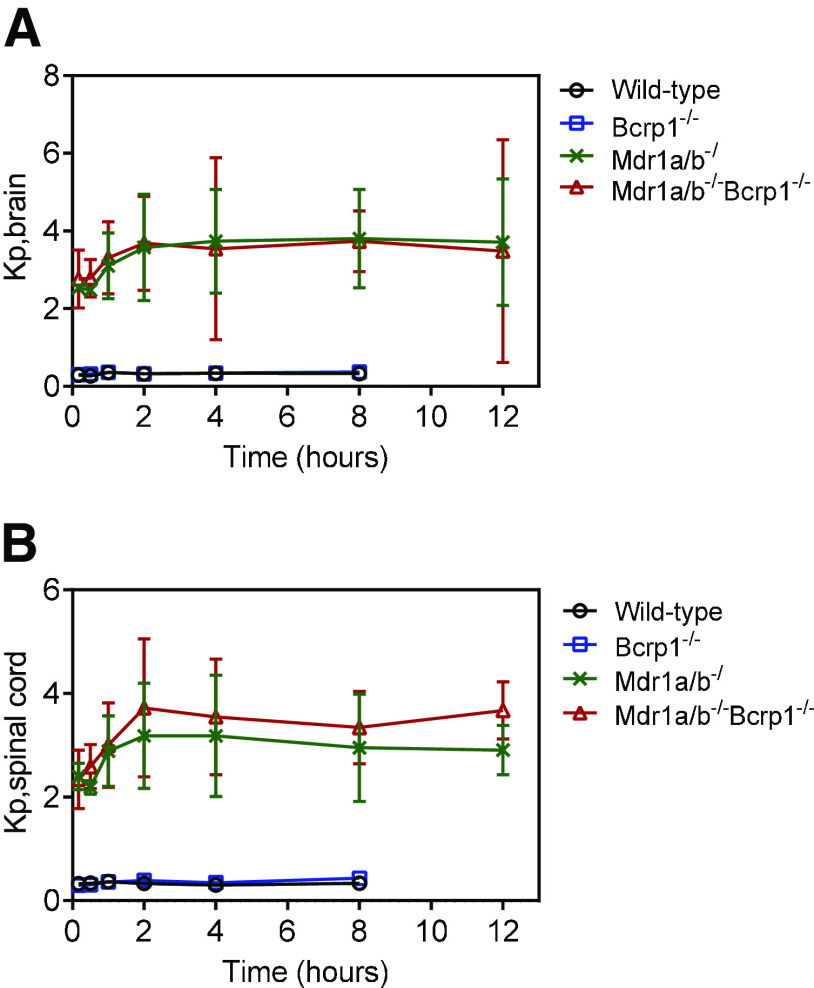
We evaluated the plasma, brain, and spinal cord distribution of AZD1390 in wild-type, BKO, PKO, and TKO mice after an intravenous bolus dose of 5 mg/kg. Concentrations in plasma for all four genotypes are depicted in Fig. 3A. AUC0–∞ plasma is not significantly different across genotypes (P > 0.05) (Table 1). This indicates that the systemic exposure, hence the clearance, of AZD1390 does not change across the four genotypes. Pharmacokinetic parameters were calculated using NCA, and the elimination half-life (t1/2) was 2.6 hours, systemic clearance (CL) was 0.95 l/h/kg, and volume of distribution at steady state (Vss) was 2.7 l/kg in wild-type mice. These pharmacokinetic parameters remain similar across the four genotypes (Table 1). Concentrations in brain are depicted in Fig. 3B. Brain concentrations are the highest in TKO mice, similar to PKO mice, followed by lower concentrations in BKO mice, similar to wild-type mice. The same trends are observed for concentrations in spinal cord (Fig. 3C). AUC0–∞ brain and spinal cord are highest in TKO mice followed by PKO, BKO, and wild-type mice. AUC0-∞ brain and spinal cord are significantly greater in the TKO, PKO, and BKO mice compared with the wild-type mice (P < 0.05) (Table 1). The change in the Kpbrain and Kpspinal cord with respect to time is depicted in Fig. 4. Kpbrain is highest in TKO mice (3.13) and equal to PKO mice (3.13), followed by BKO (0.32) and wild-type (0.29) mice (Table 1). Similarly, Kpspinal cord is highest in TKO mice (3.03), followed by PKO (2.7), BKO (0.32), and wild-type (0.29) mice (Table 1). These results are clearly indicative of active efflux by P-gp contributing to the limited brain and spinal cord delivery of AZD1390.
Fig. 3.
Pharmacokinetics of AZD1390 after intravenous administration. Data represent mean ± S.D. (n = 4). Concentration-time profiles of AZD1390 in (A) plasma, (B) brain, and (C) spinal cord after a single intravenous bolus dose of 5 mg/kg in FVB wild-type, BKO, PKO, and TKO mice.
TABLE 1.
Summary of pharmacokinetic parameters in plasma, brain, and spinal cord in FVB wild-type, BKO, PKO, and TKO mice after an intravenous bolus dose of 5 mg/kg AZD1390
| Parameter | Units | Plasma | Brain | Spinal Cord | |||||||||
|---|---|---|---|---|---|---|---|---|---|---|---|---|---|
| Wild-Type | Bcrp1−/− | Mdr1a/b−/− | Mdr1a/b−/− Bcrp1−/− | Wild-Type | Bcrp1 −/− | Mdr1a/b−/− | Mdr1a/b−/− Bcrp1−/− | Wild-Type | Bcrp1−/− | Mdr1a/b−/− | Mdr1a/b−/− Bcrp1−/− | ||
| t 1/2 | hour | 2.6 | 2.4 | 2.8 | 2.5 | 2.0 | 1.8 | 3.0 | 2.4 | 2.1 | 2.1 | 2.7 | 2.5 |
| CL | l/hr/kg | 0.95 | 0.88 | 0.97 | 0.92 | ||||||||
| Vss | l/kg | 2.7 | 2.7 | 3.0 | 2.9 | ||||||||
| AUC0–∞ | hr*ng/ml | 5261 ± 295 | 5690 ± 197 | 5178 ± 361 | 5452 ± 306 | 1542 ± 111 | 1814 ± 97 | 16,221 ± 752 | 17,043 ± 684 | 1684 ± 129 | 1960 ± 128 | 13,949 ± 718 | 16,566 ± 445 |
| Kp | 0.29 | 0.32 | 3.13 | 3.13 | 0.32 | 0.34 | 2.7 | 3.03 | |||||
| fu | 0.203 ± 0.025 | 0.075 ± 0.002 | 0.11 ± 0.008 | ||||||||||
| Kpuu | 0.1 | 0.12 | 1.16 | 1.16 | 0.17 | 0.18 | 1.46 | 1.64 | |||||
| DAfree | 1 | 1.2 | 11.6 | 11.6 | 1 | 1.1 | 8.6 | 9.6 | |||||
Fig. 4.
Brain-to-plasma and spinal cord-to-plasma ratios after intravenous administration. Data represent mean ± S.D. (n = 4). (A) Brain-to-plasma ratio and (B) spinal cord-to-plasma ratio over time after a single intravenous bolus dose of 5 mg/kg in in FVB wild-type, BKO, PKO and TKO mice.
Pharmacokinetics after Oral Administration of AZD1390
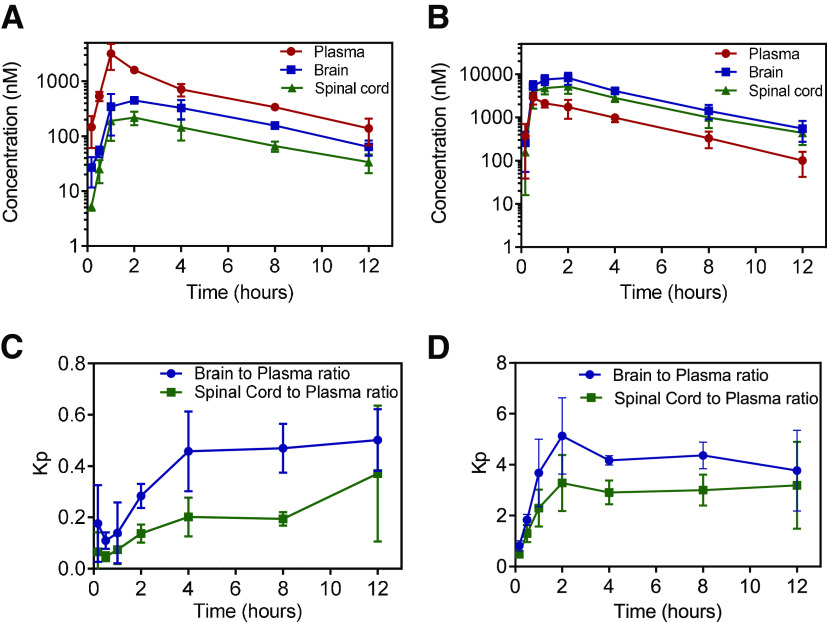
We evaluated the plasma, brain, and spinal cord distribution of AZD1390 in wild-type and TKO mice after a single oral dose of 10 mg/kg. Concentrations are highest in plasma followed by brain and spinal cord in wild-type mice (Fig. 5A). Plasma concentrations reach a maximum at 1 hour, whereas brain and spinal cord concentrations reach a maximum at 2 hours. Conversely, in TKO mice, concentrations are highest in brain followed by spinal cord and lowest in plasma (Fig. 5B). Plasma concentrations reach a maximum at 0.5 hours, whereas brain and spinal cord concentrations reach a maximum at 2 hours. Systemic exposure of AZD1390, indicated by AUC0–∞ plasma, is not significantly different between wild-type and TKO mice (P > 0.05) (Table 2). The t1/2 was 3.4 hours, apparent systemic clearance (CL/F) was 2.2 l/h/kg, and the apparent volume of distribution (Vd/F) was 10.7 l/kg in wild-type mice. These pharmacokinetic parameters were similar in TKO mice. Comparison of the areas under the curve for plasma between intravenous and oral administration (eq. 11), indicates the oral bioavailability (F) of AZD1390 in wild-type and TKO mice. There was no apparent difference in the oral bioavailability between wild-type (0.43) and TKO mice (0.48). These results indicate that P-gp and Bcrp do not have an influence on the oral absorption and systemic clearance of AZD1390. However, AUC0–∞ brain and spinal cord are significantly higher in TKO mice compared with wild-type mice (P < 0.05). The changes in Kpbrain and Kpspinal cord with respect to time are depicted in Fig. 5, C and D. Kpbrain and Kpspinal cord reach a distributional equilibrium at 4 hours, after which they appear to hit a plateau. Kpbrain is higher in TKO mice (3.72) compared with wild-type (0.32) mice (Table 2). Similarly, Kpspinal cord is higher in TKO mice (2.52) compared with wild-type (0.23) mice (Table 2). These results are indicative of limited brain delivery of AZD1390 to the CNS through active efflux at the BBB.
Fig. 5.
Pharmacokinetics of AZD1390 after oral administration. Data represent mean ± S.D. (n = 4). Plasma, brain, and spinal cord concentrations of AZD1390 in (A) FVB wild-type, and (B) TKO mice; brain-to-plasma and spinal cord-to-plasma ratios of AZD1390 with time in (C) FVB wild-type and (D) TKO mice after a single oral dose of 10 mg/kg.
TABLE 2.
Summary of pharmacokinetic parameters in plasma, brain, and spinal cord in FVB wild-type and TKO mice after a single oral dose of 10 mg/kg AZD1390
| Parameter | Units | Plasma | Brain | Spinal Cord | |||
|---|---|---|---|---|---|---|---|
| Wild-Type | Mdr1a/b−/− Bcrp1−/− | Wild-Type | Mdr1a/b−/− Bcrp1−/− | Wild-Type | Mdr1a/b−/− Bcrp1−/− | ||
| Tmax | hour | 1 | 0.5 | 2 | 2 | 2 | 2 |
| Cmax | ng/ml | 1523 ± 435 | 1367 ± 207 | 215 ± 11 | 3925 ± 599 | 104 ± 14 | 2491 ± 404 |
| t 1/2 | hour | 3.4 | 3.3 | 3.4 | 2.8 | 3.9 | 2.8 |
| CL/F | l/hr/kg | 2.2 | 1.9 | ||||
| Vd/F | l/kg | 10.7 | 9.0 | ||||
| AUC0-∞ | hr*ng/ml | 4543 ± 538 | 5313 ± 795 | 1440 ± 131 | 19,783 ± 1378 | 1057 ± 224 | 13,410 ± 967 |
| Oral Bioavailability | 0.43 | 0.48 | |||||
| Kp | 0.32 | 3.72 | 0.23 | 2.52 | |||
| Kpuu | 0.12 | 1.37 | 0.12 | 1.37 | |||
| DAfree | 1 | 11.4 | 1 | 11.4 | |||
Tmax, time to reach Cmax.
Effect of Binding on the Free Drug Partitioning of AZD1390
We evaluated the effect of AZD1390 binding to plasma, brain homogenate, and spinal cord homogenate on its free drug partitioning into the CNS. AZD1390 is highly bound to brain and spinal cord homogenate when compared with plasma. Although the unbound percentage of AZD1390 is 20.3% in plasma, it is 11% in spinal cord and 7.5% in brain (Table 1). This differential binding of AZD1390 to brain and spinal cord compared with plasma will affect the partitioning of unbound AZD1390 to these organs. Free drug partition coefficient (Kpuu) is calculated by accounting for plasma and brain/spinal cord free fraction along with the Kp determined from total concentrations. Due to the high extent of binding to all of these tissues, the Kpuu brain and spinal cord for AZD1390 is further lowered compared with Kp. Kpuu,brain is highest in the TKO (1.16) and PKO (1.16) mice, followed by a lower value in BKO (0.12) mice, similar to the wild-type (0.10) mice after intravenous administration (Table 1). Similarly, Kpuu,spinal cord is highest in TKO (1.64) mice, followed by PKO (1.46), BKO (0.18), and wild-type (0.17) mice (Table 1). Free distribution advantage (DAfree), indicative of the ability of the unbound drug to be delivered across the BBB and made possible by the lack of efflux in the knockout mice, shows a similar trend to the Kpuu. The highest DAfree is observed in TKO and PKO mice, followed by the BKO mice, in both brain and spinal cord. Similarly, in case of oral administration, Kpuu,brain and Kpuu,spinal cord are 1.37 in TKO mice and 0.12 in wild-type mice, leading to a DAfree of 11.4 in TKO mice (Table 2). There are no apparent differences between Kpuu and DAfree in the brain and spinal cord when accounting for AZD1390 binding.
Effect of Administration of Elacridar on the Brain and Spinal Cord Delivery of AZD1390
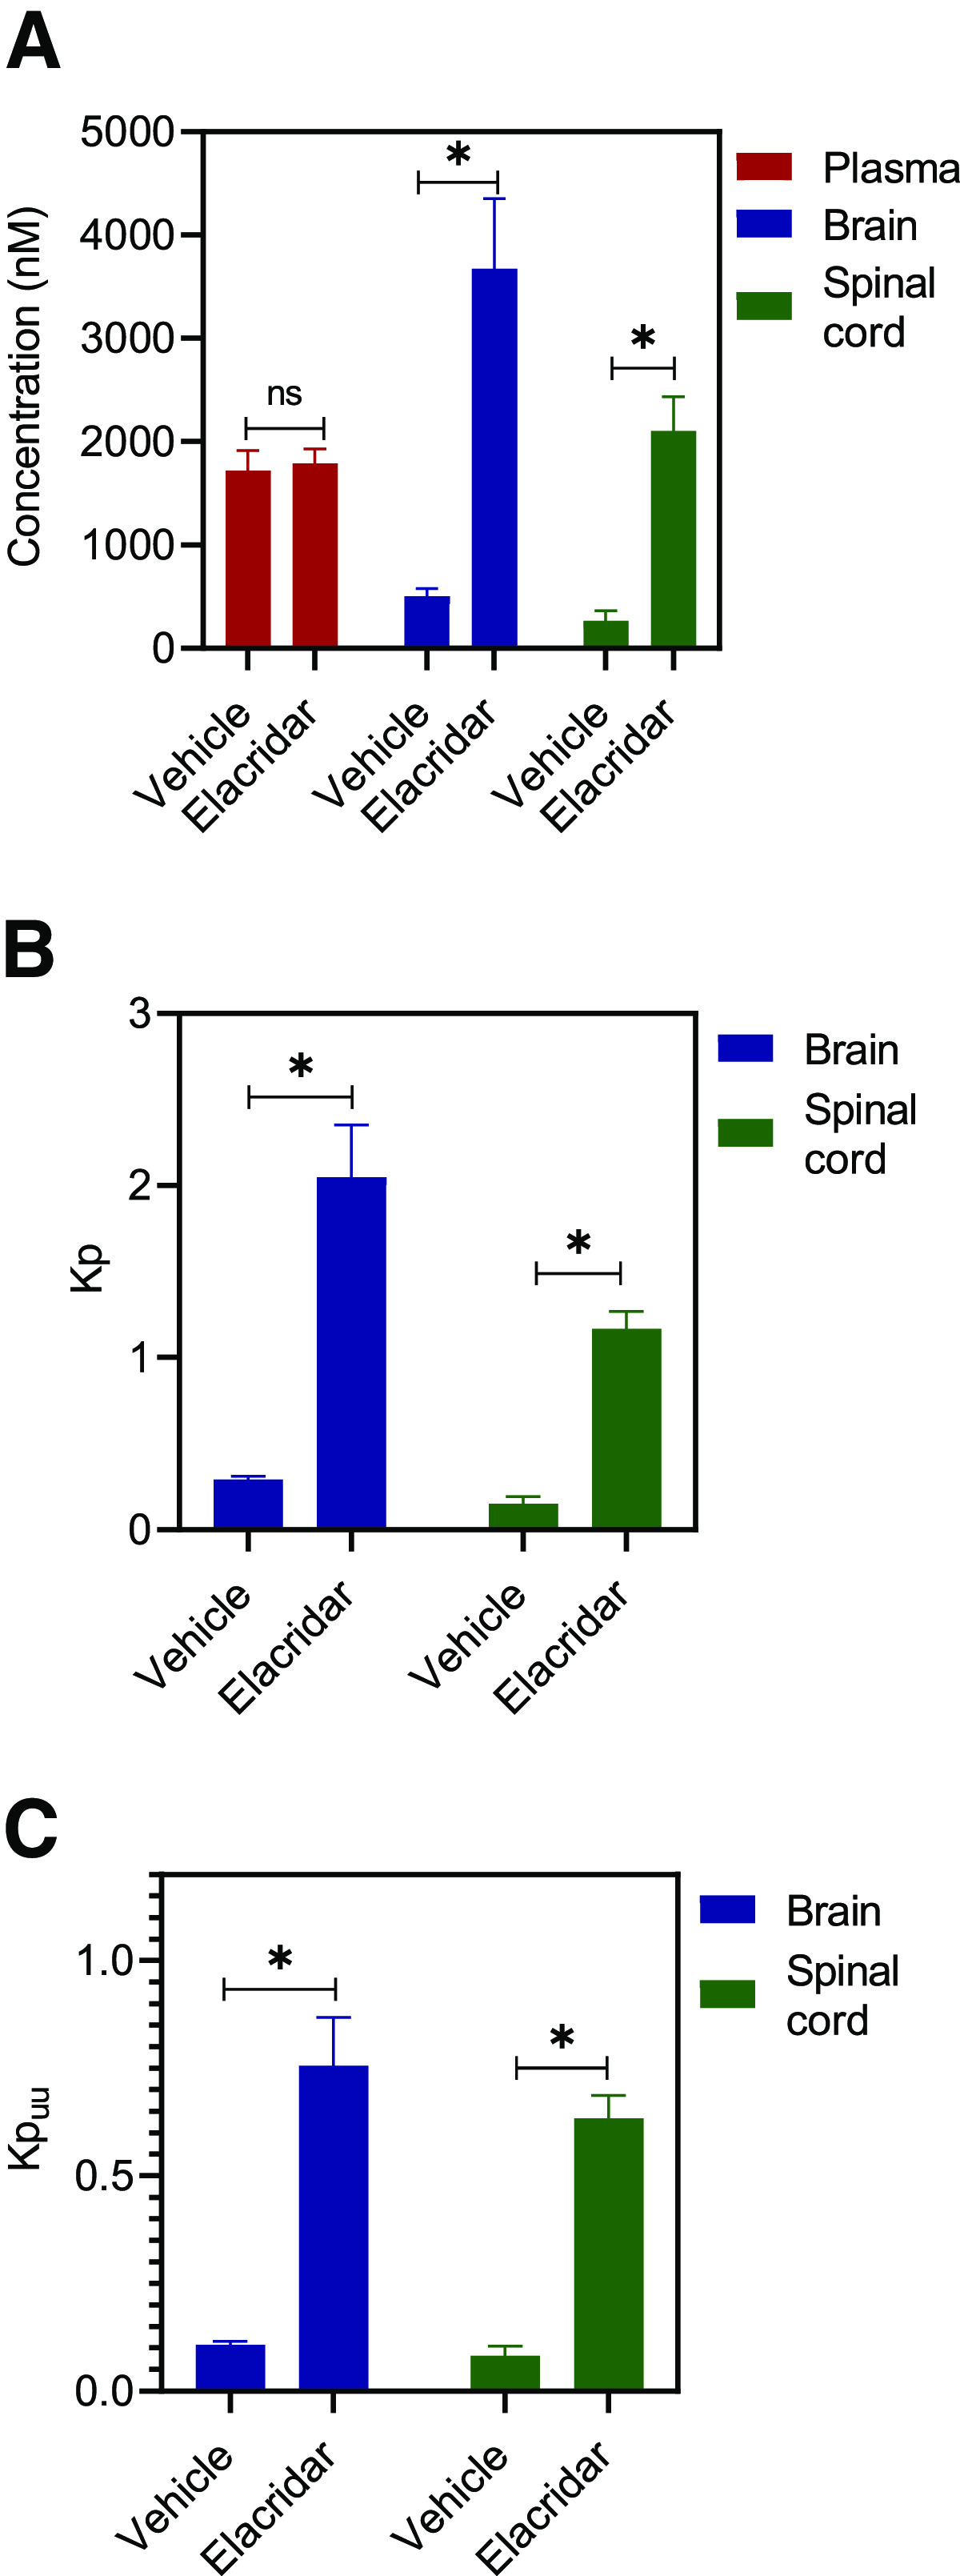
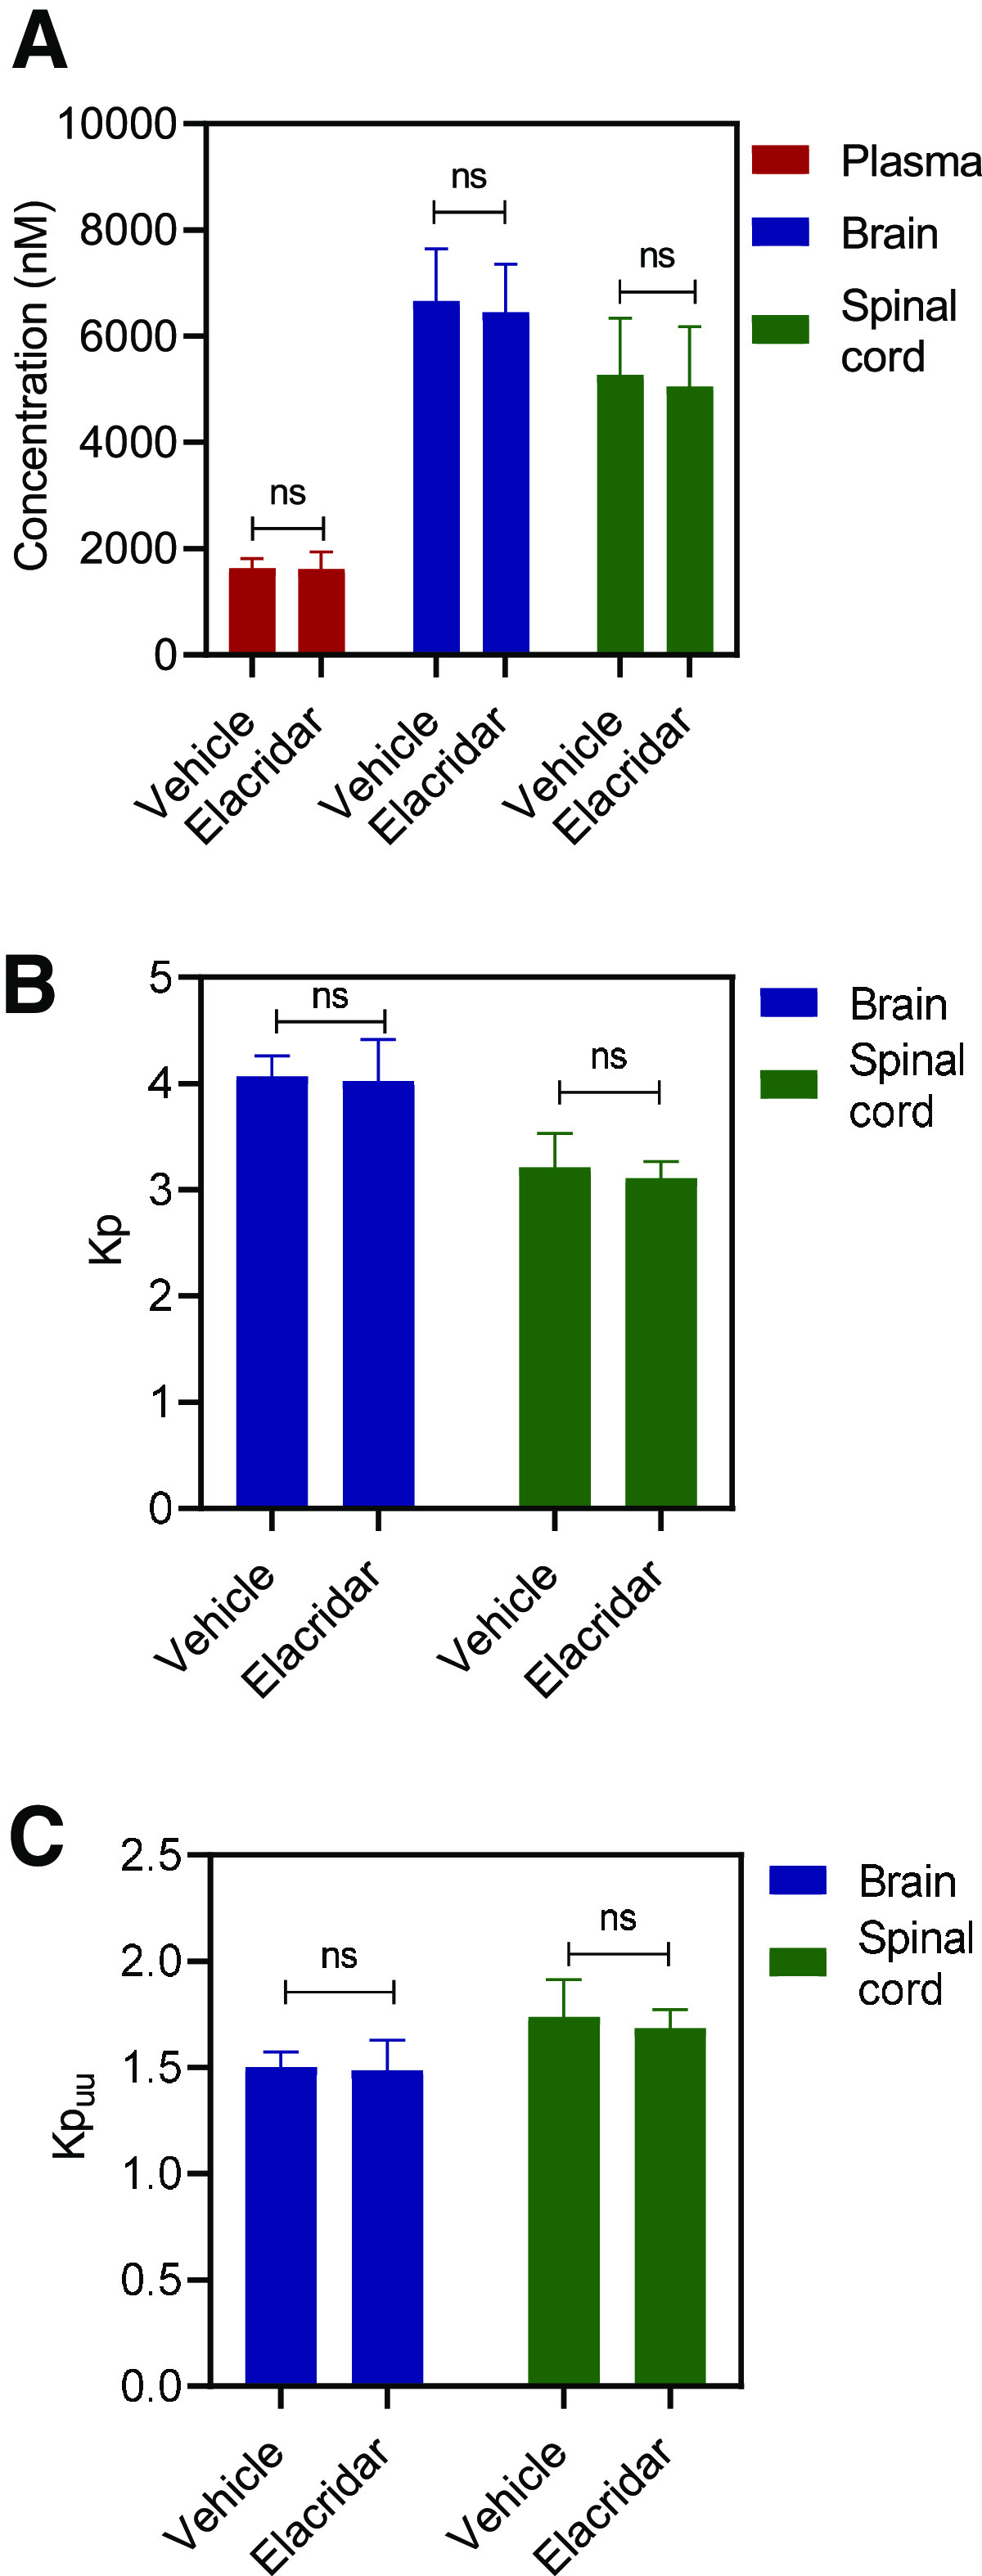
We evaluated the effect of efflux inhibition using elacridar, a dual inhibitor of P-gp and Bcrp, on the CNS distribution of AZD1390 in both wild-type and TKO mice. Figure 6 depicts the results from wild-type mice. We observe that the plasma concentrations remain unchanged; however, the brain and spinal cord concentrations significantly increase (P < 0.05) upon the coadministration of elacridar (Fig. 6A). This translates into an approximately 7-fold increase in the Kp2hr of both brain and spinal cord on elacridar coadministration (Fig. 6B). Kpuu,2hr for brain and spinal cord are depicted in Fig. 6C. These results clearly indicate that inhibition of P-gp–mediated efflux at the BBB improves the CNS delivery of AZD1390. However, a single 2-hour time point cannot entirely characterize the time course of AZD1390 concentration changes to the brain on the coadministration of elacridar. This single time point study has been conducted to demonstrate the effect that a pharmacological inhibitor of P-gp can have on the brain delivery of AZD1390, and thorough characterization is necessary before recommending the use of elacridar to increase AZD1390 brain delivery. Figure 7 describes the effects of elacridar coadministration in TKO mice. There are no significant changes in plasma, brain, and spinal cord concentrations, nor are there in the Kp and Kpuu values (Fig. 7). This clearly indicates that in mice lacking both P-gp and Bcrp, there is no effect on the CNS distribution of AZD1390 with the coadministration of elacridar.
Fig. 6.
Impact of efflux inhibition using elacridar in FVB wild-type mice. Data represent mean ± S.D., n = 4. *P < 0.05. (A) Plasma, brain and spinal cord concentrations; (B) Kpbrain and Kp spinal cord; and (C) Kpuu,brain and Kpuu,spinal cord at 2 hours after coadministration of 10 mg/kg oral AZD1390 and 10 mg/kg intraperitoneal elacridar in wild-type mice.
Fig. 7.
Impact of efflux inhibition using elacridar in TKO mice. Data represent mean ± S.D. (n = 4). *P < 0.05. (A) Plasma, brain and spinal cord concentrations; (B) Kpbrain and Kp spinal cord; and (C) Kpuu,brain and Kpuu,spinal cord at 2 hours after coadministration of 10 mg/kg oral AZD1390 and 10 mg/kg intraperitoneal elacridar in TKO mice.
Regional Distribution within the CNS after a Steady-State Infusion of AZD1390
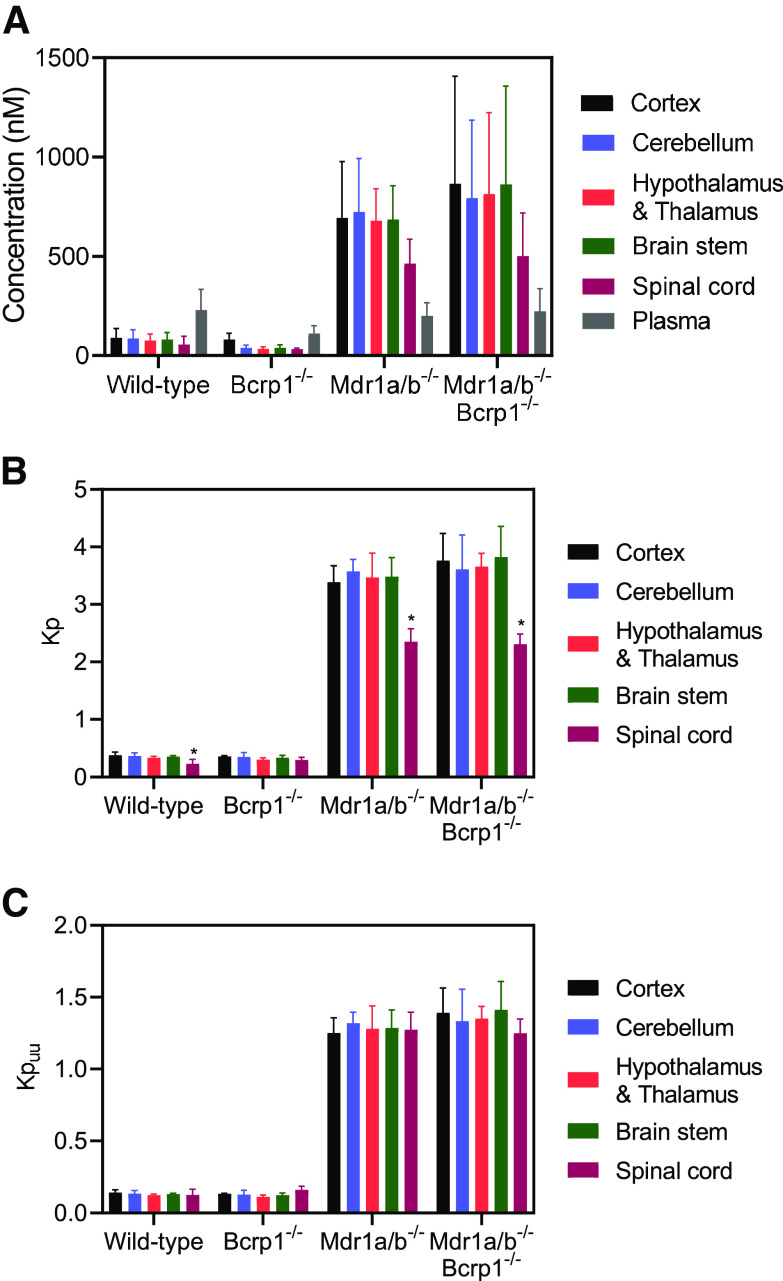
We examined differences in AZD1390 concentrations within different anatomic regions of the CNS after a steady-state infusion in wild-type, BKO, PKO, and TKO mice. We observed that within the same genotype, there were no significant differences (P > 0.05) among these different anatomic regions, namely the cortex, cerebellum, hypothalamus and thalamus, brain stem, and spinal cord (Fig. 8A). However, as we observed in our intravenous administration study, the CNS regional concentrations were lowest in the wild-type and BKO mice followed by increased concentrations in the PKO and TKO mice, confirming P-gp–mediated active efflux at the BBB. Partitioning of AZD1390 within different anatomic regions of the CNS showed no significant differences except Kpspinal cord, which was lower than other brain regions in the wild-type, PKO, and TKO mice (P < 0.05) (Fig. 8B). However, on accounting for free fraction of brain and spinal cord, Kpuu was not significantly different across different anatomic regions of the CNS within the same genotype (P > 0.05) (Fig. 8C). Kpuu was the lowest in wild-type mice and not different than the BKO mice (P > 0.05), followed by a significant increase in the PKO and TKO mice (P < 0.05) for all of the regions. Our regional distribution studies strongly indicate that AZD1390 distribution is not different among different anatomic regions of the CNS. In addition, the impact of efflux activity on AZD1390 distribution is functionally similar across different regions of the CNS.
Fig. 8.
CNS regional distribution of AZD1390 after steady-state infusion. Data represent mean ± S.D. (n = 4 to 5). *P < 0.05. (A) Concentration of AZD1390 within the cortex, cerebellum, hypothalamus and thalamus, brain stem, spinal cord, and plasma; (B) regional Kp; and (C) regional Kpuu of AZD1390 within the cortex, cerebellum, hypothalamus and thalamus, brain stem, and spinal cord in FVB-wild type, BKO, PKO, and TKO mice after a steady-state infusion of 10 μg/h for 24 hours.
Distribution of AZD1390 to GBM 12 PDX Tumor Model in Mice
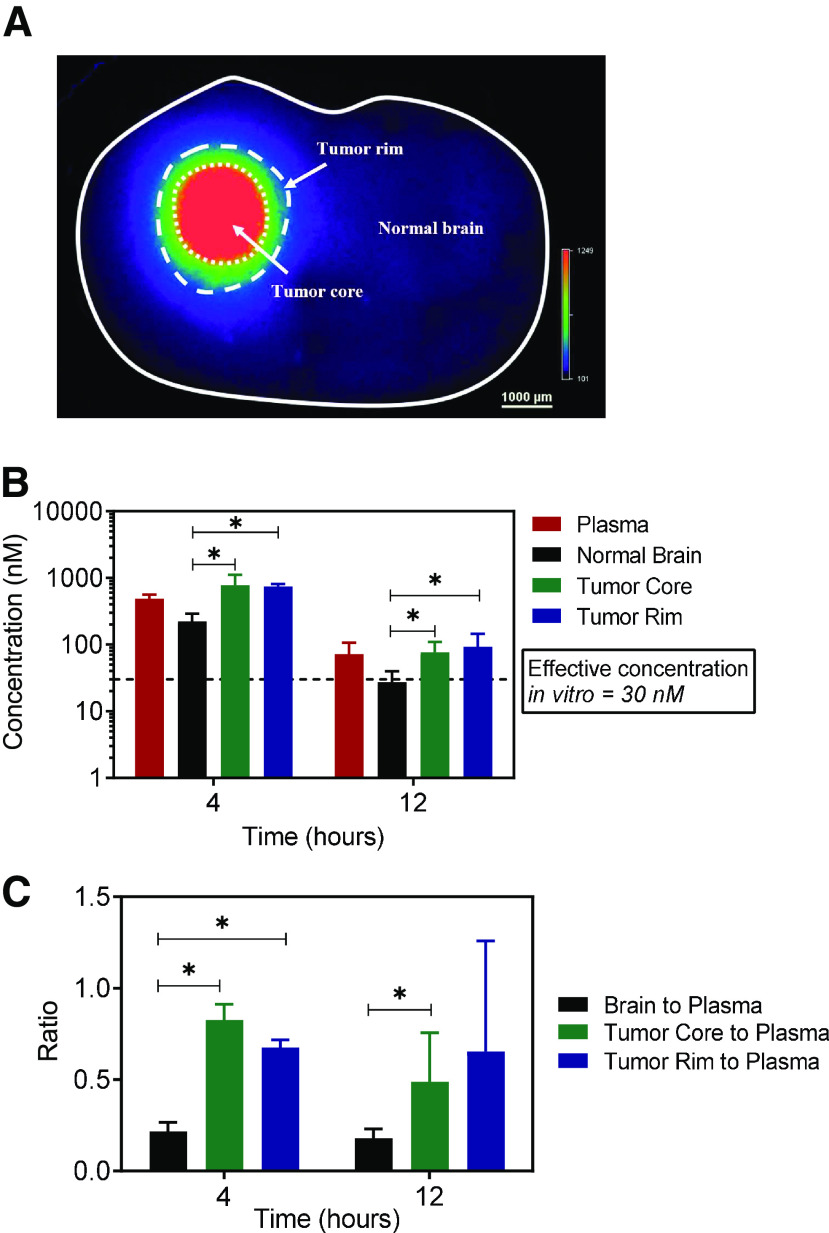
We evaluated the distribution of AZD1390 in GBM 12 tumor–bearing mouse brains to examine if effective concentrations were achieved within different regions of the tumor-bearing brain at the dose of 20 mg/kg. Fig. 9A is a brain slice image from the GBM 12 tumor–bearing mouse brain depicting tumor core, tumor rim, and the surrounding normal brain. These regions were evaluated for differences in AZD1390 concentration at 4 and 12 hours after dosing. We observe that AZD1390 distribution varies depending on the region and that the region with the greatest accumulation among the different regions is the tumor core at both time points (Fig. 9B). Concentration in the tumor rim is not significantly different from the tumor core (P > 0.05) (Fig. 9B). However, concentration in the normal brain is significantly lower than the tumor rim and tumor core at both of the time points (P < 0.05) (Fig. 9B). This heterogeneity in AZD1390 distribution within tumor-bearing brain is reflected in the Kpt values, where Kpnormal brain is significantly lower than the Kptumor rim and Kptumor core at both time points (P < 0.05) (Fig. 9C). According to a previously published report, a total concentration 30 nM AZD1390 in media shows effective radiosensitization in GBM tumor cells (Chen et al., 2020). Despite these differences in AZD1390 accumulation within the tumor core and rim as opposed to the normal brain, we see that total concentrations are above 30 nM in all of these tumor and brain regions as well as the plasma. These results indicate that despite lower concentrations in the normal brain as opposed to tumor core and rim, at the examined dose AZD1390 might be able to showcase potent radiosensitizing activity in GBM.
Fig. 9.
Tumor distribution of AZD1390 in GBM 12 PDX mouse brains. Data represent mean ± S.D. (n = 4 to 5). *P < 0.05. (A) Brain slice used for tumor carving; (B) concentration in plasma, tumor core, tumor rim, and normal brain; and (C) Kp in tumor core, tumor rim, and normal brain in GBM 12 tumor–bearing mouse brains dosed with 20 mg/kg of AZD1390 and harvested at 4 and 12 hours.
Discussion
The discovery and development of brain-penetrant molecules for GBM is crucial to achieve a breakthrough treatment. Surgical resection, whenever possible, is not able to effectively rid the brain of tumor because of the highly infiltrative nature of the disease (Fig. 2). Invasive tumor cells find sanctuary behind an intact BBB in the surrounding normal brain region and continue to proliferate, leading to tumor recurrence (Sarkaria et al., 2018). However, RT, a cornerstone of GBM treatment, when combined with a potent and brain-penetrant radiosensitizing agent, may be an important step forward (Fig. 2).
AZD1390 is a novel, potent ATM inhibitor developed by structurally modifying a potent ATM inhibitor, AZD0156, for enhanced brain penetration (Durant et al., 2018). In vitro studies with human multidrug resistance protein 1 (MDR1) and BCRP showed that AZD1390 is not a significant substrate of human P-gp and Bcrp. However, a low brain penetration was observed in rats and mice with Kpuu of 0.17 and 0.04, respectively (Durant et al., 2018b). Our studies were designed to thoroughly investigate CNS delivery of AZD1390 in mice using transporter knockout models lacking P-gp and Bcrp.
Pharmacokinetic studies after an intravenous dose indicate that AZD1390 is a substrate of P-gp in mice; however, Bcrp does not limit brain or spinal cord delivery. As such, there is no functional compensation by P-gp in the Bcrp knockout mice, as has been previously observed for several targeted anticancer agents (Kodaira et al., 2010; Agarwal et al., 2011a). The current study examined the influence of two important efflux systems at the BBB and reports significant effects by P-gp. Given the variety of factors involved in determining the brain distribution of AZD1390, efflux is one mechanism limiting the brain delivery of AZD1390. The scope of the current study was to examine the impact of active efflux by P-gp and Bcrp on the CNS delivery of AZD1390. Our results indicate that the efflux mechanism for limiting AZD1390 is due to P-gp. CNS exposure after oral administration was determined to inform preclinical in vivo efficacy studies. Oral bioavailability showed no apparent differences between wild-type and TKO mice. This lack of effect of P-gp on the systemic absorption of AZD1390 can be attributed to the possibility of saturation of intestinal P-gp efflux by high concentrations of AZD1390 in the intestinal lumen (Lin and Yamazaki 2003; Oostendorp et al., 2009). This lack of effect on oral absorption contrasts with the significant limiting effect of P-gp on delivery of AZD1390 across the BBB. The tissue partition coefficients of total drug to the brain and spinal cord were 0.32 and 0.23, respectively, in transporter intact mice.
Importantly, this total CNS partitioning provides an incomplete picture of the CNS exposure available for eliciting an effect at the site of action. According to free drug hypothesis, only the free or unbound drug is available to cross membranes and interact with the target to provide an effect (Schanker, 1962). Hence, CNS delivery of molecules should be estimated based on unbound concentrations. AZD1390 is highly bound to plasma, brain, and spinal cord and has a Kpuu of 0.12 in brain and spinal cord. This Kpuu estimation from our studies is higher than the Kpuu,brain of 0.04 estimated by Durant et al., (2018b) from their investigations. A possibility for this discrepancy might be attributed to the use of two different methods to determine the binding of AZD1390 in tissues. Although we used the RED technique to quantify fu for brain and spinal cord in mice, Durant et al., (2018b) used fu determined by the brain slice method in rats to apply to concentration data from mice. Previous reports have indicated that fu determination from brain slice method versus RED method have varying levels of differences for the same compound, particularly for basic drugs like AZD1390 (Fridén et al., 2011). These data highlight the importance of drug binding determinations for the calculation of Kpuu. This is especially true if Kpuu is used as a key parameter in the choice of a brain-penetrant drug. However, low Kpuu values from both studies point to the same conclusion, which is that CNS delivery of AZD1390 is restricted in mice. Our studies further indicate that this limited delivery is by active efflux mediated by P-gp.
The impact of inhibiting P-gp–mediated efflux by coadministration of the dual P-gp and Bcrp inhibitor elacridar was examined. Coadministration of elacridar with AZD1390 significantly increased the brain and spinal cord delivery of AZD1390 in wild-type mice. However, the effect of inhibition of efflux by elacridar is lower than the complete knockdown of these efflux transporters as seen in TKO mice. This can be explained by the incomplete inhibition of P-gp and Bcrp at the administered dose of elacridar (Talele et al., 2022). The extent of inhibition will depend on the free concentration of elacridar in the brain and the affinity of the transporter systems for elacridar.
We also evaluated the distribution of AZD1390 within different anatomic regions of the CNS. Regional distribution of AZD1390 was studied in wild-type, PKO, BKO, and TKO mice to evaluate any regional differences in transporter function at the BBB within the CNS. This is particularly important to evaluate in the context of patients receiving whole brain radiation and AZD1390. Evaluating if AZD1390 is disproportionately distributed within different anatomic regions of the brain can provide critical insights into possible toxic side effects of drug/RT combinations. However, no regional differences within the CNS were observed in wild-type, PKO, BKO, and TKO mice. This indicates that efflux activity by P-gp and Bcrp is not functionally different across different anatomic regions, reducing possibilities of enhanced localized toxicities within the CNS.
Finally, examining focal AZD1390 exposure in and around the tumor is critical for determining effective concentrations and limiting untoward effects. As discussed earlier, in case of GBM, effective agents must be successfully delivered even to the tumor-bearing rim and normal brain regions that can lead to tumor recurrence (Fig. 2). Our data indicate that even though AZD1390 accumulation is higher in the tumor core as opposed to normal brain and rim, total concentrations in all of these brain regions are above the 30 nM effective in vitro radiosensitizing concentration (Chen et al., 2020). At the studied dose of 20 mg/kg, AZD1390 in conjunction with RT showed efficacy in intracranial GBM tumor models (Durant et al., 2018b). Therefore, although AZD1390 is a substrate of P-gp–mediated efflux in mice, effective total concentrations are achieved in the normal brain for a radiosensitizing effect. Although effective delivery of AZD1390 across an intact BBB may effectively target isolated nests of tumor cells, careful investigation of normal brain tissue toxicity in combination with RT is warranted in preclinical efficacy studies (Dragojevic et al., 2021).
A positron emission tomography (PET) microdosing study of AZD1390 in humans (Jucaite et al., 2021) indicated that the Kpuu,brain was 0.24, which is higher than the Kpuu,brain in mice from our studies. This discrepancy points to possible interspecies differences in the CNS distribution of AZD1390. A previous report from Syvänen et al. (2009) has also reported species differences in the brain delivery of three P-gp substrates, with higher Kpbrain in humans compared with rodents. The expression of P-gp at the BBB is approximately 3-fold higher in mice compared with humans (Uchida et al., 2011; Chu et al., 2013). However, this quantification is of total P-gp protein expression and not its functional form available for efflux within cell membranes. There is still a gap in knowledge about interspecies differences in the functionally active form of P-gp among different species. Multiple other reports also indicate differences in substrate affinities across various species for P-gp. For example, in vitro studies using cells transfected with human and mouse P-gp have shown interspecies differences in affinities of various compounds (Yamazaki et al., 2001; Katoh et al., 2006; Takeuchi et al., 2006; Baltes et al., 2007). However, there have also been contrasting reports in which a correlation was reported between P-gp–transfected human and mouse permeability studies using Madin-Darby canine kidney (MDCK) assays for various CNS marketed compounds (Feng et al., 2008). More recently, there has also been a report of similarity in the ligand binding sites of human and mouse P-gp (Jain et al., 2018). Therefore, improved understanding about interspecies differences among mouse models used for clinical translation of molecules for CNS delivery is important. Tools like humanized P-gp mouse models can be particularly useful in bridging this gap (Yamasaki et al., 2018). Additionally, preclinical studies in large-animal models that are more representative of human anatomy and physiology are of greater relevance (Shen et al., 2021). Canine, porcine, and nonhuman primate models have shown promise in GBM and will be particularly useful transitional models to bridge the translational gap from mice to humans (Hicks et al., 2021).
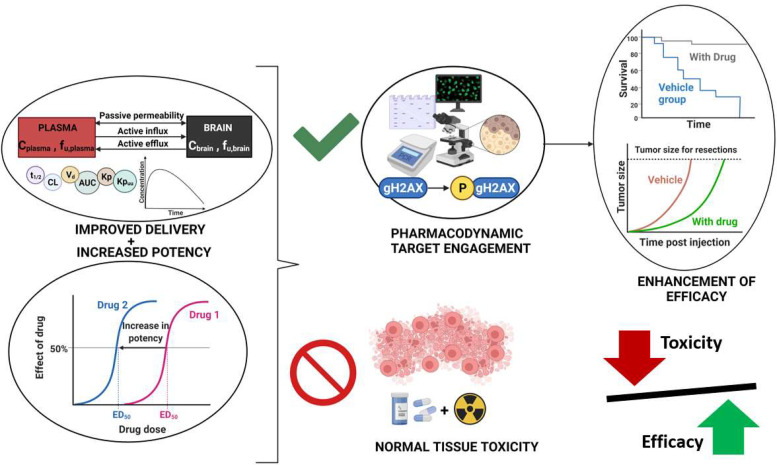
In conclusion, our studies elucidated mechanisms limiting CNS distribution of AZD1390 in mice and distribution of AZD1390 in a GBM PDX model. Even though the Kpuu in mice was 0.12 due to active efflux by P-gp and high binding in brain, AZD1390 levels in the normal brain were above the minimum effective radiosensitizing concentrations. This brings forward an important question of determining a cutoff for Kpuu values to be deemed high enough to declare agents to be “brain penetrant.” Although there is no clear consensus on a target Kpuu value, it is important to appreciate that unbound brain exposure is just one aspect governing the efficacy of a drug in the CNS. In addition to brain penetrability, it is also important to recognize how potency, target engagement, and distribution to potential sites of toxicity may impact the eventual use of a compound for a CNS disorder (Fig. 10). For AZD1390, at a Kpuu of 0.12, high enough drug levels were achieved for the 20-mg/kg dose in mice that were adequate for effective pharmacodynamic target engagement, and thereby improved efficacy was observed in intracranial models of GBM (Durant et al., 2018b). AZD1390 has also demonstrated radiosensitizing activity in brain metastatic PDX models of breast cancer (Tew et al., 2021). Therefore, developing potent and brain-penetrant ATM inhibitors may significantly improve the treatment of patients with brain tumors. Although these ATM inhibitors might be particularly effective in enhancing tumor control, potentially heightened risks of radiation injury to normal brain tissues need to be carefully studied for their safe clinical utilization (Fig. 10).
Fig. 10.
Key factors to be considered in the development of ATM inhibitors for brain tumors.
Acknowledgments
The authors would like to thank James Fisher (Clinical Pharmacology Analytical Services, University of Minnesota) for help with the development of AZD1390 LC-MS/MS assay.
Abbreviations
- ATM
ataxia-telangiectasia mutated kinase
- AUC
area under the curve
- BBB
blood-brain barrier
- Bcrp
breast cancer resistance protein
- BKO
Bcrp knockout
- CL
clearance
- CNS
central nervous system
- DAfree
free distribution advantage
- DDR
DNA damage response
- F
oral bioavailability
- fu
unbound fraction
- FVB
Friend leukemia virus strain B
- GBM
glioblastoma
- Kp
tissue partition coefficient
- Kpuu
unbound/free tissue partition coefficient
- LC-MS/MS
liquid chromatography–tandem mass spectrometry
- NCA
noncompartmental analysis
- PDX
patient-derived xenograft
- P-gp
P-glycoprotein
- PKO
P-gp knockout
- RED
rapid equilibrium dialysis
- RT
radiation therapy
- t 1/2
half-life
- TKO
P-gp and Bcrp knockout/triple knockout
- Vd
volume of distribution
- Vss
volume of distribution at steady state
Authorship Contributions
Participated in research design: Talele, Sarkaria, Elmquist.
Conducted experiments: Talele, Zhang, Chen.
Performed data analysis: Talele, Gupta, Burgenske, Elmquist.
Wrote or contributed to the writing of the manuscript: Talele, Sarkaria, Elmquist.
Footnotes
This work was supported by National Institutes of Health National Cancer Institute [Grant U19-CA264362], [Grant U54-CA210180], [Grant U01-CA227954], and [Grant P50-CA108961] and National Institute of Neurological Disorders and Stroke [Grant R24-NS092940]. S.T. was supported by the Rory P. Remmel and Cheryl L. Zimmerman Fellowship in Drug Metabolism and Pharmacokinetics, Edward G. Rippie Fellowship, Bighley Graduate Fellowship, Ronald J. Sawchuk Fellowship in Pharmacokinetics, and Doctoral Dissertation Fellowship.
No author has an actual or perceived conflict of interest with the contents of this article.
References
- Abbott NJ, Patabendige AAK, Dolman DEM, Yusof SR, Begley DJ (2010) Structure and function of the blood-brain barrier. Neurobiol Dis 37:13–25. [DOI] [PubMed] [Google Scholar]
- Agarwal S, Hartz AMS, Elmquist WF, Bauer B (2011a) Breast cancer resistance protein and P-glycoprotein in brain cancer: two gatekeepers team up. Curr Pharm Des 17:2793–2802. [DOI] [PMC free article] [PubMed] [Google Scholar]
- Agarwal S, Sane R, Gallardo JL, Ohlfest JR, Elmquist WF (2010) Distribution of gefitinib to the brain is limited by P-glycoprotein (ABCB1) and breast cancer resistance protein (ABCG2)-mediated active efflux. J Pharmacol Exp Ther 334:147–155. [DOI] [PMC free article] [PubMed] [Google Scholar]
- Agarwal S, Sane R, Oberoi R, Ohlfest JR, Elmquist WF (2011b) Delivery of molecularly targeted therapy to malignant glioma, a disease of the whole brain. Expert Rev Mol Med 13:e17. [DOI] [PMC free article] [PubMed] [Google Scholar]
- Bailer AJ (1988) Testing for the equality of area under the curves when using destructive measurement techniques. J Pharmacokinet Biopharm 16:303–309. [DOI] [PubMed] [Google Scholar]
- Baltes S, Gastens AM, Fedrowitz M, Potschka H, Kaever V, Löscher W (2007) Differences in the transport of the antiepileptic drugs phenytoin, levetiracetam and carbamazepine by human and mouse P-glycoprotein. Neuropharmacology 52:333–346. [DOI] [PubMed] [Google Scholar]
- Biddlestone-Thorpe LSajjad MRosenberg EBeckta JMValerie NCKTokarz MAdams BRWagner AFKhalil AGilfor D, et al. (2013) ATM kinase inhibition preferentially sensitizes p53-mutant glioma to ionizing radiation. Clin Cancer Res 19:3189–3200. [DOI] [PMC free article] [PubMed] [Google Scholar]
- Carruthers R, Ahmed SU, Strathdee K, Gomez-Roman N, Amoah-Buahin E, Watts C, Chalmers AJ (2015) Abrogation of radioresistance in glioblastoma stem-like cells by inhibition of ATM kinase. Mol Oncol 9:192–203. [DOI] [PMC free article] [PubMed] [Google Scholar]
- Chen JGupta SKKitange GJMladek ACCarlson BLHe LHu ZBakken KKBurgenske DMConnors MA, et al. (2020) Abstract 6506: targeting ATM with AZD1390 for radio-sensitization of glioblastoma patient derived xenografts. Cancer Res 80 (Suppl 16):6506 DOI: 10.1158/1538-7445.AM2020-6506. [Google Scholar]
- Chu X, Bleasby K, Evers R (2013) Species differences in drug transporters and implications for translating preclinical findings to humans. Expert Opin Drug Metab Toxicol 9:237–252 10.1517/17425255.2013.741589. [DOI] [PubMed] [Google Scholar]
- Dragojevic SJi JSingh PKConnors MAMutter RWLester SCTalele SMZhang WCarlson BLRemmes NB, et al. (2021) Preclinical risk evaluation of normal tissue injury with novel radiosensitizers. Int J Radiat Oncol Biol Phys 111:e54–e62. [DOI] [PMC free article] [PubMed] [Google Scholar]
- Durant STPike KGColclough NRiches LGarcia-Trinidad AHunt TLing SStott JBarrett IZheng L, et al. (2018a) Abstract A104: AZD1390, a potent and selective orally bioavailable blood-brain barrier-penetrant ATM inhibitor, radiosensitizes and improves survival of orthotopic glioma and metastatic brain tumor models (Abstract). Mol Cancer Ther 17 (Suppl 1):A104 DOI: 10.1158/1535-7163.TARG-17-A104. [Google Scholar]
- Durant STZheng LWang YChen KZhang LZhang TYang ZRiches LTrinidad AGFok JHL, et al. (2018b) The brain-penetrant clinical ATM inhibitor AZD1390 radiosensitizes and improves survival of preclinical brain tumor models. Sci Adv 4:eaat1719. [DOI] [PMC free article] [PubMed] [Google Scholar]
- Feng B, Mills JB, Davidson RE, Mireles RJ, Janiszewski JS, Troutman MD, de Morais SM (2008) In vitro P-glycoprotein assays to predict the in vivo interactions of P-glycoprotein with drugs in the central nervous system. Drug Metab Dispos 36:268–275. [DOI] [PubMed] [Google Scholar]
- Fridén M, Bergström F, Wan H, Rehngren M, Ahlin G, Hammarlund-Udenaes M, Bredberg U (2011) Measurement of unbound drug exposure in brain: modeling of pH partitioning explains diverging results between the brain slice and brain homogenate methods. Drug Metab Dispos 39:353–362. [DOI] [PubMed] [Google Scholar]
- Gampa GKenchappa RSMohammad ASParrish KEKim MCrish JFLuu AWest RHinojosa AQSarkaria JN, et al. (2020) Enhancing brain retention of a KIF11 inhibitor significantly improves its efficacy in a mouse model of glioblastoma. Sci Rep 10:6524. [DOI] [PMC free article] [PubMed] [Google Scholar]
- Gatti RA (2009) The inherited basis of human radiosensitivity. Acta Oncol 40:702–711. [DOI] [PubMed] [Google Scholar]
- Golding SE, Rosenberg E, Adams BR, Wignarajah S, Beckta JM, O’Connor MJ, Valerie K (2012) Dynamic inhibition of ATM kinase provides a strategy for glioblastoma multiforme radiosensitization and growth control. Cell Cycle 11:1167–1173. [DOI] [PMC free article] [PubMed] [Google Scholar]
- Hicks WHBird CEPernik MNHaider ASDobariya AAbdullah KGAoun SGBentley RTCohen-Gadol AABachoo RM, et al. (2021) Large animal models of glioma: current status and future prospects. Anticancer Res 41: 5343–5353. [DOI] [PubMed] [Google Scholar]
- Jain S, Grandits M, Ecker GF (2018) Interspecies comparison of putative ligand binding sites of human, rat and mouse P-glycoprotein. Eur J Pharm Sci 122:134–143. [DOI] [PMC free article] [PubMed] [Google Scholar]
- Jucaite AStenkrona PCselényi ZDe Vita SBuil-Bruna NVarnäs KSavage AVarrone AJohnström PSchou M, et al. (2021) Brain exposure of the ATM inhibitor AZD1390 in humans-a positron emission tomography study. Neuro-oncol 23:687–696. [DOI] [PMC free article] [PubMed] [Google Scholar]
- Karlin JAllen JAhmad SFHughes GSheridan VOdedra RFarrington PCadogan EBRiches LCGarcia-Trinidad A, et al. (2018) Orally bioavailable and blood-brain barrier-penetrating ATM inhibitor (AZ32) radiosensitizes intracranial gliomas in mice. Mol Cancer Ther 17:1637–1647. [DOI] [PMC free article] [PubMed] [Google Scholar]
- Kastan MB, Lim DS (2000) The many substrates and functions of ATM. Nat Rev Mol Cell Biol 1:179–186. [DOI] [PubMed] [Google Scholar]
- Katoh M, Suzuyama N, Takeuchi T, Yoshitomi S, Asahi S, Yokoi T (2006) Kinetic analyses for species differences in P-glycoprotein-mediated drug transport. J Pharm Sci 95:2673–2683. [DOI] [PubMed] [Google Scholar]
- Kodaira H, Kusuhara H, Ushiki J, Fuse E, Sugiyama Y (2010) Kinetic analysis of the cooperation of P-glycoprotein (P-gp/Abcb1) and breast cancer resistance protein (Bcrp/Abcg2) in limiting the brain and testis penetration of erlotinib, flavopiridol, and mitoxantrone. J Pharmacol Exp Ther 333:788–796. [DOI] [PubMed] [Google Scholar]
- Lee J-H, Paull TT (2021) Cellular functions of the protein kinase ATM and their relevance to human disease. Nat Rev Mol Cell Biol 22:796–814. [DOI] [PubMed] [Google Scholar]
- Lin JH, Yamazaki M (2003) Role of P-glycoprotein in pharmacokinetics: clinical implications. Clin Pharmacokinet 42:59–98. [DOI] [PubMed] [Google Scholar]
- Löscher W, Potschka H (2005) Blood-brain barrier active efflux transporters: ATP-binding cassette gene family. NeuroRx 2:86–98. [DOI] [PMC free article] [PubMed] [Google Scholar]
- Moravan MJFecci PEAnders CKClarke JMSalama AKSAdamson JDFloyd SRTorok JASalama JKSampson JH, et al. (2020) Current multidisciplinary management of brain metastases. Cancer 126:1390–1406. [DOI] [PubMed] [Google Scholar]
- Oostendorp RL, Buckle T, Beijnen JH, van Tellingen O, Schellens JHM (2009) The effect of P-gp (Mdr1a/1b), BCRP (Bcrp1) and P-gp/BCRP inhibitors on the in vivo absorption, distribution, metabolism and excretion of imatinib. Invest New Drugs 27:31–40. [DOI] [PubMed] [Google Scholar]
- Parrish KE, Sarkaria JN, Elmquist WF (2015) Improving drug delivery to primary and metastatic brain tumors: strategies to overcome the blood-brain barrier. Clin Pharmacol Ther 97:336–346. [DOI] [PubMed] [Google Scholar]
- Pollard JM, Gatti RA (2009) Clinical radiation sensitivity with DNA repair disorders: an overview. Int J Radiat Oncol Biol Phys 74:1323–1331. [DOI] [PMC free article] [PubMed] [Google Scholar]
- Pritchard J, Sandland MR, Breatnach FB, Pincott JR, Cox R, Husband P (1982) The effects of radiation therapy for Hodgkin’s disease in a child with ataxia telangiectasia: a clinical, biological and pathologic study. Cancer 50:877–886. [DOI] [PubMed] [Google Scholar]
- Sane R, Agarwal S, Elmquist WF (2012) Brain distribution and bioavailability of elacridar after different routes of administration in the mouse. Drug Metab Dispos 40:1612–1619. [DOI] [PMC free article] [PubMed] [Google Scholar]
- Sarkaria JNHu LSParney IFPafundi DHBrinkmann DHLaack NNGiannini CBurns TCKizilbash SHLaramy JK, et al. (2018) Is the blood-brain barrier really disrupted in all glioblastomas? A critical assessment of existing clinical data. Neuro-oncol 20:184–191. [DOI] [PMC free article] [PubMed] [Google Scholar]
- Schanker LS (1962) Passage of drugs across body membranes. Pharmacol Rev 14:501–530. [PubMed] [Google Scholar]
- Shen H, Yang Z, Rodrigues AD (2021) Cynomolgus monkey as an emerging animal model to study drug transporters: in vitro, in vivo, in vitro-to-in vivo translation. Drug Metab Dispos 50:299–319. [DOI] [PubMed] [Google Scholar]
- Syvänen S, Lindhe O, Palner M, Kornum BR, Rahman O, Långström B, Knudsen GM, Hammarlund-Udenaes M (2009) Species differences in blood-brain barrier transport of three positron emission tomography radioligands with emphasis on P-glycoprotein transport. Drug Metab Dispos 37:635–643. [DOI] [PubMed] [Google Scholar]
- Takeuchi T, Yoshitomi S, Higuchi T, Ikemoto K, Niwa S, Ebihara T, Katoh M, Yokoi T, Asahi S (2006) Establishment and characterization of the transformants stably-expressing MDR1 derived from various animal species in LLC-PK1. Pharm Res 23:1460–1472. [DOI] [PubMed] [Google Scholar]
- Talele S, Zhang W, Burgenske DM, Kim M, Mohammad AS, Dragojevic S, Gupta SK, Bindra RS, Sarkaria JN, Elmquist WF (2021) Brain distribution of berzosertib: an ATR inhibitor for the treatment of glioblastoma. J Pharmacol Exp Ther 379:343–357. [DOI] [PMC free article] [PubMed] [Google Scholar]
- Talele S, Zhang W, Oh J-H, Burgenske DM, Mladek AC, Dragojevic S, Sarkaria JN, Elmquist WF (2022) CNS delivery of the DNA-PKcs inhibitor peposertib as radiosensitizer for brain metastases. J Pharmacol Exp Ther 381:217–228. [DOI] [PMC free article] [PubMed] [Google Scholar]
- Tamminga RYJ, Dolsma WV, Leeuw JA, Kampinga HH (2002) Chemo- and radiosensitivity testing in a patient with ataxia telangiectasia and Hodgkin disease. Pediatr Hematol Oncol 19:163–171. [DOI] [PubMed] [Google Scholar]
- Tan AC, Ashley DM, López GY, Malinzak M, Friedman HS, Khasraw M (2020) Management of glioblastoma: state of the art and future directions. CA Cancer J Clin 70:299–312. [DOI] [PubMed] [Google Scholar]
- Tew BY, Durant S, Salhia B (2021) Abstract 1388: ATM inhibitor AZD1390 sensitizes breast cancer brain metastasis to radiation therapy (Abstract). Cancer Res 81 (Suppl 13):1388 DOI: 10.1158/1538-7445.AM2021-1388.33184108 [Google Scholar]
- Uchida Y, Ohtsuki S, Katsukura Y, Ikeda C, Suzuki T, Kamiie J, Terasaki T (2011) Quantitative targeted absolute proteomics of human blood-brain barrier transporters and receptors. J Neurochem 117:333–345. [DOI] [PubMed] [Google Scholar]
- Weber AM, Ryan AJ (2015) ATM and ATR as therapeutic targets in cancer. Pharmacol Ther 149:124–138. [DOI] [PubMed] [Google Scholar]
- Yamasaki YKobayashi KOkuya FKajitani NKazuki KAbe STakehara SIto SOgata SUemura T, et al. (2018) Characterization of P-glycoprotein humanized mice generated by chromosome engineering technology: its utility for prediction of drug distribution to the brain in humans. Drug Metab Dispos 46:1756–1766. [DOI] [PubMed] [Google Scholar]
- Yamazaki M, Neway WE, Ohe T, Chen I, Rowe JF, Hochman JH, Chiba M, Lin JH (2001) In vitro substrate identification studies for P-glycoprotein-mediated transport: species difference and predictability of in vivo results. J Pharmacol Exp Ther 296:723–735. [PubMed] [Google Scholar]
- Yuan J (1993) Estimation of variance for AUC in animal studies. J Pharm Sci 82:761–763. [DOI] [PubMed] [Google Scholar]


