

Abstract
Precis:
The 24-2 GPA can miss clear progression of early glaucoma seen on OCT reports.
Purpose:
To better understand the efficacy of the 24-2 guided progression analysis (GPA) for detecting progression in eyes with early glaucoma (i.e., 24-2 MD better than −6dB), by comparing the 24-2 GPA method to a reference standard based upon a combination of OCT and 24-2 and 10-2 visual field (VF) information.
Design:
Cross-sectional study.
Participants:
99 eyes from 99 individuals, including 70 suspect or early glaucomatous eyes (24-2 mean deviation better than −6 dB) and 29 healthy controls (HC).
Methods:
All eyes had at least 4 OCT and VF test dates over a period that ranged from 12 to 59 months. The 24-2 VF tests included two baseline tests and at least two follow-up tests. The two baseline tests were within an average of 5.6 days (median of 7 days), and the last follow-up test occurred at least 1 year after the first baseline visit.
Main Outcome Measures:
The commercial 24-2 GPA software, with default settings, characterized eyes as “Likely Progression” (LP) and “Possible Progression” (PP); both were considered “progressing” for this analysis. For a reference standard (RS), 3 authors graded progression using strict criteria and a combination of a custom OCT progression report, and the commercial 24-2 and 10-2 GPA reports for the same test dates as the GPA.
Results:
The RS identified 10 (14%) of the 70 patient eyes, and none of the HC eyes, as progressing. The 24-2 GPA identified 13 of the 70 patient eyes as progressing (PP or LP). However, it correctly classified only 4 (40%) of the 10 RS progressors. All 6 of the RS progressors missed by the 24-2 GPA showed progression in the macula. In addition, the 24-2 GPA identified 2 of the 29 HC eyes as progressors, as well as 9 patient eyes without progression based upon the RS.
Conclusion:
In eyes with early glaucoma (i.e., 24-2 MD >−6dB) in this study, the 24-2 GPA missed progression seen with OCT and exhibited a relatively high rate of false positives. Furthermore, the region progressing typically included the macula. The results suggest that including OCT and/or 10-2 visual fields should improve detection of progression.
Keywords: glaucoma, OCT, perimetry, progression
Precis
In patients with early glaucoma, the 24-2 glaucoma progression analysis (GPA) missed progression detected with optical coherence tomography (OCT). Further, the region progressing in these eyes included the macula.
Many clinicians depend upon visual fields (VFs) to help determine whether glaucoma is progressing. For over 35 years, standard automated perimetry (SAP) has been used to obtain these VFs.1 Because of the clinical importance of SAP, considerable research has focused on improving its ability to detect the progression of glaucoma. Many of these studies have involved developing methods to evaluate the test-retest variability inherent in SAP and to provide the clinician with a method for determining whether a glaucoma patient is progressing beyond these limits of variability.2–5
The most clinically available of these SAP quantitative methods is the Guided Progression Analysis for the 24-2 VF test (GPA, Carl Zeiss, Meditec, Inc.), which applies an event-based analysis to detect change over time based on criteria established in the Early Manifest Glaucoma Trial.4,6 The first two reliable VFs are averaged to create a “baseline” field against which proceeding VFs are compared, point-by-point, for deterioration beyond the known limits of short-term variability. The GPA method is backed by research indicating that multiple VF tests are required to reliably, and statistically, establish progression.4,6 In particular, the GPA method, and the commercially available GPA report, requires a minimum of 4 tests to detect “possible progression” and 5 tests to detect “likely progression”.7 These requirements pose a problem for clinicians, as well as patients, who want to know if glaucomatous damage has progressed since the last visit.
In any case, previous studies, which have evaluated the performance of the 24-2 GPA, have two main weaknesses. First, they have not utilized optimal optical coherence tomography (OCT) (e.g., including GCL deviation maps) and/or VF (e.g., including 10-2 pattern) information about macular damage. This is of particular concern as we8–10 and others11,12 have found that early glaucoma often involves the macular region, and that the 24-2 VF will often miss macular damage.13–15 Second, previous studies have largely used patient groups, without healthy controls (HC), to estimate the sensitivity and specificity of the GPA.16–19
To better understand the efficacy of the 24-2 GPA for detecting progression in eyes with early glaucoma defined as a 24-2 MD better than −6dB, we compared the 24-2 GPA method to a reference standard based upon a combination of OCT as well as VF information, which includes the macula.
METHODS
Patients
Eligible eyes were selected from a larger sample of eyes that were part of an observational, prospective case-control study, the Macular Damage in Early Glaucoma and Progression Study (MAPS) [PI: C Gustavo De Moraes; ClinicalTrials.gov Identifier: NCT02547740], which follows individuals over a period of 5 years with both VFs and OCT scans. The vast majority (>95%) of eyes had OCT and 24-2 and 10-2 VF tests on the same day, while the rest had one of the VF tests on another day within a week. According to the MAPS protocol, every participant had 4 study visits scheduled within the first 4 months to acquire repeated baseline measures of OCT scans and 24-2 and 10-2 VF tests. After this baseline period, follow-up visits were scheduled every 4 to 6 months for a duration of 5 years. For the purposes of this study, we selected all eyes in the MAPS database that had at least 4 OCT scans and VF tests, with the last visit occurring at least 1 year after the first baseline visit.20 Ninety-nine eyes from 99 individuals met that inclusion criteria. These 99 eyes/individuals included 29 healthy controls (HC) and 70 glaucoma patients or suspects.
The 29 HC had a normal fundus examination and IOP within normal limits. The 70 patient eyes had early open angle glaucoma, or were glaucoma suspects, based upon the referring glaucoma specialist’s diagnosis. All eyes had best-corrected visual acuity better than 20/40 and open angles. In addition, the 24-2 mean deviation (MD) was better than −6 dB (mean −1.28 dB, range −5.93 to +1.97 dB) at the screening visits. Of the 70 glaucoma patients/suspects, 32 had neither an abnormal 24-2 GHT nor 24-2 PSD, while 31 did not have an abnormal 10-2 PSD.
Study procedures followed the tenets of the Declaration of Helsinki and Health Insurance Portability and Accountability Act and were approved by the Institutional Review Board of Columbia University. Written informed consent was obtained from all participants.
Visual Field Data and the 24-2 GPA
All 99 eyes had a minimum of four 24-2 VF tests, which included two baseline tests and at least two follow-up tests. The two baseline tests were within an average of 5.6 days (median of 7 days), and the last follow-up test occurred at least 1 year after the first baseline visit. The mean number of tests per patient was 9.2 (median of 8), and the mean duration between the first baseline and last test was 31.2 months (range 12 to 59 months).
GPA and progression:
The 24-2 GPA report (Carl Zeiss Meditec, Inc., Dublin, CA, USA) categorizes eyes as Likely Progression (LP), Possible Progression (PP) or neither LP nor PP. In brief, the presence of at least 3 24-2 VF points that are significantly different from baseline for two consecutive visits triggers a PP classification, while if the same criteria were met for three consecutive visits, then the report would indicate LP. The absence of these two labels (i.e., Possible or Likely Progression) was taken as an indication of a lack of significant progression.
Figure 1A shows the 24-2 GPA report for one of the eyes, which is categorized as “Likely Progression” (LP). The Glaucoma Change Probability (GCP) Map, which is enlarged in panel B, summarizes the local changes. A triangle indicates that the sensitivity at that location was significantly less than baseline on one (open triangle), two (half-filled) or three (filled) consecutive follow-up tests. Because there were 3 filled triangles, this eye was categorized as “Likely Progression”.
Figure 1.

A. The 24-2 Guided Progression Analysis (GPA) for an eye showing “Likely Progression” (LP). The yellow arrow indicates the first baseline test, and the blue arrow indicates the most recent follow-up (last) test. The Glaucoma Change Probability (GCP) map is outlined in red. B. Enlarged image of the GCP map.
For the primary analysis, the GPA reports were generated with the default settings, as these are typically used in a clinical setting. These settings automatically excluded VFs with false positives >15%. Based upon recent recommendations,7 we also generated a “Modified” GPA reports by excluding VFs with false negatives (FN) greater than 15%. Additionally, we excluded fields with fixation losses greater than 33%. (This is not a recommendation from the manufacturer, as the HFA recommends exclusion for 20% FL. We felt this was too stringent, and instead chose a 33% cut-off based on previous work.)21–23 The progression detection of both the standard and modified GPA reports were compared to a reference standard based on a combination of OCT and VF information as detailed below.
OCT Data and Progression Report
All eyes were scanned with the Spectralis HRA+OCT with the Glaucoma Module Premium Edition (GMPE) protocol (Heidelberg Engineering Inc, Heidelberg, Germany), which acquires radial, circle (over the disc), and cube scans using eye-tracking to help place the scan in the same location at follow-up sessions. All cube scans were obtained along an axis from the foveal center-to-Bruch’s membrane opening center. While no eyes were excluded due to poor OCT quality, for two eyes the second of two baseline OCT scans were included as the first baseline had a significant “clipping” artifact.
OCT P-Report:
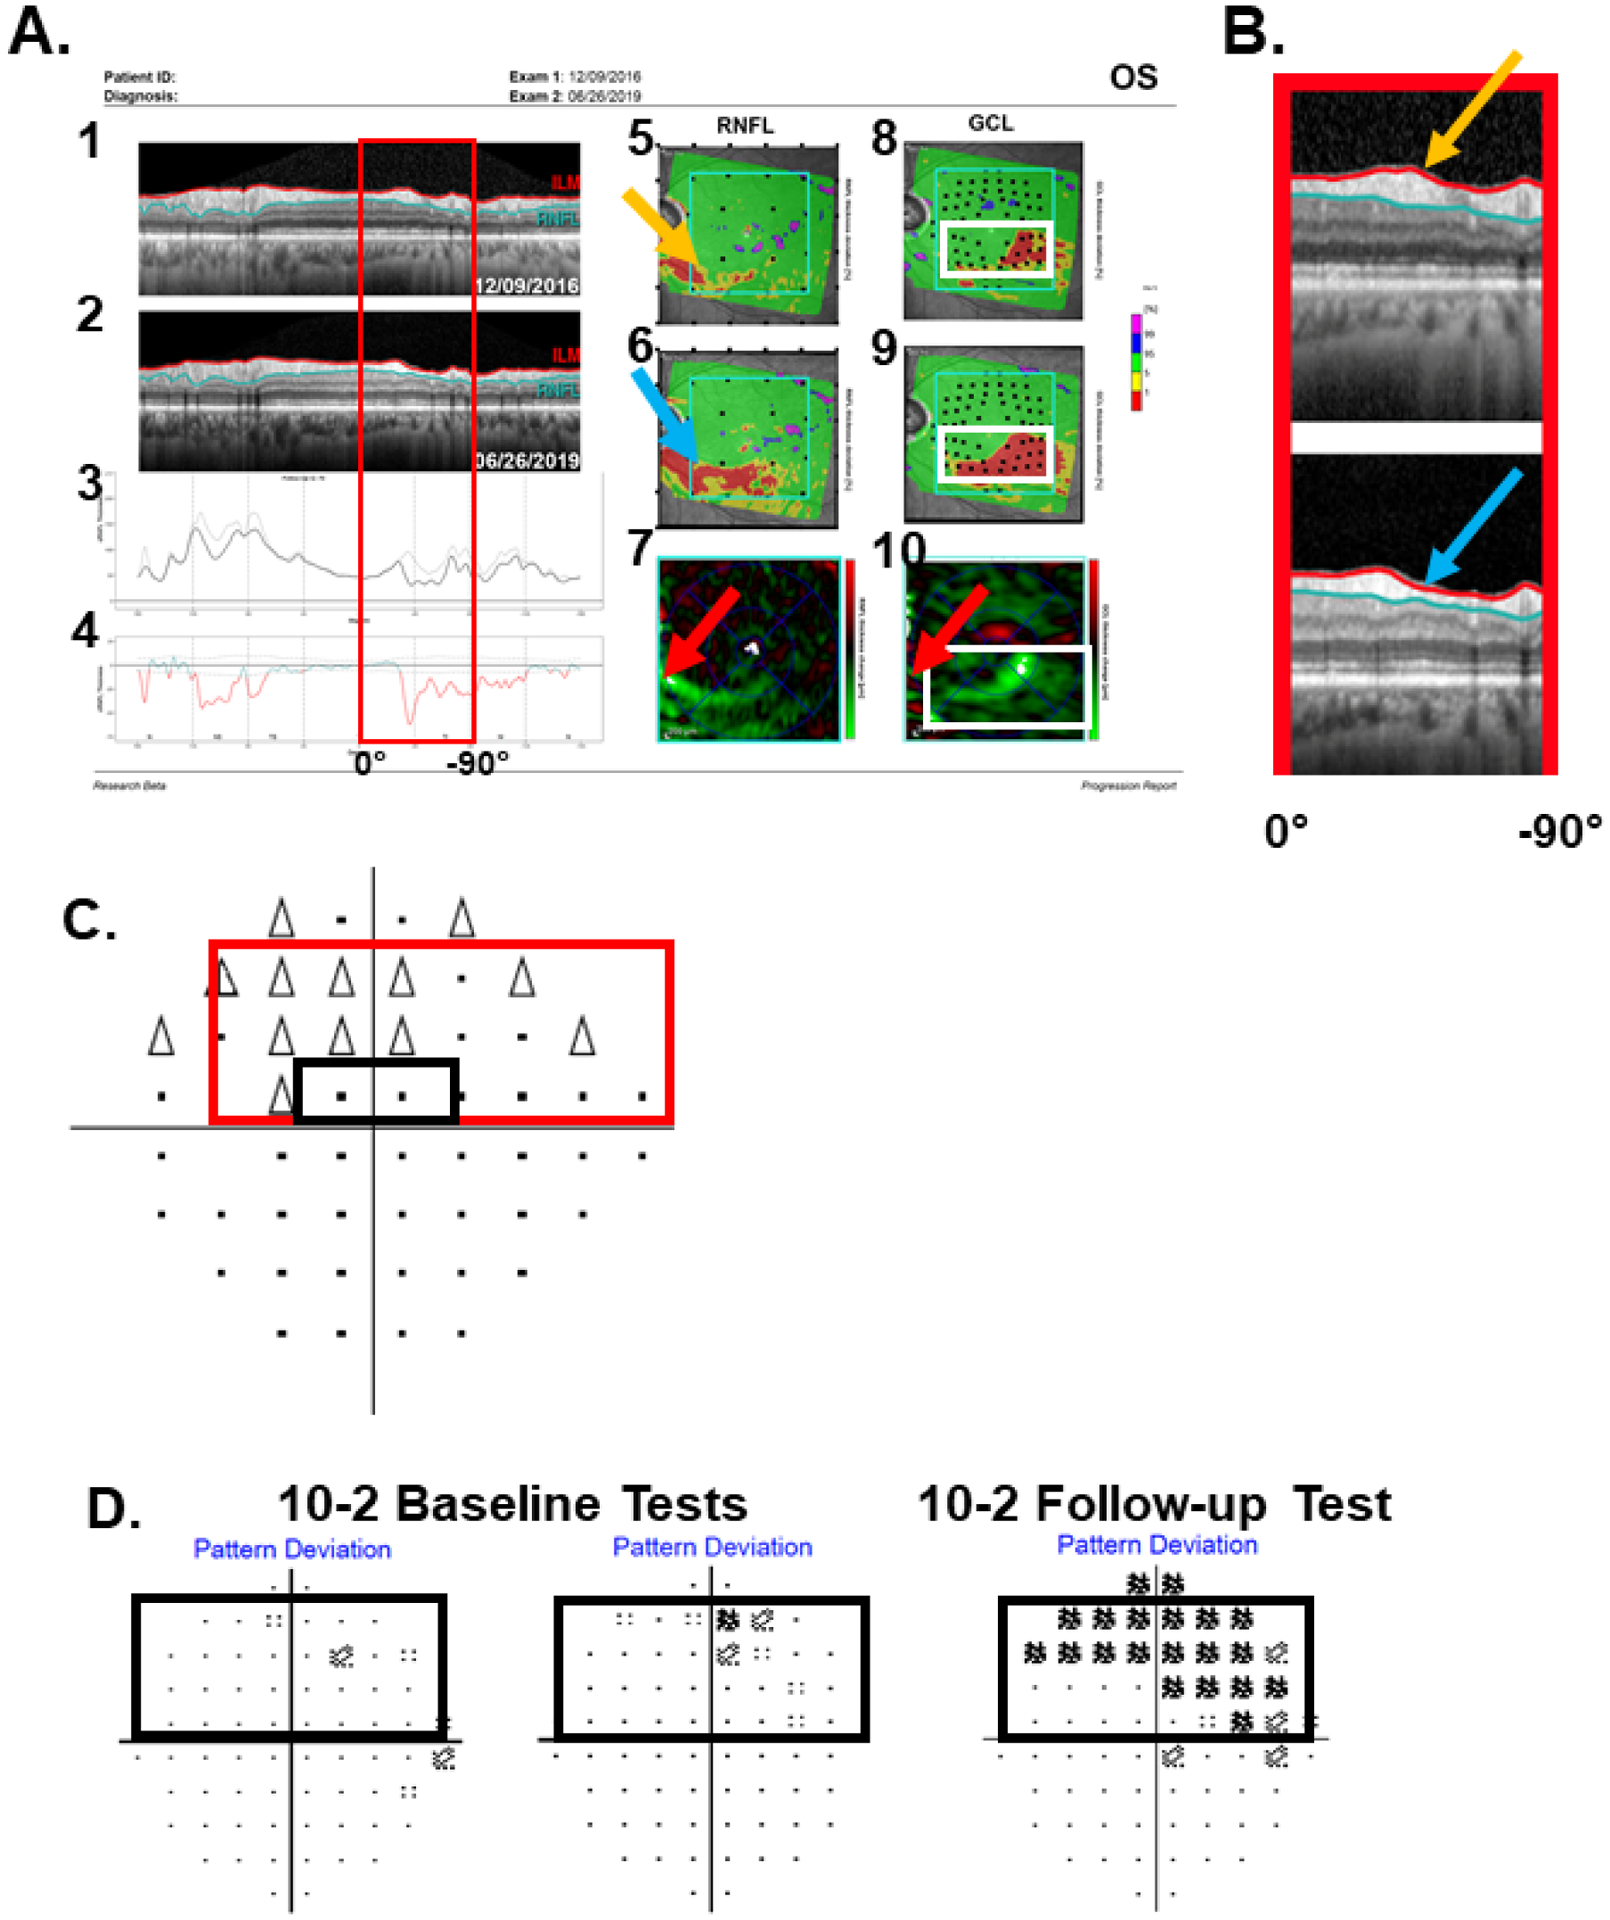
For use in the reference standard (RS) described next, we developed a single-page report shown in Fig. 2A based upon our prior work (La Bruna et al. IOVS 2021: ARVO E-abstract 3519171; Grossman et al. IOVS 2021: ARVO E-abstract 3544221). The report in Fig. 2A compares the results from two OCT tests, one on the first baseline day of the 24-2 GPA (orange arrow in Fig. 1A) and the second on the last follow-up test day on the 24-2 GPA (blue arrow in Fig. 1A). The first column In Fig. 2A contains the circumpapillary circular b-scan images for the first baseline (1) and last follow-up (2) tests; the cpRNFL thickness plots (3) for the baseline (gray) and last test (black); and the RNFL difference curve (4) obtained by subtracting the values for the first baseline from the values for the last test. The red regions of the curve in Fig. 2A4 indicate that the loss of cpRNFL thickness was significantly larger than the 5% cutoff (dashed curves) based upon test-retest variability.[Note: all 4 panels in the first column of Fig. 2A are shown in NSTIN (nasal-superior-temporal-inferior-nasal) orientation where the center corresponds to the temporal (T) portion of the disc.24]
Figure 2.

A. The OCT progression (P-) Report for the same eye as in Fig. 1. It includes: 1. circumpapillary (cp) circular b-scan image for the first baseline test; 2. same for the last test; 3. the cpRNFL thickness plots for the first (gray) and last (black) tests; 4. the difference between the curves in 3; 5. the retinal nerve fiber layer (RNFL) probability map for the baseline test; 6. the RNFL probability maps for the last test; 7. the change map created by subtracting the last RNFL thickness from the baseline thickness; white and green indicates greater loss and red indicates “gain”; and 8, 9 & 10. same as 5, 6 & 7, but for the ganglion cell layer (GCL). B. The region of the disc associated with the region within the red rectangle in panels A1-A4 is shown as the red arc. C. An enlarged image of the region within the red rectangle in panels A1 and A2. The blue rectangles on the probability maps in A5, A6, A8, and A9 represent the size and location of the areas of the change maps in A7 and A10. The arrows across the panels indicate the same location for baseline (orange), last test (blue), and the difference (red).
The righthand columns of Fig. 2A contain the RNFL (5,6) and GCL (8,9) probability maps for the two test days, and the thickness change maps for the RNFL (7) and ganglion cell layer (GCL) (10). The thickness change maps are generated by the commercial software after subtracting the baseline thickness values from the follow-up thickness values. Green indicates loss of GCL or RNFL layer, while red means the region was larger on the follow-up test.
Reference Standard (RS)
As there is no gold standard, or single test, that confirms the progression of glaucomatous damage, we developed a reference standard (RS) using the OCT P-Report, which is based upon the first and last visits, as well as the 24-2 and 10-2 GPA reports.
For the RS, we used three criteria based upon three questions: “Is there a progressive thinning of the cpRNFL visible on the b-scan images and/or on the cpRNFL difference plot?” For example, for the eye in Fig. 2, the answer is yes due to thinning of the cpRNFL between the baseline test (orange arrow) and follow-up test (blue arrow). The portion of the circumpapillary image within the red rectangle in Fig. 2A1,A2 is associated with the inferior temporal quadrant of the disc, as seen in panel 2B. The images are shown enlarged in panel 2C. [Note: the red rectangles in Fig. 2A1,A2,&B extend between 0° and −90°.]
The second question is: “Is this progressive thinning of the cpRNFL and/or its location confirmed on the RNFL (Fig. 2A5,A6) and GCL (Fig. 2A8,A9) probability maps and/or on the RNFL (Fig. 2A7) and GCL (Fig. 2A10) change maps?” On these maps, the arrows are in approximately the same physical location as the arrows in panels A3, A4 and C. Notice that the region that is thinned in panel C (orange/blue arrows) shows changes on the probability maps (arrows in panels A5 & A6) and on the change maps (red arrows in panels A7 and A10). Further, the region progressing on the GCL change map (green and white) is topographically associated with the RNFL regions indicated by the arrows, which are in the same physical location, as compared to the scattered red regions, which indicate a thicker second OCT.
Finally, we asked: “Is there evidence of a progressive change at corresponding locations of 24-2 and/or 10-2 VF?” For this progressive structure (pS) vs. progressive function (pF) agreement, there should be a correspondence between the location progressing on the OCT b-scan, as well as on the change and/or probability maps, and the location progressing on the 24-2 and/or 10-2 VFs. The region of the b-scan within the red rectangle of Fig. 3A (from Fig 2C) extends between 0° and −90° and corresponds spatially to the region of the 24-2 GCP map within the red rectangle of Fig. 3B. Thus, there is an agreement between the region seen as progressing on the b-scan of the OCT P-Report and the 24-2 GPA. [In addition, the location within the white rectangle on the GCL probability and change maps in Fig. 3C (from Fig. 2), corresponds to the region within the black rectangle in panel B. Further, the pS-pF agreement is clear on the 10-2 VFs obtained at the same baseline and follow-up periods (Fig. 3D). Note: the commercial 10-2 GPA does not currently have a GCP map.
Figure 3.

A. Portions of the b-scans from Fig. 2C. B. The 24-2 GCP map from Fig. 1B. C. The GCL probability and change maps from Fig. 2. D. The 10-2 pattern deviation maps for the same eye. The red rectangles in panels A and B topographically correspond, as do the white and black rectangles in panels B-D, as described in the text.
Three authors independently assessed the OCT and VF data from the 99 eyes based upon the 3 criteria above. An eye was classified as RS-progression if all three graders classified it as such based upon all 3 criteria. The graders agreed in 95 of 99 eyes (Fleiss’ Kappa=0.856; p<0.001). For the other 4, a consensus was obtained after discussion. Note that these are stringent criteria for progression determination. To allow readers to confirm our classifications of the RS-progression eyes, the 24-2 GPA, the 10-2 GPA and the OCT P-Report for these eyes are available at: https://hoodvisualscience.psychology.columbia.edu/supplemental.
RESULTS
Based upon the 24-2 GPA clinical reports, 15 of the 99 eyes were categorized as PP or LP (Table 1, first row), while the RS identified 10 eyes as RS-progression.
Table 1.
A comparison of the 24-s GPA determined progression to that of a reference standard (RS) based upon both OCT and visual field information for eyes from 70 suspect or glaucomatous patient and 29 healthy controls (HC).
| DEFAULT GPA | 29 HC (specificity) | 70 patients | Totals | |
|---|---|---|---|---|
| 10 RS-progression (sensitivity) | 60 RS-“no progression” | |||
| GPA (PP or LP) | 2 FP | 4 (40%) TP | 9 “FP or TP?” | 15 |
| GPA (NOT PP or LP) | 27 (93%) | 6 FN | 51 | 84 |
| Total | 29 | 10 | 60 | 99 |
Specificity of 24-2 GPA based upon the Reference Standard (RS)
The 15 GPA progressors included 2 of the 29 HC eyes, for a specificity of 93% (green in Table 1). Figure 4 shows the GPA reports for the 2 HC eyes labelled “Likely Progression”. These 2 HC eyes were false positives (FP) based upon the 24-2 GPA, although many clinicians would recognize that these VFs could not be trusted. Note: None of the 29 HC eyes were rated as progressing based upon the RS.
Figure 4.

The 24-2 GPA reports for the two healthy control (HC) eyes categorized as LP.
24-2 GPA sensitivity based upon the RS
Based upon the RS, 10 of the 70 patient eyes were classified as progression. Only 4 of these 10 (red in Table 1) were classified as PP or LP based upon the 24-2 GPA, for a sensitivity of 40%. The 24-2 GPA and P-Report for one of these 4 true positives (TP) are shown in Figs. 1 (GPA) and 2 (OCT). Figure 3 shows the comparison between the location of progression seen on the OCT GCL change maps in the inferior retina and the location of progression seen on 24-2 and 10-2 VFs in the superior hemifield.
On the other hand, 6 of the 10 patient eyes classified as “progression” based upon the RS were not classified as progression by the 24-2 GPA. These 6 (purple in Table 1) are “misses” or false negatives (FN) based upon the 24-2 GPA. Figure 5 shows the results for one of these eyes. Consistent with criterion 1 of the RS, progressive thinning of the cpRNFL is visible on the b-scan images (Fig. 5B), and consistent with criterion 2, the progressive thinning is confirmed on the RNFL (Fig. 5A5,A6) and GCL (Fig. 5A8,A9) probability maps, and on the RNFL (Fig. 5A7) and GCL (Fig. 5A10) change maps. The arrows in Fig. 5 point to approximately the same physical location. Further, thinning in a topographically related region of the GCL maps can be seen in the region within the white rectangle in Fig. 5A10.
Figure 5.
A. Same report as in Fig. 2A but for an eye that the 24-2 GPA was neither PP nor LP. B. Enlarged image of the region in the red rectangle in panels A1 and A2. C. The 24-2 GCP. D. The 10-2 pattern deviation maps for the same eye. The red rectangles in A and C topographically correspond, as do the white and black rectangles in A9,10, C and D.
Concerning the third RS criterion for RS-progression, i.e., confirmation on the VF, the solid red rectangle in Fig. 5C is the approximate VF region topographically associated with the red rectangle in Fig. 5A1-4, & 5B, which extends between 0° and −90° (see Fig. 2C). While the 24-2 Glaucoma Change Probability (GCP) map (Fig. 5C) shows change in the corresponding region of the VF, it does not meet the PP or LP criteria, and misses the local damage seen on the GCL change map in Fig. 5A10. (The region within the black rectangle in Fig. 5C corresponds to the region within the white rectangle in Fig. 5A10.) On the other hand, many of the 10-2 VF locations in Fig. 5D that fall within the same region enclosed within the black rectangle, showed progressive change compared to baseline. Although the 10-2 GPA does not currently have a GCP map, it is clear from the pattern deviation maps in Fig. 5D that progression has taken place.
Figure 6 shows results for the other 5 FNs. In all 5 cases, progression can be seen on the b-scan images (panel 3). For each eye, the solid red rectangle on the 24-2 GCP (panel 1) shows the VF region associated with the portion of the circular b-scan image in panel 3, and the dotted red rectangle in panels 1 and 2 is the region of the 10-2 within the solid red rectangle. The 24-2 shows between 0 (panel A1) and 3 (panel D1) change locations within this dotted rectangle, while many more of the locations on the 10-2 deviation maps showed a change in probability in this region between the baseline and last test. While the change indicated on the 24- GCP and change in significance level on the 10-2 deviation map are not strictly comparable, progression is easier to see on the 10-2 VF in at least 5 of the 6 FNs. In any case, the 24-2 GCP does not reach the criterion for PP or LP in any of these eyes with local progression.
Figure 6.

The 24-2 GCP map (1), the 10-2 baseline and last test (2) and the enlarged image of circular b-scan (3) for 5 of the 6 eyes that were 24-2 GPA false negatives. The red arrows point to the region of local RNFL thinning between the baseline and last test. In panels 1–3, the solid red rectangles are the portion of the 24-2 VF that are topographically associated with the region of the circumpapillary RNFL in panel 3, while the dotted red rectangle is the region within this solid red rectangle covered by the 10-2 VF.
Possible FP based upon RS
Sixty of the 70 patient eyes were not classified as progression based upon the RS. However, 9 of these were judged as PP or LP by the 24-2 GPA (black in Table 1). Our RS requires both VF and OCT confirmation and therefore the lack of RS evidence for progression does not necessarily mean that the GPA is not detecting real progression. Theoretically, these 9 eyes might be true positives (TPs) that are missed by the strict criteria of our RS. On the other hand, these 9 could be 24-2 GPA FPs (mistakes). To assess if the RS missed progression seen on the 24-2 GPA, we examined the OCT P-report for evidence of progression in the region(s) identified as LP or PP on the 24-2 GPA. Figure 7A illustrates this approach for one of these 9 eyes. We examined the portion of the OCT b-scans (red rectangles in panels 1 and 2) associated with the regions on the GCP map within the solid red rectangle in panels 4. [Note: on the b-scan the red rectangle extends between 0° and 90° in the case of lower VF and between 0° and −90° in the case of upper VF.] The other panels in Fig. 7 show the b-scan images (left panel) and the 24-2 GCP maps (right panel) for the other 8 “possible FP” eyes. There is little indication of a change in the b-scan images (left in each panel). Furthermore, 6 of the 15 LP or PP eyes were PP, and 5 of these where among the 9 possible FPs. Finally, in all cases, the cpRNFL has a healthy appearance and thickness. Thus, if these eyes are progressing, then the progression is very mild.
Figure 7.

For one of the possible 24-2 GPA false positives, panel A contains (1) The b-scan of the baseline (top) and last (bottom) tests; (2) the cpRNFL thickness plots (top) of the follow-up (black line) overlayed on the baseline (gray line) and the difference of the curves (bottom) in which red indicates a significant difference; (3) the enlarged the circular b-scans from panel 1; and (4) the GCP. B-I The circular b-scans (left) of baseline and follow-up and the corresponding 24-2 GCP map (right) for the remaining 8 “possible false positives”.
GPA Reports Excluding FN and Fixation Errors.
We also generated 24-2 GPA reports after removing VFs with FN responses greater than 15% or Fixation Errors greater than 33%. The results were essentially the same. Although the modified GPA identified 2 fewer eyes as PP or LP than the GPA with the default settings, the sensitivity did not change, as only 4 of the 10 RS-progression eyes were identified as PP or LP (sensitivity: 40%). In addition, as with the default settings, 2 HCs were classified as progression (specificity: 93%); one HC was a FP for both the default and modified settings.
DISCUSSION
GPA sensitivity and early glaucoma
The purpose of this study was to better understand the efficacy of the 24-2 GPA for detecting progression in eyes with early glaucoma (i.e., 24-2 MD better than −6dB). We found that the 24-2 GPA missed progression seen on OCT b-scans and maps. In particular, the 24-2 GPA, with the default settings typically used in the clinic, missed 6 (60%) of the 10 eyes identified as progressing based upon the RS, which included combined OCT and VF information. Previous studies that evaluated the sensitivity of the 24-2 GPA in cases with early and moderate glaucomatous damage, based upon the average 24-2 mean deviation (MD) at baseline, ranged from 75% to 96% sensitivity.16–19 Although the range is fairly wide, even the lowest reported sensitivity was markedly higher than the sensitivity of 40% reported in our study. There are at least 2 possible explanations for this discrepancy. First, we used a different RS. Any sensitivity measure will depend upon the RS and/or the method employed to define progression; and a variety of methods have been used in previous work.16–19 In this study, we implemented a combined OCT-VF RS that is likely more sensitive for detection of local damage due to its emphasis on topographical correspondence between the RNFL and GCL maps. Past studies, however, have noted that the 24-2 GPA is less sensitive to local damage,16,17,25 potentially explaining differences in reported sensitivities. Second, there are differences in inclusion criteria. All eyes in our study had a baseline 24-2 MD better than −6dB (i.e., early glaucoma), while all other studies had a broader range of MD and included eyes that could be considered moderate glaucomatous.
In any case, the 24-2 GPA did miss eyes with clear progression on OCT b-scans, thickness maps and probability maps, as well as the VF. Further, as predicted, this damage involved the critical macular region. In fact, the macula was involved in all 10 eyes showing progress based upon the RS. Even in the 6 false negative cases, progression included a region within 8° of fixation as seen on the GCL maps and 10-2 VF.
24-2 GPA false positives
In addition to the 2 HC mistakenly labelled as progression, the 24-2 GPA labelled 9 eyes without progression based upon the RS, as LP or PP (Fig. 7). Most, if not all, of these were likely FP. Specificity measures, based on patients’ groups, have been reported by previous studies to range from 83% to 95%; while there are also reports of relatively high false-positive alerts in the cases of patients with early glaucoma (MD < −6dB).16–19,26,27 In any case, none of these 9 eyes showed clear changes on the OCT. Interestingly, these 9 included 5 of the 6 PP eyes, which were among the 15 PP or LP eyes. It is also important to note that even if we are mistaken and these eyes are true positives, the cpRNFL damage would be relatively minor as evidenced by the relatively thick cpRNFL seen on the circular b-scan image. In addition, other studies have suggested that when a mild VF defect is present, the OCT RNFL thickness measures may be more helpful in discerning glaucomatous progression than the 24-2 GPA.28,29
Limitations
This study had three limitations worth discussing. First, there is the problem facing any study that evaluates a method for detecting progression. Namely, there is no gold standard for determining if an eye is progressing. Here we used OCT images and maps combined with 24-2 and 10-2 VF maps as our RS. While admittedly there is a qualitative aspect to our RS, it should be possible to automate and quantify this process using an approach similar to the one we have used for detecting glaucoma.30 In any case, the evidence supporting our RS is clear as illustrated in the figures above and available at https://hoodvisualscience.psychology.columbia.edu/supplemental. Note that such qualitative approach by experts is largely accepted to define true progression in clinical trials and their reading centers, which has been shown to improve endpoint estimates, increase statistical power, and increase calculated treatment effects, while their absence could compromise study results.31
Second, all eyes had a MD better than −6 dB. Previous research suggests that the 24-2 GPA would do relatively better in eyes with more advanced disease.28,29 However, the GPA cannot analyze VF points with low sensitivity at baseline (for which the expected test-retest variability includes 0 dB)32 and for points where MD exceeds −15 dB, making its use for advanced disease limited.33 In addition, while our RS was developed to detect progression in early glaucomatous eyes, our previous work34,35 suggests that subtle changes in advanced disease can be detected on the cpRNFL images and GCL probability maps from many eyes with advanced glaucoma. In any case, it is important to emphasize that while the eyes in the present study were classified as early glaucoma based upon the 24-2 MD, the fact that they all had damage near fixation makes them moderate or advanced based upon other classification systems.36 Further, if we apply the clinically used 24-2 ICD-10 codes, 28 of the 70 patient eyes were Mild, 20 were Moderate, and 22 were Advanced. Of the 10 RS progressors, 4 were Mild, 2 Moderate, and 4 Advanced.
Third, in general the damage identified by the OCT tended to be largely local. It is possible that the 24-2 GPA may be superior to OCT in detecting progression of more widespread/diffuse damage. However, as mentioned above, previous work has argued that the OCT RNFL thickness measures may be more helpful in discerning glaucomatous progression than the 24-2 GPA in eyes with early damage.28,29 In any case, although our RS could not document diffuse OCT lose in the 9 24-2 GPA progressors labelled as FP, we will continue to monitor these eyes to assess if the 24-2 GPA predicted future progression.
Clinical Implications
There are four clinical implications for the detection of progression in eyes with relatively early glaucomatous damage. First, the macula is probably involved in early progression in many eyes. While this runs counter to some views of glaucomatous damage, it is consistent with the growing body of evidence that in the majority of eyes, the macular region is affected in the earliest stages of glaucoma.8–10,37–45 If the macula is among the first regions to be affected, it appears logical that it is among the first to show progression, and therefore should be monitored more closely. Thus, our findings supply another argument for replacing the 24-2 VF with a 10-2 VF test on many cases.9,13,46–48 In fact, we suspect that a 10-2 GPA has the potential to do better than the 24-2 GPA, once a 10-2 GCP map is commercially available.49
Second, if the 24-2 GPA is used in the clinic, it should be interpreted with caution. In fairness, the clinician typically combines the GPA output with other information. This study suggests that the GPA output can be misleading and cannot be relied upon as the sole indicator of progression. As such, it should be used in conjunction with OCT, and in some case 10-2 VFs. In general, there is a growing body of evidence highlighting the strength of structure-function approaches for detecting progression.40,50–53 In addition, effective use of the GPA requires a clear understanding of how the GPA uses variability for its analysis. Artes et al. has noted that because the GPA uses variability estimated from a reference group of patients, it may be overly conservative in highly reliable test-takers and not sufficiently conservative in test-takers with larger between-test variability.26,54 Although there are current recommendations that one needs 6 VF tests over a 2 year period to detect significant rapid progression with acceptable statistical power,55 it should be possible to significantly reduce the number of VFs if they are combined with OCT.
Third, it may be possible to improve the VF GPA approach by eliminating “unreliable VFs”, or by using a 10-2 GPA if commercially available. However, these changes, even if successful, will not allow the clinician to use the GPA analysis to answer the question “did the eye progress since the last visit” as the algorithm still requires at least 4 tests to detect even probable progression. This is often critical in practice as decisions for treatment changes may not allow for waiting long periods to determine if progression is true or not. For this purpose, we predict the OCT will prove to be more effective than the 24-2 GPA.
The final clinical implication involves the potential of the OCT and the OCT P-report as a standalone method for detecting progression. We recently hypothesized that progression of glaucoma can often be accurately detected based upon a single follow-up test using OCT.56 The success of our RS is at least consistent with this hypothesis. Recall that the first two criteria of our RS were based upon only 2 OCT test dates and our P-report. Thus, for many eyes with early glaucoma, it should be possible to detect progression with a single follow-up OCT scan, in contrast to the multiple tests involved in the GPA analysis for VFs, as well as OCT.57 Reducing the number of VFs has the potential to save considerable time and money.
Conclusion
In eyes with early glaucoma (i.e., 24-2 MD better than −6dB), the 24-2 GPA can miss progression seen with OCT, and often on 10-2 visual fields, as well. Furthermore, the region progressing typically includes the macula. The results suggest that including OCT tests and/or 10-2 visual fields should improve detection of progression.
Disclosures:
DCH: Heidelberg Engineering (equipment and grant); Topcon, Inc. (equipment and grant); SLB: None; ET: None; BM: None; JG: None; JML: Carl Zeiss Meditech, Inc. (Instrument Support), Heidelberg Engineering, GmbH (Instrument support); CGDM: None.
Supported in part by the Jane and David Walentas Glaucoma Research Fund, Columbia University Department of Ophthalmology; an unrestricted grant to the Department of Ophthalmology from Research to Prevent Blindness, Inc., New York, NY USA; and National Institutes of Health (Bethesda, MD, USA) Grants EY-02115 (DCH) and EY-025253 (CGDM).
Footnotes
Publisher's Disclaimer: This is a PDF file of an unedited manuscript that has been accepted for publication. As a service to our customers we are providing this early version of the manuscript. The manuscript will undergo copyediting, typesetting, and review of the resulting proof before it is published in its final form. Please note that during the production process errors may be discovered which could affect the content, and all legal disclaimers that apply to the journal pertain.
REFERENCES
- 1.Heijl A, Patella VM, Bengtsson B. The Field Analyzer Primer: Excellent Perimetry: Fifth Edition. Carl Zeiss Meditec, Incorporated; 2021. [Google Scholar]
- 2.Heijl A, Lindgren A, Lindgren G. Test-retest variability in glaucomatous visual fields. Am J Ophthalmol. 1989;108(2):130–135. doi: 10.1016/0002-9394(89)90006-8 [DOI] [PubMed] [Google Scholar]
- 3.Chauhan BC, Johnson CA. Test-retest variability of frequency-doubling perimetry and conventional perimetry in glaucoma patients and normal subjects. Invest Ophthalmol Vis Sci. 1999;40(3):648–656. [PubMed] [Google Scholar]
- 4.Heijl A, Leske MC, Bengtsson B, et al. Reduction of Intraocular Pressure and Glaucoma Progression: Results From the Early Manifest Glaucoma Trial. Arch Ophthalmol. 2002;120(10):1268–1279. doi: 10.1001/archopht.120.10.1268 [DOI] [PubMed] [Google Scholar]
- 5.Spry PGD, Johnson CA, Bates AB, Turpin A, Chauhan BC. Spatial and temporal processing of threshold data for detection of progressive glaucomatous visual field loss. Arch Ophthalmol. 2002;120(2):173–180. doi: 10.1001/archopht.120.2.173 [DOI] [PubMed] [Google Scholar]
- 6.Heijl A, Leske MC, Bengtsson B, Bengtsson B, Hussein M, Group E. Measuring visual field progression in the Early Manifest Glaucoma Trial. Acta Ophthalmol Scand. 2003;81(3):286–293. doi: 10.1034/j.1600-0420.2003.00070.x [DOI] [PubMed] [Google Scholar]
- 7.Carl Zeiss Meditec, Inc. Humphrey® Field Analyzer 3 (HFA3) Instructions for Use.; 2018.
- 8.Hood DC, Raza AS, Moraes CGV de, et al. Initial Arcuate Defects within the Central 10 Degrees in Glaucoma. Invest Ophthalmol Vis Sci. 2011;52(2):940–946. doi: 10.1167/iovs.10-5803 [DOI] [PMC free article] [PubMed] [Google Scholar]
- 9.Hood DC, Raza AS, de Moraes CGV, Liebmann JM, Ritch R. Glaucomatous damage of the macula. Prog Retin Eye Res. 2013;32:1–21. doi: 10.1016/j.preteyeres.2012.08.003 [DOI] [PMC free article] [PubMed] [Google Scholar]
- 10.Traynis I, De Moraes CG, Raza AS, Liebmann JM, Ritch R, Hood DC. The Prevalence and Nature of Early Glaucomatous Defects in the Central 10° of the Visual Field. JAMA Ophthalmol. 2014;132(3):291–297. doi: 10.1001/jamaophthalmol.2013.7656 [DOI] [PMC free article] [PubMed] [Google Scholar]
- 11.Park HYL, Hwang BE, Shin HY, Park CK. Clinical Clues to Predict the Presence of Parafoveal Scotoma on Humphrey 10-2 Visual Field Using a Humphrey 24-2 Visual Field. Am J Ophthalmol. 2016;161:150–159. doi: 10.1016/j.ajo.2015.10.007 [DOI] [PubMed] [Google Scholar]
- 12.Sullivan-Mee M, Karin Tran MT, Pensyl D, Tsan G, Katiyar S. Prevalence, Features, and Severity of Glaucomatous Visual Field Loss Measured With the 10-2 Achromatic Threshold Visual Field Test. Am J Ophthalmol. 2016;168:40–51. doi: 10.1016/j.ajo.2016.05.003 [DOI] [PubMed] [Google Scholar]
- 13.Park SC, Kung Y, Su D, et al. Parafoveal Scotoma Progression in Glaucoma: Humphrey 10-2 versus 24-2 Visual Field Analysis. Ophthalmology. 2013;120(8):1546–1550. doi: 10.1016/j.ophtha.2013.01.045 [DOI] [PubMed] [Google Scholar]
- 14.Grillo LM, Wang DL, Ramachandran R, et al. The 24-2 Visual Field Test Misses Central Macular Damage Confirmed by the 10-2 Visual Field Test and Optical Coherence Tomography. Transl Vis Sci Technol. 2016;5(2):15. doi: 10.1167/tvst.5.2.15 [DOI] [PMC free article] [PubMed] [Google Scholar]
- 15.De Moraes CG, Hood DC, Thenappan A, et al. 24-2 Visual Fields Miss Central Defects Shown on 10-2 Tests in Glaucoma Suspects, Ocular Hypertensives, and Early Glaucoma. Ophthalmology. 2017;124(10):1449–1456. doi: 10.1016/j.ophtha.2017.04.021 [DOI] [PMC free article] [PubMed] [Google Scholar]
- 16.Arnalich-Montiel F, Casas-Llera P, Muñoz-Negrete FJ, Rebolleda G. Performance of glaucoma progression analysis software in a glaucoma population. Graefes Arch Clin Exp Ophthalmol. 2008;247(3):391. doi: 10.1007/s00417-008-0986-1 [DOI] [PubMed] [Google Scholar]
- 17.Heijl A, Bengtsson B, Chauhan BC, et al. A Comparison of Visual Field Progression Criteria of 3 Major Glaucoma Trials in Early Manifest Glaucoma Trial Patients. Ophthalmology. 2008;115(9):1557–1565. doi: 10.1016/j.ophtha.2008.02.005 [DOI] [PubMed] [Google Scholar]
- 18.Diaz-Aleman VT, Anton A, Rosa MG de la, Johnson ZK, McLeod S, Azuara-Blanco A. Detection of visual-field deterioration by Glaucoma Progression Analysis and Threshold Noiseless Trend programs. Br J Ophthalmol. 2009;93(3):322–328. doi: 10.1136/bjo.2007.136739 [DOI] [PubMed] [Google Scholar]
- 19.Antón A, Pazos M, Martín B, et al. Glaucoma Progression Detection: Agreement, Sensitivity, and Specificity of Expert Visual Field Evaluation, Event Analysis, and Trend Analysis. Eur J Ophthalmol. 2013;23(2):187–195. doi: 10.5301/ejo.5000193 [DOI] [PubMed] [Google Scholar]
- 20.Tsamis E, La Bruna S, Grossman J, De Moraes CG, Hood DC. Evaluation of standard and novel summary metrics for detecting progression in glaucoma.
- 21.Keltner JL, Johnson CA, Cello KE, et al. Classification of visual field abnormalities in the ocular hypertension treatment study. Arch Ophthalmol Chic Ill 1960. 2003;121(5):643–650. doi: 10.1001/archopht.121.5.643 [DOI] [PubMed] [Google Scholar]
- 22.Bickler-Bluth M, Trick GL, Kolker AE, Cooper DG. Assessing the utility of reliability indices for automated visual fields. Testing ocular hypertensives. Ophthalmology. 1989;96(5):616–619. doi: 10.1016/s0161-6420(89)32840-5 [DOI] [PubMed] [Google Scholar]
- 23.Keltner JL, Johnson CA, Quigg JM, Cello KE, Kass MA, Gordon MO. Confirmation of visual field abnormalities in the Ocular Hypertension Treatment Study. Ocular Hypertension Treatment Study Group. Arch Ophthalmol Chic Ill 1960. 2000;118(9):1187–1194. doi: 10.1001/archopht.118.9.1187 [DOI] [PubMed] [Google Scholar]
- 24.Hood DC. Improving our understanding, and detection, of glaucomatous damage: An approach based upon optical coherence tomography (OCT). Prog Retin Eye Res. 2017;57:46–75. doi: 10.1016/j.preteyeres.2016.12.002 [DOI] [PMC free article] [PubMed] [Google Scholar]
- 25.Casas-Llera P, Rebolleda G, Muñoz-Negrete FJ, Arnalich-Montiel F, Pérez-López M Fernández-Buenaga R. Visual field index rate and event-based glaucoma progression analysis: comparison in a glaucoma population. Br J Ophthalmol. 2009;93(12):1576–1579. doi: 10.1136/bjo.2009.158097 [DOI] [PubMed] [Google Scholar]
- 26.Artes PH, O’Leary N, Nicolela MT, Chauhan BC, Crabb DP. Visual Field Progression in Glaucoma: What Is the Specificity of the Guided Progression Analysis? Ophthalmology. 2014;121(10):2023–2027. doi: 10.1016/j.ophtha.2014.04.015 [DOI] [PubMed] [Google Scholar]
- 27.Wu Z, Medeiros FA. Comparison of Visual Field Point-Wise Event-Based and Global Trend-Based Analysis for Detecting Glaucomatous Progression. Transl Vis Sci Technol. 2018;7(4):20. doi: 10.1167/tvst.7.4.20 [DOI] [PMC free article] [PubMed] [Google Scholar]
- 28.Tenkumo K, Hirooka K, Baba T, Nitta E, Sato S, Shiraga F. Evaluation of relationship between retinal nerve fiber layer thickness progression and visual field progression in patients with glaucoma. Jpn J Ophthalmol. 2013;57(5):451–456. doi: 10.1007/s10384-013-0254-8 [DOI] [PubMed] [Google Scholar]
- 29.Abe RY, Diniz-Filho A, Zangwill LM, et al. The Relative Odds of Progressing by Structural and Functional Tests in Glaucoma. Invest Ophthalmol Vis Sci. 2016;57(9):OCT421–428. doi: 10.1167/iovs.15-18940 [DOI] [PMC free article] [PubMed] [Google Scholar]
- 30.Tsamis E, Bommakanti NK, Sun A, Thakoor KA, Moraes CGD, Hood DC. An Automated Method for Assessing Topographical Structure–Function Agreement in Abnormal Glaucomatous Regions. Transl Vis Sci Technol. 2020;9(4):14–14. doi: 10.1167/tvst.9.4.14 [DOI] [PMC free article] [PubMed] [Google Scholar]
- 31.Gordon MO, Higginbotham EJ, Heuer DK, et al. Assessment of the Impact of an Endpoint Committee in the Ocular Hypertension Treatment Study. Am J Ophthalmol. 2019;199:193–199. doi: 10.1016/j.ajo.2018.11.006 [DOI] [PMC free article] [PubMed] [Google Scholar]
- 32.Gardiner SK, Swanson WH, Goren D, Mansberger SL, Demirel S. Assessment of the Reliability of Standard Automated Perimetry in Regions of Glaucomatous Damage. Ophthalmology. 2014;121(7):1359–1369. doi: 10.1016/j.ophtha.2014.01.020 [DOI] [PMC free article] [PubMed] [Google Scholar]
- 33.Wesselink C, Heeg GP, Jansonius NM. Glaucoma Monitoring in a Clinical Setting: Glaucoma Progression Analysis vs Nonparametric Progression Analysis in the Groningen Longitudinal Glaucoma Study. Arch Ophthalmol. 2009;127(3):270–274. doi: 10.1001/archophthalmol.2008.585 [DOI] [PubMed] [Google Scholar]
- 34.Lee S, Joiner D, Tsamis E, et al. OCT Circle Scans Can Be Used to Study Many Eyes with Advanced Glaucoma. Ophthalmol Glaucoma. 2019;2(3):130–135. doi: 10.1016/j.ogla.2019.02.004 [DOI] [PMC free article] [PubMed] [Google Scholar]
- 35.Thenappan A, Tsamis E, Zemborain ZZ, et al. Detecting Progression in Advanced Glaucoma: Are Optical Coherence Tomography Global Metrics Viable Measures? Optom Vis Sci Off Publ Am Acad Optom. Published online May 7, 2021. doi: 10.1097/OPX.0000000000001697 [DOI] [PMC free article] [PubMed] [Google Scholar]
- 36.De Moraes CG, Sun A, Jarukasetphon R, et al. Association of Macular Visual Field Measurements With Glaucoma Staging Systems. JAMA Ophthalmol. 2019;137(2):139. doi: 10.1001/jamaophthalmol.2018.5398 [DOI] [PMC free article] [PubMed] [Google Scholar]
- 37.Hou H, Moghimi S, Zangwill LM, et al. Macula Vessel Density and Thickness in Early Primary Open-Angle Glaucoma. Am J Ophthalmol. 2019;199:120–132. doi: 10.1016/j.ajo.2018.11.012 [DOI] [PMC free article] [PubMed] [Google Scholar]
- 38.Hood DC, Slobodnick A, Raza AS, Moraes CG de, Teng CC, Ritch R. Early Glaucoma Involves Both Deep Local, and Shallow Widespread, Retinal Nerve Fiber Damage of the Macular Region. Invest Ophthalmol Vis Sci. 2014;55(2):632–649. doi: 10.1167/iovs.13-13130 [DOI] [PMC free article] [PubMed] [Google Scholar]
- 39.Ojima T, Tanabe T, Hangai M, Yu S, Morishita S, Yoshimura N. Measurement of Retinal Nerve Fiber Layer Thickness and Macular Volume for Glaucoma Detection Using Optical Coherence Tomography. Jpn J Ophthalmol. 2007;51(3):197–203. doi: 10.1007/s10384-006-0433-y [DOI] [PubMed] [Google Scholar]
- 40.Tan O, Li G, Lu ATH, Varma R, Huang D. Mapping of Macular Substructures with Optical Coherence Tomography for Glaucoma Diagnosis. Ophthalmology. 2008;115(6):949–956. doi: 10.1016/j.ophtha.2007.08.011 [DOI] [PMC free article] [PubMed] [Google Scholar]
- 41.Takayama K, Hangai M, Durbin M, et al. A Novel Method to Detect Local Ganglion Cell Loss in Early Glaucoma Using Spectral-Domain Optical Coherence Tomography. Invest Ophthalmol Vis Sci. 2012;53(11):6904–6913. doi: 10.1167/iovs.12-10210 [DOI] [PubMed] [Google Scholar]
- 42.Hwang YH, Jeong YC, Kim HK, Sohn YH. Macular Ganglion Cell Analysis for Early Detection of Glaucoma. Ophthalmology. 2014;121(8):1508–1515. doi: 10.1016/j.ophtha.2014.02.019 [DOI] [PubMed] [Google Scholar]
- 43.Hood DC, Raza AS, Moraes CGV de, Johnson CA, Liebmann JM, Ritch R. The Nature of Macular Damage in Glaucoma as Revealed by Averaging Optical Coherence Tomography Data. Transl Vis Sci Technol. 2012;1(1):3–3. doi: 10.1167/tvst.1.1.3 [DOI] [PMC free article] [PubMed] [Google Scholar]
- 44.Kim KE, Park KH, Yoo BW, Jeoung JW, Kim DM, Kim HC. Topographic Localization of Macular Retinal Ganglion Cell Loss Associated With Localized Peripapillary Retinal Nerve Fiber Layer Defect. Invest Ophthalmol Vis Sci. 2014;55(6):3501–3508. doi: 10.1167/iovs.14-13925 [DOI] [PubMed] [Google Scholar]
- 45.Hammel N, Belghith A, Weinreb RN, Medeiros FA, Mendoza N, Zangwill LM. Comparing the Rates of Retinal Nerve Fiber Layer and Ganglion Cell–Inner Plexiform Layer Loss in Healthy Eyes and in Glaucoma Eyes. Am J Ophthalmol. 2017;178:38–50. doi: 10.1016/j.ajo.2017.03.008 [DOI] [PubMed] [Google Scholar]
- 46.Hood DC, De Moraes CG. Challenges to the Common Clinical Paradigm for Diagnosis of Glaucomatous Damage With OCT and Visual Fields. Invest Ophthalmol Vis Sci. 2018;59(2):788–791. doi: 10.1167/iovs.17-23713 [DOI] [PMC free article] [PubMed] [Google Scholar]
- 47.Hood DC, De Moraes CG. Four Questions for Every Clinician Diagnosing and Monitoring Glaucoma. J Glaucoma. 2018;27(8):657–664. doi: 10.1097/IJG.0000000000001010 [DOI] [PMC free article] [PubMed] [Google Scholar]
- 48.Susanna FN, Melchior B, Paula JS, et al. Variability and Power to Detect Progression of Different Visual Field Patterns. Ophthalmol Glaucoma. Published online April 20, 2021. doi: 10.1016/j.ogla.2021.04.004 [DOI] [PubMed] [Google Scholar]
- 49.De Moraes CG, Paula JS, Blumberg DM, et al. Detection of Progression With 10-2 Standard Automated Perimetry: Development and Validation of an Event-Based Algorithm. Am J Ophthalmol. 2020;216:37–43. doi: 10.1016/j.ajo.2020.03.046 [DOI] [PubMed] [Google Scholar]
- 50.Zhang X, Dastiridou A, Francis BA, et al. Comparison of Glaucoma Progression Detection by Optical Coherence Tomography and Visual Field. Am J Ophthalmol. 2017;184:63–74. doi: 10.1016/j.ajo.2017.09.020 [DOI] [PMC free article] [PubMed] [Google Scholar]
- 51.Zhang C, Tatham AJ, Daga FB, Jammal AA, Medeiros FA. Event-based analysis of visual field change can miss fast glaucoma progression detected by a combined structure and function index. Graefes Arch Clin Exp Ophthalmol. 2018;256(7):1227–1234. doi: 10.1007/s00417-018-3963-3 [DOI] [PubMed] [Google Scholar]
- 52.Garway-Heath DF, Zhu H, Cheng Q, et al. Combining optical coherence tomography with visual field data to rapidly detect disease progression in glaucoma: a diagnostic accuracy study. Health Technol Assess Winch Engl. 2018;22(4):1–106. doi: 10.3310/hta22040 [DOI] [PMC free article] [PubMed] [Google Scholar]
- 53.Nguyen AT, Greenfield DS, Bhakta AS, Lee J, Feuer WJ. Detecting Glaucoma Progression Using Guided Progression Analysis with OCT and Visual Field Assessment in Eyes Classified by International Classification of Disease Severity Codes. Ophthalmol Glaucoma. 2019;2(1):36–46. doi: 10.1016/j.ogla.2018.11.004 [DOI] [PubMed] [Google Scholar]
- 54.Artes PH, Sharpe GP, O’Leary N, Crabb DP. Visual Field Progression In Glaucoma: The Specificity of the Guided Progression Analysis Varies Considerably Between Individual Patients. Invest Ophthalmol Vis Sci. 2011;52(14):4148. [Google Scholar]
- 55.Chauhan BC, Garway-Heath DF, Goñi FJ, et al. Practical recommendations for measuring rates of visual field change in glaucoma. Br J Ophthalmol. 2008;92(4):569–573. doi: 10.1136/bjo.2007.135012 [DOI] [PMC free article] [PubMed] [Google Scholar]
- 56.Hood DC, Zemborain ZZ, Tsamis E, De Moraes CG. Improving the Detection of Glaucoma and Its Progression: A Topographical Approach. J Glaucoma. 2020;29(8):613–621. doi: 10.1097/IJG.0000000000001553 [DOI] [PMC free article] [PubMed] [Google Scholar]
- 57.Hood DC, Melchior B, Tsamis E, Liebmann JM, De Moraes CG. Did the OCT Show Progression Since the Last Visit? J Glaucoma. 2021;30(4):e134–e145. doi: 10.1097/IJG.0000000000001766 [DOI] [PMC free article] [PubMed] [Google Scholar]