

Abstract
The para-crystalline structures of prolamellar bodies (PLBs) and light-induced etioplast-to-chloroplast transformation have been investigated via electron microscopy. However, such studies suffer from chemical fixation artifacts and limited volumes of 3D reconstruction. Here, we examined Arabidopsis thaliana cotyledon cells by electron tomography (ET) to visualize etioplasts and their conversion into chloroplasts. We employed scanning transmission ET to image large volumes and high-pressure freezing to improve sample preservation. PLB tubules were arranged in a zinc blende-type lattice-like carbon atoms in diamonds. Within 2 h after illumination, the lattice collapsed from the PLB exterior and the disorganized tubules merged to form thylakoid sheets (pre-granal thylakoids), which folded and overlapped with each other to create grana stacks. Since the nascent pre-granal thylakoids contained curved membranes in their tips, we examined the expression and localization of CURT1 (CURVATURE THYLAKOID1) proteins. CURT1A transcripts were most abundant in de-etiolating cotyledon samples, and CURT1A was concentrated at the PLB periphery. In curt1a etioplasts, PLB-associated thylakoids were swollen and failed to form grana stacks. In contrast, PLBs had cracks in their lattices in curt1c etioplasts. Our data provide evidence that CURT1A is required for pre-granal thylakoid assembly from PLB tubules during de-etiolation, while CURT1C contributes to cubic crystal growth in the dark.
3D structures of the prolamellar body and its transformation into grana thylakoids were investigated in cryofixed de-etiolating Arabidopsis cotyledon cells using scanning transmission electron tomography.
Introduction
Plastids exist in different forms depending on the cell type and environmental conditions (Jarvis and López-Juez, 2013). In germinating seedlings, proplastids in the cotyledon develop into chloroplasts. When chlorophyll biosynthesis is inhibited in the absence of light, the photosynthetic protein complexes of the thylakoid membrane are not assembled, and chloroplast biogenesis is inhibited (Leivar et al., 2008). Instead, developmentally arrested plastids known as etioplasts form (Solymosi and Schoefs, 2010). Etioplasts transform into chloroplasts once light becomes available and chlorophyll accumulates (Hernandez-Verdeja et al., 2020).
Internal etioplast membranes consist of semi-crystalline tubular membrane networks of prolamellar bodies (PLBs) connected by planar prothylakoids (Ryberg and Sundqvist, 1982; Rascio et al., 1984). During the light-induced etioplast–chloroplast transition, lipids and cofactors stored in PLBs provide building blocks for the chloroplast thylakoids (Ploscher et al., 2011; Armarego-Marriott et al., 2019; Fujii et al., 2019). The most abundant protein constituent of PLBs is light-dependent protochlorophyllide oxidoreductase (LPOR) (Blomqvist et al., 2008), which forms a helical array surrounding PLB tubules (Floris and Kühlbrandt, 2021). LPOR is a photocatalytic enzyme that mediates the reduction of protochlorophyllide (Pchlide) into chlorophyllide to produce chlorophyll (Zhang et al., 2019). LPOR oligomerizes on liposomes, mimicking the PLB membrane to tubulate them in vitro, as shown by cryo-electron microscopy (Nguyen et al., 2021). It is thought that LPOR undergoes conformational changes after photoreduction and dissociates from the PLB membrane, resulting in the breakdown of the PLB lattice. Inactivation of PORA, an Arabidopsis thaliana gene encoding an LPOR protein, led to structural defects in PLBs and abnormal photomorphogenesis (Paddock et al., 2012).
When examined under an electron microscope, PLBs are composed of hexagonal lattices in which tetrahedral units repeat (Murakami et al., 1985). Small angle X-ray studies of isolated PLBs revealed that branched tubules in PLBs are packed primarily in cubic diamond (i.e. zinc blende) symmetry (Williams et al., 1998; Selstam et al., 2007). Recent electron tomography (ET) imaging of runner bean (Phaseolus coccineus) indicated that the PLB lattice matched the wurtzite-type (hexagonal) crystal symmetry (Kowalewska et al., 2016). PLBs in which tubules deviate from the tetrahedral pattern have been reported: the arrangement is known as the “open” type (Gunning, 2001). Moreover, etiolation conditions affect the sizes and density of PLBs (Bykowski et al., 2020).
The light-triggered transformation of PLBs into grana and stroma thylakoids was first investigated in the 1960s using electron microscopy, although these early studies were based on 2D electron micrographs of PLBs and thylakoids (Gunning, 1965; Henningsen and Boynton, 1974; Rascio et al., 1984; Grzyb et al., 2013). An ET analysis of the PLB and thylakoids in de-etiolating runner bean cotyledons showed that PLB tubules directly change into planar thylakoid elements without the involvement of vesicular intermediates and that the helical arrangement of the inter-disc connections within a grana stack appears early in granum development (Kowalewska et al., 2016). In this ET study, the etioplast volumes in the 3D reconstruction were limited in the z-direction coverage, allowing two hexagonal layers to be visualized with a 120-kV electron microscope.
A recent study using serial block-face scanning electron microscopy demonstrated that the conversion of PLBs into photosynthetic thylakoids in Arabidopsis cotyledons occurs within 24 h after illumination in concurrence with correlative proteomic and lipidomic results (Pipitone et al., 2021). The serial block-face scanning electron microscopy approach can visualize larger volumes encompassing the entire etioplasts or chloroplasts, but the resolution is poorer than for ET, especially along the z-axis. In both 3D EM studies, cotyledon samples were prepared by chemical fixation, which fails to preserve intricate or short-lived structures in cells (McIntosh et al., 2005; Staehelin and Kang, 2008). CURVATURE THYLAKOID1 (CURT1) family proteins are thylakoid membrane proteins that stabilize the sharply curved membrane at the grana margin (Armbruster et al., 2013; Pribil et al., 2014). Recently, Sandoval-Ibáñez et al. (2021) utilized ET and biochemical analyses to demonstrate that CURT1 proteins are required for the assembly of PLBs as well as photosynthetic thylakoid membrane biogenesis, although their ET samples were fixed with chemical crosslinkers at room temperature.
In the current study, we examined etioplasts in Arabidopsis cotyledons grown in the dark using serial section ET. Cotyledon samples were prepared by high-pressure freezing to avoid artifacts incurred by conventional fixation. As the stroma is heavily stained in high-pressure frozen etioplasts, we employed scanning transmission ET (STET), which enhances image contrast in tomograms from such specimens (Aoyama et al., 2008; Hohmann-Marriott et al., 2009; Murata et al., 2014; Kang, 2016). Our time-resolved ET study of wild-type and curt1 family mutant cotyledons indicated that grana stacks arise directly from PLBs and that CURT1A is required for stack assembly. In contrast, CURT1C plays a role in the close packing of cubic crystals required for PLB biogenesis in developing etioplasts.
Results
Crystalline structure of Arabidopsis PLBs and their light-induced degradation
To estimate the timeline of the etioplast-to-chloroplast transformation, we examined etiolated Arabidopsis Col-0 cotyledons at 0, 1, 2, 4, 8, and 12-h after illumination (HAL). Cotyledon greening was clearly noticed at 12 HAL (Supplemental Figure S1, A–C), and chlorophyll autofluorescence increased during this period (Supplemental Figure S1, D–H). PLBs in 0 HAL cotyledons appeared as small spots (1.5–2.0 µm in diameter) that emitted autofluorescence (Supplemental Figure S1, D and Dʹ). The fluorescent spots enlarged and spread at 2 HAL, as chlorophyll molecules were produced from Pchlide in PLBs and mobilized (Supplemental Figure S1, E and Eʹ). We monitored the degradation of PLBs in high-pressure frozen cotyledon samples by transmission electron microscopy (TEM) and STET at the six time points. Each etioplast contained PLBs and prothylakoids radiating from the PLBs at 0 HAL (Figure 1A). These prothylakoids were planar and had ribosomes on their stromal surfaces (Supplemental Figure S1, J–K), resembling the pre-granal thylakoids of proplastids in germinating cotyledon cells at 36 h and 64 h after imbibition (Liang et al., 2018).
Figure 1.
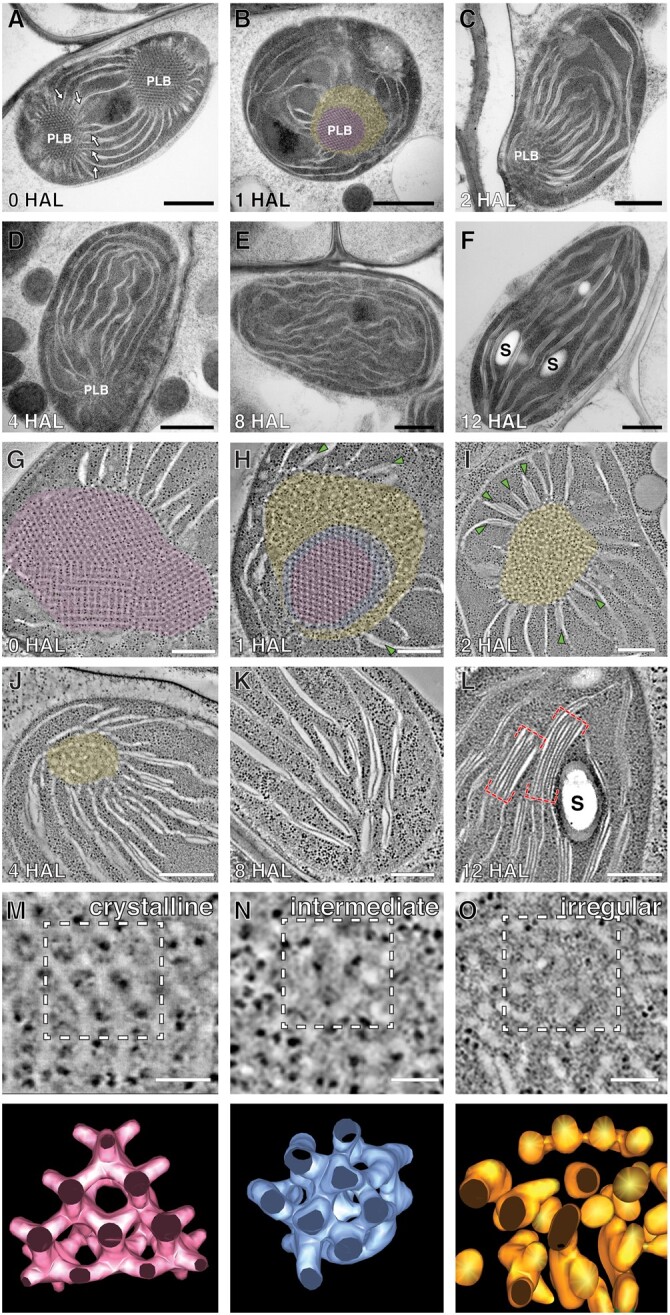
PLB degeneration and thylakoid assembly in de-etiolating Arabidopsis cotyledons. A–F, TEM micrographs of etioplasts/chloroplasts at (A) 0 HAL, (B) 1 HAL, (C) 2 HAL, (D) 4 HAL, (E) 8 HAL, and (F) 12 HAL. Arrows in (A) indicate prothylakoids. S: starch particle. Scale bars = 1 µm. G–L, STET slice images of plastids at (G) 0 HAL, (H) 1 HAL, (I) 2 HAL, (J) 4 HAL, (K) 8 HAL, and (L) 12 HAL. The crystalline, irregular, and intermediate zones in PLBs are highlighted in magenta, yellow, and blue, respectively, in (B) and (G–J). The intermediate zone was distinguished by STET (H) but not by TEM (B). PLB-associated grana stacks are marked with green arrows in (H) and (I). Grana stacks are denoted with red brackets in (L). S: starch particle. Scale bars = 300 nm. M–O, High magnification STET slice images of the PLB lattice (crystalline) at 0 HAL (M), PLB tubules of the intermediate zone at 1 HAL (N), and PLB tubules of the irregular zone at 1 HAL (O). Scale bars = 150 nm. Lower show 3D surface models of the PLB membranes demarcated with dashed squares in the upper images.
The PLBs shrank quickly and lost their crystalline regularity by 2 HAL (Figure 1, A–C, G–I). Double-layered thylakoids appeared in the vicinity of the PLBs as early as 1 HAL (Figure 1H), and the number of disks increased in the PLB-associated grana stacks at 2 HAL (Figure 1I). The PLBs almost degraded in 4 HAL samples and disappeared completely by 8 HAL (Figure 1, D, E, J and K). Chloroplasts at 12 HAL contained typical thylakoid networks where grana stacks consisted of as many as six to eight disks interconnected by stroma thylakoids (Figure 1, F and L). The chloroplasts contained starch particles and were approximately 25% larger than etioplasts at 0 HAL (Figure 1L; Supplemental Figure S1I).
Loss of the crystalline architecture began from the PLB surface (Figure 1B). The inner core retained the lattice structure in 1 HAL PLBs, while tubules at the periphery became disorganized (Figure 1, B and H). Between the crystalline core and the irregular periphery lied a narrow band in which the lattice arrangement was compromised when examined by STET (Figure 1H). No crystalline symmetry was discerned in PLBs at 2 HAL.
We generated 3D surface models of PLB tubules in the crystalline core, disorganized periphery, and intermediate zones at 0 and 1 HAL. PLBs before illumination contained tetravalent nodes (Figure 1M), and the average width of the tubules was calculated to be 24.0 nm (Figure 2K). In the intermediate zone at 1 HAL, tubular nodes were displaced, obscuring the hexagonal pattern (Figure 1N). The peripheral tubules were highly convoluted with varying thicknesses (Figure 1O).
Figure 2.

The crystalline structure of Arabidopsis PLB and its decay during de-etiolation. A, A skeleton model of the PLB in Figure 1G. Regions exhibiting hexagonal or square lattice patterns are marked in green. B, A higher magnification view of the skeleton model shown in A. Nodes are highlighted in light blue. The region exhibiting a square lattice pattern is marked with a green square. C–E, Projection views of select regions (upper), and lattice planes of the space group Fd3m (cubic diamond crystal structure) and their Miller indices, that is (1,1,1), (1,1,0), and (1,0,0) of the PLB skeleton model (bottom). Note that the arrangements of PLB nodes and tubules match those of the cubic diamond lattices in all three planes. F–H, Skeleton models of decaying PLBs at (F) 1 HAL, (G) 2 HAL, and (H) 4 HAL. The models were generated from the tomograms in Figure 1, H, I, and J, respectively. Lines are color-coded to denote the crystalline, irregular, and intermediate zones in PLBs. Scale bars = 300 nm. I, Radial density plots of branching nodes in the skeleton models from the four timepoints of de-etiolation. Peaks in the plots of 0 HAL and 1 HAL crystalline zone (brackets) reveal that pairs of nodes separated by distances of 30–70 nm are abundant in their respective skeleton models. J, The average number of branches at each node in 0 HAL, 1 HAL crystalline, 1 HAL irregular, 2 HAL, and 4 HAL PLBs. Branches were counted from 24 nodes at each stage. (***P < 0.0005 by Welch’s t test, n.s., no significant difference). K, The average thicknesses of tubules in 0 HAL, 1 HAL crystalline, 1 HAL irregular, 2 HAL, and 4 HAL PLBs. The thicknesses were calculated from 81,225 (0 HAL), 17,343 (1 HAL crystalline), 20,864 (1 HAL irregular), 13,391 (2 HAL), and 2333 (4 HAL) tubular segments in PLB surface models. Error bars in J and K indicate standard deviations.
3D skeleton models of PLBs
To determine the crystalline symmetry of PLBs and analyze their collapse quantitatively, we created 3D skeleton models of PLBs in our STET tomograms (Supplemental Figure S2). In the models (consisting of lines and nodes), hexagonal and square lattices were readily discerned in PLBs at 0 HAL (Figure 2, A and B). We were able to capture projection views from the models matching the Miller indices (notation for plane orientations in a crystal lattice) of the diamond cubic symmetry (Figure 2, C–E; Supplemental Movie S1). The periodic hexagonal patterns conformed to the (1,1,1) or (1,1,0) planes, whereas the square lattice matched the (1,0,0) plane (Szwacki and Szwacka, 2010). The diamond cubic unit cell size averaged 65.5 nm (n = 61, sd = 3.71 nm) when measured from nodes in the (1,1,0) or (1,0,0) planes.
From the skeleton models from 1, 2, and 4 HAL PLBs (Figure 2, F–H), we calculated the radial densities of nodes and branching numbers per node at each time point. The node density plot had a peak from 30 nm to 70 nm in 0 HAL and 1 HAL crystalline PLBs, indicating a regular spacing between nodes (Figure 2I). The peak was not present in the skeleton model from the irregular region of PLBs at 1 HAL. In agreement with the tetravalent units seen in the 3D models (Figure 1M), each node had four branches in 0 HAL and 1 HAL crystalline PLBs (Figure 2J). The number of branches decreased as the PLBs degraded during later time points (Figure 2J), and the reduction was accompanied by an increase in tubule thickness (Figure 2K).
Assembly of pre-granal thylakoids and grana stacks on the PLB surface
We generated 3D tomographic models of the PLB–thylakoid interface at 1, 2, and 4 HAL to examine how PLB tubules give rise to pre-granal thylakoids and how they turn into grana stacks. The irregular tubules observed in the PLB periphery became interwoven and smoothened to constitute fenestrated (porous) membrane sheets at 1 and 2 HAL (Figure 3, A–E). Thylakoids in the immediate vicinity of PLBs were fenestrated, but they consolidated into pre-granal thylakoids. The fenestrae (openings) up to 400 nm away from PLBs shrank and disappeared (Figure 3L).
Figure 3.

The PLB to pre-granal thylakoid transition and grana formation from pre-granal thylakoids (A–C) STET slice image (A) and 3D models (B and C) of a PLB (gold) and prothylakoids (blue double-sided arrows) and a fenestrated sheet between them (brown bracket) at 1 HAL (red arrows in A–C). D and E, Fenestrate sheet connected to a PLB at 2 HAL. Fenestrae are indicated by red arrowheads. F and G, High-magnification images of two pre-granal thylakoids connected to a PLB at 2 HAL. A bud emerging from the pre-granal thylakoid is marked by a blue arrow in F and G. H and I, Images and 3D model of a nascent granum consisting of four layers at the margin of a PLB at 2 HAL. Three disks (blue; numbered in H and I) derived from the irregular tubules pile up on a grana-forming thylakoid (green). These disks are interconnected via their margins. J and K, STET slice images (J) and 3D models (K) of a granum and stroma thylakoids associated with a PLB at 4 HAL. The granum consists of five disks that are linked via a helical thylakoid arrangement (yellow membrane in K). As the slice number increases from 1 to 21, the disks 1, 2, and 3 make connections sequentially to the stroma thylakoid (magenta arrows in J and K). Scale bars = 100 nm. L, Correlation plot illustrating the relationship between fenestrae sizes and their distances from PLBs at 2 HAL.
Stacked thylakoids developed from pre-granal thylakoids in the immediate vicinity of PLBs at 2 HAL (Figure 3, F and G). Pre-granal thylakoids laterally overlapped (brown arrow in Figure 3G), or tongue-like outgrowths emerged from and lay down over pre-granal thylakoids (blue arrow in Figure 3G). Three or four-layered grana appeared where thylakoids repeatedly folded (Figure 3, H and I). The acquisition of new layers did not seem to occur in an orderly fashion. Their diverse membrane configurations were similar to those of progranal stacks in young chloroplasts of germinating cotyledon cells (Liang et al., 2018). Grana stacks displaced from PLBs were frequently observed at 4 HAL (Figure 3, J and K). These stacks contained five or six disks linked by helical stroma thylakoids, like typical grana.
We performed RNA-seq and immunoblot analysis of de-etiolating cotyledon samples isolated at 0, 1, 2, 4, 8, and 12 HAL (Supplemental Figure S3, Supplemental Table S1, Supplemental Table S2). Most components of the photosystems and light-harvesting complexes were upregulated at 2 HAL when grana stacks appeared on the PLB surface (Supplemental Figure S3A). However, the levels of photosystem II (PSII), light harvesting complex II (LHCII), PSI, and LHCI proteins did not exhibit a significant increase until 8 HAL (when PLBs disappeared), except for PsaD (Supplemental Figure S3, C and D). The PORA polypeptide levels gradually decreased soon after light exposure, and its transcript amounts were low, except for the 0 HAL samples (Supplemental Figure S3, A, C and D).
Aberrant assembly of pre-granal thylakoids and grana stacks in curt1a etioplasts
To investigate whether CURT1A is required for pre-granal thylakoid assembly and grana formation, we isolated Arabidopsis curt1a T-DNA insertion mutant lines (Supplemental Figures S4 and S5). Etioplasts in 0 HAL curt1a-1 (SALK_030000) cotyledon cells appeared normal, and they contained crystalline PLBs (Figure 4A). We were able to capture projection views matching the cubic diamond crystal system (Figure 4C). However, at 0 and 1 HAL, thylakoids on the PLB surface were swollen in mutant cotyledon cells, in contrast to the flat pre-granal thylakoids in wild-type cotyledon cells (Figure 4, A and D). The swollen thylakoids between a PLB and prothylakoids had fenestrae, but they failed to form grana stacks (Figure 4, O and P).
Figure 4.

Altered PLB-to-thylakoid conversion in the curt1a etioplast. A–B, curt1a-1 STET slice image (A) of a curt1a-1 plastid at 0 HAL and a skeleton model of its PLB (B). Regions with hexagonal or square lattice patterns are marked with a green hexagon or square, respectively, in (B). C, Projection views of select regions in the skeleton model matching the space group Fd3m. Miller indices, i.e., (1,1,1), (1,1,0), and (1,0,0) of the lattice planes are indicated. D–E, STET slice image (D) of a curt1a-1 plastid at 1 HAL and a skeleton model of its PLB (E). F–I, STET slice image of curt1a-1 plastids at (F) 2 HAL, (G) 4 HAL, (H) 8 HAL, and (I) 12 HAL. Red dots in (F) and (G) label pre-granal thylakoids associated with PLBs. Note that grana stacks failed to form around PLBs. Scale bars in (A, D, F–I) = 300 nm. J–K, Skeleton models of decaying PLBs at (J) 2 HAL and (K) 4 HAL. L, Radial density plots of branching nodes in the four skeleton models in B, E, J and K. Peaks in the plots of 0 HAL and 1 HAL (brackets) indicate that node pairs in 1 HAL PLBs maintain distances of 30-70 nm as they do in 0 HAL. Rephrase M, The average number of branches at each node in 0 HAL, 1 HAL, 2 HAL, and 4 HAL PLBs. Branches were counted from 21 nodes at each stage. (****P < 0.0001 by Welch’s t test, n.s., no significant difference). N, The average thicknesses of tubules in 0 HAL, 1 HAL, 2 HAL, and 4 HAL PLBs. The thicknesses were calculated from 52,306 (0 HAL), 10,106 (1 HAL), 17,058 (2 HAL), and 42,453 (4 HAL) tubular segments in PLB surface models. Error bars in M and N indicate standard deviations. O, Tomographic slice images of the thylakoids connected to PLBs in the yellow bracket in (D). Fenestrations in pre-granal thylakoids are indicated with arrows. Scale bars = 200 nm. P, 3D model of the swollen thylakoids (green) and PLB (gold) in (O). Four fenestrae marked with arrows in (P) correspond to the four in the lower part in (O). Scale bars = 100 nm.
Unlike the 1 HAL PLB in the wild type, which consisted of a crystalline core and an irregular periphery (Figures 1, H and 2, F), PLBs in curt1a-1 at 1 HAL retained the lattice architecture throughout its volume (Figure 4D). In the skeleton model (Figure 4E), nodes were separated at regular intervals (Figure 4L, brackets), and their degree of branching did not change (Figure 4M) in 1 HAL PLBs. curt1a PLBs did not exhibit any crystalline structure at 2 HAL as they shrank, and stroma thylakoids proliferated (Figure 4F). PLBs disappeared by 8 HAL, but no grana stacks were found in curt1a chloroplasts (Figure 4, G–H). Chloroplasts in curt1a-1 cotyledon cells at 12 HAL contained extremely wide grana stacks composed of two or three disks (Figure 4I). Another T-DNA mutant allele of curt1a (curt1a-2, GK-805B04) also contained crystalline PLBs, swollen thylakoids at 1 HAL, and lacked grana stacks (Supplemental Figure S5, A–E). The curt1a-1 phenotypes were rescued by transformation with the CURT1A-GFP construct (Supplemental Figure S5, F–J).
CURT1A localizes to nascent pre-granal thylakoids emerging from PLBs and grana stacks
Pre-granal thylakoids and grana stacks emerging from the PLB surface contained highly bent membranes exposed to the stroma (Figure 3, A–C, red arrows). This led us to hypothesize that CURT1 family proteins, which stabilize the curved membrane of each disk in the grana stack, are involved in grana assembly from PLB tubules (Armbruster et al., 2013; Pribil et al., 2014). In the RNA-seq dataset from de-etiolating Arabidopsis cotyledon samples, mRNA levels of CURT1A, CURT1B, and CURT1C were low at 0 HAL. CURT1A transcription was the most active among the three members, with its transcript levels approximately six-fold higher at 12 HAL compared to 0 HAL (Supplemental Figure S3, A and B). In immunoblot analysis, CURT1A, 1B, and 1C were detected in the 0 HAL samples, indicating that they accumulate in PLBs during skotomorphogenesis (Supplemental Figure S3, C and D). The amounts of CURT1A polypeptide approximately doubled between 0 and 12 HAL, whereas CURT1B and CURT1C polypeptide levels did not change. The smaller changes in CURT1 polypeptide versus CURT1 transcript levels suggest that the turnover of CURT1 proteins occurs in de-etiolating cotyledon cells.
We generated transgenic Arabidopsis lines expressing a CURT1A-GFP fusion protein under the control of its native promoter to monitor its localization. The fusion protein rescued the granum assembly defects of curt1a-1 cotyledons, indicating that the fusion protein was functional (Supplemental Figures S4 and S5). At 0 HAL, GFP fluorescence partially overlapped with PLB autofluorescence; some PLBs had a GFP halo or GFP-positive puncta around them (Figure 5A). CURT1A-GFP formed foci on PLBs in 2 HAL chloroplasts over which chlorophyll autofluorescence spread (Figure 5B). Small GFP spots scattered to multiple locations that could correspond to where grana stacks develop in 4 HAL and 8 HAL chloroplasts (Figure 5, C and D). We verified the localization of CURT1A with PLBs by immunogold labeling at the four time points (0, 2, 4, and 8 HAL). CURT1A-specific gold particles were associated most frequently with PLB cortices where new pre-granal thylakoids assembled at 0 to 2 HAL (Figure 5, E–I, brown arrowheads, and M). As the PLBs shrank at 4 and 8 HAL, the majority of CURT1A relocated to thylakoids, binding to grana margins (Figure 5, J–L, green arrowhead, and M). PLBs contained CURT1A-GFP and CURT1A immunogold particles at 0 HAL, validating the notion that CURT1A is deposited in PLBs in the dark (Figure 5, A and E). This observation agrees with the discrepancy between the mRNA and polypeptide levels of CURT1A at 0 HAL (Supplemental Figure S3)
Figure 5.

Localization of CURT1A in PLBs and thylakoids. A–D, Confocal laser scanning micrographs showing CURT1A-GFP distribution at (A) 0 HAL, (B) 2 HAL, (C) 4 HAL, and (D) 8 HAL. Autofluorescence from Pchlide/chlorophyll, fluorescence from CURT1A-GFP, and merged panels are shown in each column. Aʹ–Dʹ are high-magnification micrographs of the regions indicated with squares in parts A–D. In Aʹ and Bʹ, PLBs and CURT1A-GFP puncta are indicated by magenta and blue arrowheads, respectively. Scale bars = 8 mm. E–L, Immunogold labeling showing the localization of CURT1A in Arabidopsis plastids at (E and F) 0 HAL, (G and H) 1 HAL, (I) 2 HAL, (J) 4 HAL, and (K and L) 8 HAL. Gold particles located in PLBs, the periphery of PLBs, stroma thylakoids, and grana stacks (green brackets in J–L) are marked by blue, orange, yellow, and green arrowheads, respectively. Scale bars = 200 nm. M, Histogram showing CURT1A-specific gold particle distribution in Arabidopsis plastids at 0 HAL, 2 HAL, 4 HAL, and 8 HAL. In all, 200–300 gold particles were counted in 30–40 TEM sections from three different cotyledon samples at each time point.
The cubic crystalline lattice is disrupted in curt1c PLBs
As transcripts from CURT1B and CURT1C accumulated in de-etiolating cotyledon cells, we examined T-DNA mutant lines in which CURT1B or CURT1C was inactivated (Figure 6; Supplemental Figure S6). We noticed that the PLBs of curt1c-1 (SALK_023574) cotyledons often had irregularities in their crystalline structure (Figure 6, A–C, and I). Pores as large as 400 nm (Figure 6A) or areas where PLB tubules were disorganized (Figure 6B) were also seen in curt1c-1 PLBs. However, PLBs in 1 HAL curt1c-1 etio-chloroplasts contained irregular tubules in the PLB periphery and a crystalline center (Figure 6D). These observations contrast with the PLB phenotypes of curt1a-1 (Figure 4, D and E). In curt1c-1 mutants at 2 and 4 HAL, grana stacks developed in association with degrading PLBs (Figure 6, E and F). When we expressed CURT1C-GFP driven by its native promoter in the curt1c-1 background, the defects in PLBs disappeared (Figure 6, H and I).
Figure 6.

PLBs in curt1c mutant etioplasts are abnormal. A and B, TEM micrographs (A) and STET slice image (B) of PLBs in curt1c-1 plastids at 0 HAL. Arrows mark defects in the PLB lattice. C, A skeleton model of curt1c-1 PLB in (B). Arrows point to the pores in the PLB. D, TEM micrograph of a curt1c-1 plastid at 1 HAL. Zones in the PLB with irregular and crystalline tubules are highlighted in yellow and magenta, respectively. E–G, TEM micrographs of curt1c-1 plastids at 2 HAL (E), 4 HAL (F), and 12 HAL (G). Grana stacks associated with PLBs are denoted with red brackets in (E) and (F). Scale bars = 500 nm. I, Histogram showing pore numbers per etioplast. ∼30 etioplasts in TEM sections from at least three samples for each genotype were examined. (±sd; one-way ANOVA; **P < 0.01, n.s., no significant difference). H, TEM micrograph of an etioplast in curt1c-1 expressing CURT1C-GFP at 0 HAL. Aʹ and Hʹ are magnified views of PLBs inside the rectangles in (A) and (H), respectively. J–M, CURT1C-GFP localization at 0 HAL (J), 2 HAL (K), 4 HAL (L), and 8 HAL (M) visualized by confocal laser scanning microscopy. Autofluorescence from Pchlide/chlorophyll, fluorescence from CURT1C-GFP, merged panels, and higher-magnification micrographs of regions denoted with squares are provided in each column. Scale bars in (J–M): 8 mm.
CURT1C-GFP signals expressed under the control of the CURT1C promoter overlapped almost entirely with PLB autofluorescence at 0 HAL and shrank together with PLBs (Figure 6, J–M). In 4 HAL etio-chloroplasts (where PLBs have mostly been depleted), GFP-positive spots were scattered over thylakoids (Figure 6L). At 8 HAL (when PLBs completely disappeared), small GFP spots were no longer distinguished. Instead, CURT1C-GFP seemed to spread over the entire chloroplast (Figure 6M). PLBs, their degradation, and thylakoid development around PLBs appeared normal in curt1b-1 (WiscDsLoxHs047_09D) cotyledon cells (Supplemental Figure S6).
Discussion
We determined that the crystalline structure of Arabidopsis PLBs in high-pressure frozen etioplast samples was of the zinc blende type. This result agrees with the findings of a small angle X-ray diffraction study of isolated maize PLBs (Selstam et al., 2007). Floris and Kühlbrandt (2020) showed that PLB tubules intersect to form tetrahedral units that are arranged in hexagons in their cryo-ET analysis of ruptured etioplasts, as expected from a zinc blende structure (i.e. diamond cubic lattice). We did not find any evidence for wurtzite-type lattices in our 3D models; this crystal type was detected in runner bean etioplasts in ET analysis by Kowalewska et al. (2016). The zinc blende lattice is a center-closest packed crystal system with a repeating unit of three layers, whereas the wurtzite lattice is a hexagonal closest packed system with a repeating unit of two layers (Cotton et al., 1995). We prepared approximately 300-nm thick sections to enclose more than four layers within PLBs. Due to the dark staining of stroma in cryofixed samples, tomograms of such thick sections captured in the brightfield TEM mode suffered poor signal-to-noise levels and were not suitable for automatic segmentation. It was crucial to employ STET to enhance the membrane contrast of PLBs to determine their crystalline structure. We cannot rule out the existence of a wurtzite lattice, as such a structure was observed at the boundary between zinc blende crystal domains in squash (Cucurbita moschata) etioplasts before (Murakami et al., 1985).
The LPOR–Pchlide–NADPH ternary complex binds to the lipid bilayer to produce membrane tubules in vitro, and the complex breaks apart upon illumination, mobilizing the components required to construct the photosynthetic membrane (Nguyen et al., 2021). We observed collapse of the crystalline order from the PLB periphery at 1 HAL, indicating that the photo-activation of LPOR and subsequent Pchilde reduction begin at the PLB periphery. The loss of crystalline architecture at 1 HAL was characterized by randomized internodal distances, reduced branching per node, and thickening of tubules. The tetrahedral branching points were dislocated in the intermediate zone in 1 HAL PLBs. Lying between the inner crystalline and outer irregular regions, the intermediate zone is likely the site in the PLB lattice in which LPOR–Pchlide–NADPH ternary complexes have disassembled immediately after light exposure.
One of the first events in the conversion of proplastids into chloroplasts is the formation of pre-granal thylakoids from tubule-vesicular thylakoid membranes (Liang et al., 2018). Our data indicate that pre-granal thylakoids develop from PLB tubules at the PLB–prothylakoid interface (Figure 7, A and B). Many grana stacks arose in association with PLBs, suggesting that chlorophyll molecules produced from protochlorophyllides in the PLB are directly incorporated into PSII–LHCII supercomplexes that concentrate to the appressed thylakoid regions in the grana stack (Staehelin and Arntzen, 1983; Daum et al., 2010; Wietrzynski et al., 2020). Bloated thylakoids arose from curt1a PLBs, and they failed to form grana stacks (Figure 4, O and P, Figure 7C). CURT1A-GFP, which rescued the curt1a phenotype, concentrated to patches surrounding the PLB at 0 and 2 HAL. We speculate that these GFP-enriched sites are where pre-granal thylakoids and grana stacks are assembled (Figure 7B). Decay of the crystalline PLB was slower in curt1a than the wild type, probably due to the block in the transformation of PLB tubules into pre-granal thylakoids. All three CURT1 isotypes, 1A, 1B, and 1C, were transcriptionally active, and their gene products were detected in de-etiolating cotyledon specimens. However, the curt1b and curt1c mutant lines did not exhibit defects in the PLB-to-pre-granal thylakoid transition.
Figure 7.

Schematic diagrams illustrating the functions of CURT1A and CURT1C during de-etiolation. A, Model of pre-granal thylakoid development from PLB tubules. The irregular region of degrading PLBs gradually coalesces into a fenestrated sheet that matures into pre-granal thylakoids when the fenestrae shrinks and disappears. CURT1A stabilizes the membrane curvature at the tips of pre-granal thylakoids growing out from a PLB. B, PLBs accumulate CURT1A and CURT1C in the dark. Upon illumination, PLB decay occurs from the outer layer, and CURT1A concentrates to the sites where new pre-granal thylakoids (arrowheads) and grana stacks (brackets) are assembled. CURT1C does not exhibit such relocation. Magenta, blue, and yellow regions of the 1 h PLB correspond to the crystalline, intermediate, and irregular zones in Figures 1, H and 2, F. C, Pre-granal thylakoids growing out from PLBs are swollen (arrowheads) and grana stacks do not form in curt1a. D, PLBs in curt1c etioplasts have pores and disorganized tubules (arrows).
PLBs in curt1c cotyledons contained large holes or disarrayed tubules, indicating that CURT1C is required for PLB assembly in the dark (Figure 7D). When we expressed CURT1C-GFP driven by the native curt1c promoter, the defects were rescued, validating a skotomorphogenic function of CURT1C. During de-etiolation, CURT1C-GFP spread uniformly over the PLBs, and the PLB-associated fluorescence faded together with PLB degradation. In contrast, CURT1A-GFP spots localized to the PLB periphery at 4 HAL and 8 HAL (Figure 5, C and D), and inactivation of CRUT1A led to aberrant pre-granal thylakoid formation (Figure 4, O and P). The distinct mutant phenotypes and localizations of the two proteins indicate a functional diversification of CURT1A and CURT1C for membrane dynamics in the etioplast. Characterizing the functions of CURT1C in PLB biogenesis will require 3D electron microscopic analyses of etiolating plastids at multiple time points after seedling germination in the dark.
A recent publication reported that the PLB structure and chloroplast biogenesis from etioplasts were affected in curt1abcd quadruple mutant seedlings and that overexpression of CURT1A altered the PLB morphology (Sandoval-Ibáñez et al., 2021). Our study is distinct from their research in that we (1) focused on the membrane dynamics involved in the conversion of PLB tubules into grana stacks occurring within 4 HAL and (2) identified distinct functions of CURT1A and CURT1C (Figure 7). Furthermore, we adopted high-pressure freezing for accurate 3D structural analysis of PLBs and membrane intermediates involved in the etioplast-to-chloroplast transformation. There is a consensus that organelle membranes, including thylakoids, are preserved closer to their native states by high-pressure freezing than by conventional chemical fixation (Kiss et al., 1990; Kang, 2010; Nicolas et al., 2017; Otegui, 2021). Sandoval-Ibáñez et al. (2021) preserved their EM samples by chemical fixation, and 3 HAL was the first time point after 0 HAL when they examined PLBs and thylakoids using TEM/ET. Instead, they compared the photosynthetic capacity of curt1abcd and CURT1A overexpressor lines in more detail.
Second, we characterized the functions of individual CURT1 isotypes by examining their T-DNA mutant phenotypes and transgenic lines expressing GFP fusion proteins. It was impossible to uncover the roles of CURT1A and CURT1C separately in Sandoval-Ibáñez et al. (2021) because their analyses were dependent on mutant lines lacking all CURT1 family proteins or overexpressing CURT1A. curt1abcd exhibited a delay in the onset of photosynthesis and changes in PLB structure. These phenotypes of curt1abcd could be expected from defects in curt1a and curt1c single mutant lines (i.e. slower PLB-to-grana stack transition in curt1a and irregular PLB lattices in curt1c). However, the altered PLB structure in curt1a reported by Sandoval-Ibáñez et al. (2021) does not match our result. PLBs in curt1c, not curt1a, exhibited abnormal crystal lattices. Finally, we did not observe accelerated PLB degradation in curt1a etioplasts, unlike the quadruple mutant etioplasts. We could not interpret the phenotypes of the CURT1A overexpressor line in Sandoval-Ibáñez et al. (2021) because the transgenic line was generated in the Ler-0 background, whose PLB structure appears to be different from that of Col-0, and our study did not involve over-expressor lines. We employed automatic segmentation to produce 3D skeletal models of PLB tubules in high-pressure frozen cotyledon samples. The computer-generated models of PLBs and intermediates of PLB-to-thylakoid transformation were compared in wild-type with those in mutant lines of individual CURT1 family genes. Our results provide evidence for the distinct roles of CURT1A and CURT1C.
Materials and methods
Plant materials and growth conditions
Arabidopsis thaliana Columbia (Col-0) and curt1 seeds (NASC, http://arabidopsis.info/) were surface-sterilized and incubated at 4°C overnight. The seeds then were placed in Petri dishes containing 0.75% Phytoagar supplemented with half-strength (0.5 gL−1, pH 5.8) Murashige–Skoog salt (Sigma-Aldrich, USA; Cat. No. M5524). The dishes were placed in a growth chamber (Panasonic, Japan; Cat. No. MLR-352H-PB) at 22°C, and the seeds were left to germinate and grow for 7 days in the dark. Samples were harvested after illumination with white fluorescent light at a photon flux intensity of 120 μmol m−2 s−1 before dissection.
Generation of CURT1A-GFP and CURT1C-GFP lines in their respective mutant backgrounds
Genomic fragments of CURT1A (AT4G01150) and CURT1C (AT1G52220) including the ∼2-kb promoter regions were amplified and inserted into a binary vector pBI121. The last exons of the genes were translationally fused with GFP in the vector. curt1a-1 and curt1c-1 plants were transformed with the CURT1A-GFP and CURT1C-GFP constructs, respectively, by the floral dip method with Agrobacterium tumefaciens strain GV3101 (Zhang et al., 2006). Transgenic seedlings (T1) were selected on kanamycin-containing 1/2MS + 0.8% Phytoagar (w/v) medium. Seedlings (T2 generation) were tested for GFP expression by immunoblot analysis (anti-GFP antibody, 1:2500 dilution, Abcam, USA; Cat. No. ab290) and observed under a Leica TCS SP8 Confocal Microscope System (Leica Microsystems, Austria). All primers were obtained from Integrated DNA Technologies, and the genomic fragments were amplified with iProof high-fidelity DNA polymerase (Bio-Rad, USA; Cat. No. #1725301). Primer sequences for GFP cloning are listed in Supplemental Table S3.
Confocal laser scanning microscopy of chlorophyll autofluorescence
Confocal micrographs of cotyledon cells were captured using a Leica SP8 laser scanning confocal system with a 63× NA1.20 (water) objective. Seven-day-old dark-grown Arabidopsis seedlings were exposed to white fluorescent light (described above) for 0, 2, 4, 8, and 12 h before imaging. Chlorophyll was excited with a 638-nm laser, and its autofluorescence was examined with a detection wavelength range of 651–715 nm.
High-pressure freezing, sample processing, and TEM
High-pressure freezing, freeze substitution, resin embedding, and ultramicrotomy were performed as described in Kang (2010). The seedlings were examined with a Canon EOS M50 Digital Camera equipped with fluorescence illumination to remove abnormal cotyledons before freezing. Frozen samples were freeze-substituted in anhydrous acetone with 1% OsO4 at −80°C for 24 h. Excess OsO4 was removed at −80°C by rinsing with precooled acetone. After being slowly warmed to room temperature over 60 h, the samples were separated from the planchettes and embedded in Embed-812 resin (Electron Microscopy Sciences, USA; Cat. No. 14120). In all, 80-nm thick sections of samples from each time point were prepared by ultramicrotomy and examined with a Hitachi H-7650 TEM (Hitachi-High Technologies, Japan) operated at 80 kV.
Dual-axis STET, tomogram reconstruction, modeling, and measuring morphometric parameters
The 300-nm thick sections were collected on Formvar-coated copper slot grids (Electron Microscopy Sciences, USA; Cat. No. GS2010-Cu) and stained with 2% uranyl acetate in 70% methanol followed by Reynold’s lead citrate (Mai et al., 2019). Tilt series from ±57° at 1.5° intervals in the scanning transmission electron microscopy (STEM) mode were collected with a 200-kV Tecnai F20 intermediate voltage electron microscope (Thermo-Fischer, USA). The FEI Tomography software (STEM mode) installed in the microscope was used to collect two tilt series around two orthogonal axes as described in Kang (2016). Membrane surface models were generated according to the semi-automatic segmentation procedure in Mai and Kang (2017).
Immunoblot analysis and immunogold labeling
Protein samples were extracted from seedlings at 0 HAL, 1 HAL, 2 HAL, 4 HAL, 8 HAL, and 12 HAL after being pulverized in liquid nitrogen. SDS–PAGE and immunoblot analysis were performed as described by Liang et al. (2018) and Lee et al. (2013). The experiment was repeated three times with total protein extracts from three independent sets of cotyledon samples. For immunogold labeling, thin sections (80-nm thick) of HM20-embedded samples at each time point were prepared by ultramicrotomy, and immunodetection of gold particles was performed as described in Wang et al. (2017). Antibodies for PsaD (AS09 461), Lhca (AS01 005), AtpB (AS05 085), AtpC (AS08 312), PetC (AS08 330), PORA (AS05 067), CURT1A (AS08 316), CURT1B (AS19 4289), and CURT1C (AS19 4287) were purchased from Agrisera (Agrisera, Sweden). Anti-PBA1 antibody (ab98861) and anti-GFP antibody (ab6556) were purchased from Abcam (Abcam, USA). Antibodies against PsbO were provided by Michael Seibert (National Renewable Energy Laboratory). Antibodies for PsbP (Henry et al., 1997) and Lhcb (Payan and Cline, 1991) were donated by Kenneth Cline (University of Florida). For Supplemental Figure S3C, multiple comparisons between data representing polypeptide readouts at each time point and the readout at 0 HAL were performed using one-way ANOVA with Fisher’s LSD test. *P < 0.05, **P < 0.01, ***P < 0.001, ****P < 0.0001. ANOVA tables are provided in Supplemental Table S2.
Transcriptomic analysis
RNA samples were isolated from seedlings at each time point with three biological replicates (separate experiments) using a Qiagen Plant RNA extraction kit (Qiagen, Germany; Cat. No. 74904). A total of 18 cDNA libraries were prepared following the standard BGISEQ-500 RNA sample preparation protocol and sequenced on the DNBseq platform (BGI, China). Raw reads were filtered using SOAPnuke software, and ∼23.23 m clean reads per sample were obtained in FASTQ format. The transcript levels were then calculated and normalized to FPKM using RSEM software. The heat maps and line charts were generated with R Studio (version 1.1.383) as described previously (Liang et al., 2018). FPKM values for CURT1 family genes were calculated to evaluate their expression levels.
Generation of skeleton models from PLB tubules
PLB membranes were first segmented using the 3D Orientation Field Transform tool (https://arxiv.org/abs/2010.01453). Skeletons were generated from the segmented membrane tubules by performing a medial axis transform (also known as “skeletonization”) with an in-built MATLAB algorithm. Each skeleton element was converted into an undirected adjacency matrix carrying node coordinates using the Skel2Graph3D algorithm developed by (Kollmannsberger et al., 2017). The Bresenham’s line algorithm was used to connect node pairs with a straight line (https://arxiv.org/abs/2010.01453). The MATLAB adaptation of the Bresenham’s line algorithm iptui.intline() was modified for this purpose.
Analysis of computer-generated PLB skeleton models
The radial distribution function was computed by first plotting a histogram of the distances r between all the nodes in the skeleton, and then the binned number was divided by 4πr2. A curve approximating the histogram was used to generate probability plots against radial distances. Numbers of branches were counted from skeleton models at each time point. A distance transform with an in-built MATLAB algorithm was used on the binary segmented PLB tomograms to estimate PLB tubule thicknesses. The skeleton of the original segmentation was then introduced as a mask to select voxels around the central axes of PLB tubules. Approximate radii of PLB tubules were calculated from the sizes of the voxels. The radii values were doubled to acquire diameters that correspond to tubular thicknesses. As we calculated diameters from numerous voxels along auto-segmented PLB tubules, we were able to acquire low P-values (high degrees of confidence) in the pairwise comparisons.
Accession numbers
Sequence data from the article can be found in the GenBank/EMBL libraries under the following accession numbers: CURT1A (AT4G01150), CURT1B (AT2G46820), and CURT1C (AT1G52220). The RNA-seq data have been deposited in NCBI Sequence Read Archive under accession number GSE189497.
Supplemental data
The following materials are available in the online version of this article.
Supplemental Figure S1. The etioplast–chloroplast transition in de-etiolating Arabidopsis cotyledons and prothylakoid membrane-bound ribosomes in the 0 HAL etioplast.
Supplemental Figure S2 . Generating skeleton models from PLB tubules in the 0HAL, 1HAL, 2HAL and 4HAL tomograms.
Supplemental Figure S3. Transcriptomic and immunoblot analyses of proteins associated with the thylakoid membrane, CURT1 family proteins, and PORA.
Supplemental Figure S4 . Characterization of curt1 T-DNA insertion mutant lines.
Supplemental Figure S5. The abnormal thylakoid assembly phenotype is reproduced in the curt1a-2 (GK-805B04) allele, and curt1a defects are rescued by expressing CURT1A-GFP.
Supplemental Figure S6. Etioplast-to-chloroplast differentiation in curt1b-1 cotyledons.
Supplemental Table S1. Statistics of the three rounds of RNA-seq experiments at six time points.
Supplemental Table S2. ANOVA tables.
Supplemental Table S3. Primer sequences used for genotyping or molecular cloning.
Supplemental Movie S1. Skeletal model a PLB shown in Figure 2.
Funding
This work was supported by the Hong Kong Research Grant Council (GRF14121019, 14113921, AoE/M-05/12, C4002-20W) and Chinese University of Hong Kong (Direct Grants).
Conflict of interest statement. The authors declare no conflict of interest.
Supplementary Material
Contributor Information
Zizhen Liang, Centre for Cell and Developmental Biology, State Key Laboratory for Agrobiotechnology, School of Life Sciences, The Chinese University of Hong Kong, Shatin, New Territories, Hong Kong, China.
Wai-Tsun Yeung, Centre for Cell and Developmental Biology, State Key Laboratory for Agrobiotechnology, School of Life Sciences, The Chinese University of Hong Kong, Shatin, New Territories, Hong Kong, China.
Juncai Ma, Centre for Cell and Developmental Biology, State Key Laboratory for Agrobiotechnology, School of Life Sciences, The Chinese University of Hong Kong, Shatin, New Territories, Hong Kong, China.
Keith Ka Ki Mai, Centre for Cell and Developmental Biology, State Key Laboratory for Agrobiotechnology, School of Life Sciences, The Chinese University of Hong Kong, Shatin, New Territories, Hong Kong, China.
Zhongyuan Liu, Centre for Cell and Developmental Biology, State Key Laboratory for Agrobiotechnology, School of Life Sciences, The Chinese University of Hong Kong, Shatin, New Territories, Hong Kong, China.
Yau-Lun Felix Chong, Department of Physics, The Chinese University of Hong Kong, Shatin, New Territories, Hong Kong, China.
Xiaohao Cai, School of Electronics and Computer Science, The University of Southampton, Southampton, UK.
Byung-Ho Kang, Centre for Cell and Developmental Biology, State Key Laboratory for Agrobiotechnology, School of Life Sciences, The Chinese University of Hong Kong, Shatin, New Territories, Hong Kong, China.
B-H.K. and Z.L. designed the research. Z.L., W-T.Y., J.M., K.K.M., Z.Y.L., Y-L.F.C., and X.C. performed the experiments. All authors analyzed the data. B-H.K. and Z.L. wrote the article.
The authors responsible for distribution of materials integral to the findings presented in this article in accordance with the policy described in the Instructions for Authors (https://academic.oup.com/plcell) are: Byung-Ho Kang (bkang@cuhk.edu.hk) and Zizhen Liang (zizhenliang@gmail.com).
References
- Armarego-Marriott T, Kowalewska L, Burgos A, Fischer A, Thiele W, Erban A, Strand D, Kahlau S, Hertle A, Kopka J, et al. (2019) Highly resolved systems biology to dissect the etioplast-to-chloroplast transition in tobacco leaves. Plant Physiol 180: 654–681 [DOI] [PMC free article] [PubMed] [Google Scholar]
- Armbruster U, Labs M, Pribil M, Viola S, Xu W, Scharfenberg M, Hertle AP, Rojahn U, Jensen PE, Rappaport F, et al. (2013) Arabidopsis CURVATURE THYLAKOID1 proteins modify thylakoid architecture by inducing membrane curvature. Plant Cell Online 25: 2661–2678 [DOI] [PMC free article] [PubMed] [Google Scholar]
- Blomqvist LA, Ryberg M, Sundqvist C (2008) Proteomic analysis of highly purified prolamellar bodies reveals their significance in chloroplast development. Photosynthesis Res 96: 37–50 [DOI] [PubMed] [Google Scholar]
- Bykowski M, Mazur R, Buszewicz D, Szach J, Mostowska A, Kowalewska L (2020) Spatial nano-morphology of the prolamellar body in etiolated Arabidopsis thaliana plants with disturbed pigment and polyprenol composition. Front Cell Dev Biol 8: 586628. [DOI] [PMC free article] [PubMed] [Google Scholar]
- Cotton FA, Wilkinson G, Gaus PL (1995) Basic inorganic chemistry. InIonic solids, John Wiley & Sons, New York, p 139 [Google Scholar]
- Daum B, Nicastro D, Austin J 2nd, McIntosh JR, Kuhlbrandt W (2010) Arrangement of photosystem II and ATP synthase in chloroplast membranes of spinach and pea. Plant Cell 22: 1299–1312 [DOI] [PMC free article] [PubMed] [Google Scholar]
- Floris D, Kühlbrandt W (2021) Molecular landscape of etioplast inner membranes in higher plants. Nat Plants 7: 514–523 [DOI] [PMC free article] [PubMed] [Google Scholar]
- Fujii S, Nagata N, Masuda T, Wada H, Kobayashi K (2019) Galactolipids are essential for internal membrane transformation during etioplast-to-chloroplast differentiation. Plant Cell Physiol 60: 1224–1238 [DOI] [PMC free article] [PubMed] [Google Scholar]
- Grzyb JM, Solymosi K, Strzalka K, Mysliwa-Kurdziel B (2013) Visualization and characterization of prolamellar bodies with atomic force microscopy. J Plant Physiol 170: 1217–1227 [DOI] [PubMed] [Google Scholar]
- Gunning BES (1965) Greening process in plastids.1. Structure of prolamellar body. Protoplasma 60: 111–130 [Google Scholar]
- Gunning BES (2001) Membrane geometry of "open" prolamellar bodies. Protoplasma 215: 4–15 [DOI] [PubMed] [Google Scholar]
- Henningsen KW, Boynton JE (1974) Macromolecular physiology of plastids. IX. Development of plastid membranes during greening of dark-grown barley seedlings. J Cell Sci 15: 31–55 [DOI] [PubMed] [Google Scholar]
- Henry R, Carrigan M, McCaffrey M, Ma X, Cline K (1997) Targeting determinants and proposed evolutionary basis for the Sec and the Delta pH protein transport systems in chloroplast thylakoid membranes. J Cell Biol 136: 823–832 [DOI] [PMC free article] [PubMed] [Google Scholar]
- Hernandez-Verdeja T, Vuorijoki L, Strand A (2020) Emerging from the darkness: interplay between light and plastid signaling during chloroplast biogenesis. Physiol Plant 169: 397–406 [DOI] [PubMed] [Google Scholar]
- Hohmann-Marriott MF, Sousa AA, Azari AA, Glushakova S, Zhang G, Zimmerberg J, Leapman RD (2009) Nanoscale 3D cellular imaging by axial scanning transmission electron tomography. Nat Methods 6: 729–731 [DOI] [PMC free article] [PubMed] [Google Scholar]
- Jarvis P, López-Juez E (2013) Biogenesis and homeostasis of chloroplasts and other plastids. Nat Rev Mol Cell Biol 14: 787–802 [DOI] [PubMed] [Google Scholar]
- Kang B-H (2010) Electron microscopy and high-pressure freezing of Arabidopsis. InMüller-Reichert T, ed., Electron Microscopy of Model Systems, pp 259–283 [DOI] [PubMed] [Google Scholar]
- Kang B-H (2016) STEM tomography imaging of hypertrophied golgi stacks in mucilage-secreting cells. Methods Mol Biol 1496: 55–62 [DOI] [PubMed] [Google Scholar]
- Kiss AZ, Giddings TH, Staehelin LA, Sack FD (1990) Comparison of the ultrastructure of conventionally fixed and high pressure frozen/freeze substituted root tips of Nicotiana and Arabidopsis Protoplasma 157: 64–74 [DOI] [PubMed] [Google Scholar]
- Kollmannsberger P, Kerschnitzki M, Repp F, Wagermaier W, Weinkamer R, Fratzl P (2017) The small world of osteocytes: connectomics of the lacuno-canalicular network in bone. New J. Phy 19: 073019 [Google Scholar]
- Kowalewska Ł, Mazur R, Suski S, Garstka M, Mostowska A (2016) Three-dimensional visualization of the tubular-lamellar transformation of the internal plastid membrane network during runner bean chloroplast biogenesis. Plant Cell Online 28: 875–891 [DOI] [PMC free article] [PubMed] [Google Scholar]
- Lee K-H, Park J, Williams DS, Xiong Y, Hwang I, Kang B-H (2013) Defective chloroplast development inhibits maintenance of normal levels of abscisic acid in a mutant of the Arabidopsis RH3 DEAD-box protein during early post-germination growth. Plant J 73: 720–732 [DOI] [PubMed] [Google Scholar]
- Leivar P, Monte E, Oka Y, Liu T, Carle C, Castillon A, Huq E, Quail PH (2008) Multiple phytochrome-interacting bHLH transcription factors repress premature seedling photomorphogenesis in darkness. Curr Biol 18: 1815–1823 [DOI] [PMC free article] [PubMed] [Google Scholar]
- Liang Z, Zhu N, Mai KK, Liu Z, Liu Z, Tzeng D, Tzeng DTW, Osteryoung KW, Zhong S, Staehelin LA, et al. (2018) Thylakoid-bound polysomes and a dynamin-related protein, FZL, mediate critical stages of the linear chloroplast biogenesis program in greening Arabidopsis cotyledons. Plant Cell Online 30: 1476–1495 [DOI] [PMC free article] [PubMed] [Google Scholar]
- Mai KKK, Kang B-H (2017) Semiautomatic segmentation of plant golgi stacks in electron tomograms using 3dmod. Methods Mol Biol 1662: 97–104 [DOI] [PubMed] [Google Scholar]
- Mai KKK, Yeung W-T, Han S-Y, Cai X, Hwang I, Kang B-H (2019) Electron tomography analysis of thylakoid assembly and fission in chloroplasts of a single-cell C4 plant, Bienertia sinuspersici. Sci Rep 9: 19640. [DOI] [PMC free article] [PubMed] [Google Scholar]
- McIntosh R, Nicastro D, Mastronarde D (2005) New views of cells in 3D: an introduction to electron tomography. Trends Cell Biol 15: 43–51 [DOI] [PubMed] [Google Scholar]
- Murakami S, Yamada N, Nagano M, Osumi M (1985) 3-dimensional structure of the prolamellar body in squash etioplasts. Protoplasma 128: 147–156 [Google Scholar]
- Murata K, Esaki M, Ogura T, Arai S, Yamamoto Y, Tanaka N (2014) Whole-cell imaging of the budding yeast Saccharomyces cerevisiae by high-voltage scanning transmission electron tomography. Ultramicroscopy 146: 39–45 [DOI] [PubMed] [Google Scholar]
- Nguyen HC, Melo AA, Kruk J, Frost A, Gabruk M (2021) Photocatalytic LPOR forms helical lattices that shape membranes for chlorophyll synthesis. Nat Plants 7: 437–444 [DOI] [PubMed] [Google Scholar]
- Nicolas WJ, Grison MS, Trépout S, Gaston A, Fouché M, Cordelières FP, Oparka K, Tilsner J, Brocard L, Bayer EM (2017) Architecture and permeability of post-cytokinesis plasmodesmata lacking cytoplasmic sleeves. Nat Plants 3: 1–11 [DOI] [PubMed] [Google Scholar]
- Otegui MS (2021) High-pressure freezing and freeze substitution for transmission electron microscopy imaging and immunogold-labeling. Methods Mol Biol 2200: 337–347 [DOI] [PubMed] [Google Scholar]
- Paddock T, Lima D, Mason ME, Apel K, Armstrong GA (2012) Arabidopsis light-dependent protochlorophyllide oxidoreductase A (PORA) is essential for normal plant growth and development. Plant Mol Biol 78: 447–460 [DOI] [PubMed] [Google Scholar]
- Payan LA, Cline K (1991) A stromal protein factor maintains the solubility and insertion competence of an imported thylakoid mem- brane protein. J Cell Biol 112: 603–613 [DOI] [PMC free article] [PubMed] [Google Scholar]
- Pipitone R, Eicke S, Pfister B, Glauser G, Falconet D, Uwizeye C, Pralon T, Zeeman SC, Kessler F, Demarsy E (2021) A multifaceted analysis reveals two distinct phases of chloroplast biogenesis during de-etiolation in Arabidopsis. eLife 10: e62709 [DOI] [PMC free article] [PubMed] [Google Scholar]
- Ploscher M, Reisinger V, Eichacker LA (2011) Proteomic comparison of etioplast and chloroplast protein complexes. J Proteomics 74: 1256–1265 [DOI] [PubMed] [Google Scholar]
- Pribil M, Labs M, Leister D (2014) Structure and dynamics of thylakoids in land plants. J Exp Botany 65: 1955–1972 [DOI] [PubMed] [Google Scholar]
- Rascio N, Mariani P, Casadoro G (1984) Etioplast-chloroplast transformation in maize leaves - effects of tissue age and light-intensity. Protoplasma 119: 110–120 [Google Scholar]
- Ryberg M, Sundqvist C (1982) Characterization of prolamellar bodies and prothylakoids fractionated from wheat etioplasts. Physiologia Plantarum 56: 125–132 [Google Scholar]
- Sandoval-Ibáñez O, Sharma A, Bykowski M, Borràs-Gas G, Behrendorff JB, Mellor S, Qvortrup K, Verdonk JC, Bock R, Kowalewska Ł, et al. (2021) Curvature thylakoid 1 proteins modulate prolamellar body morphology and promote organized thylakoid biogenesis in Arabidopsis thaliana. Proc Nat Acad Sci 118: e2113934118. [DOI] [PMC free article] [PubMed] [Google Scholar]
- Selstam E, Schelin J, Williams WP, Brain AP (2007) Structural organisation of prolamellar bodies (PLB) isolated from Zea mays. Parallel TEM, SAXS and absorption spectra measurements on samples subjected to freeze-thaw, reduced pH and high-salt perturbation. Biochim Biophys Acta 1768: 2235–2245 [DOI] [PubMed] [Google Scholar]
- Solymosi K, Schoefs B (2010) Etioplast and etio-chloroplast formation under natural conditions: the dark side of chlorophyll biosynthesis in angiosperms. Photosynth Res 105: 143–166 [DOI] [PubMed] [Google Scholar]
- Staehelin LA, Arntzen CJ (1983) Regulation of chloroplast membrane function: protein phosphorylation changes the spatial organization of membrane components J Cell Biol 97: 1327–1337 [DOI] [PMC free article] [PubMed] [Google Scholar]
- Staehelin LA, Kang BH (2008) Nanoscale architecture of endoplasmic reticulum export sites and of Golgi membranes as determined by electron tomography. Plant Physiol 147: 1454–1468 [DOI] [PMC free article] [PubMed] [Google Scholar]
- Szwacki NG, Szwacka T (2010) Basic Elements of Crystallography. Jenny Stanford Publishing, Singapore. [Google Scholar]
- Wang P, Chen X, Goldbeck C, Chung E, Kang B-H (2017) A distinct class of vesicles derived from the trans-Golgi mediates secretion of xylogalacturonan in the root border cell. Plant J 92: 596–610 [DOI] [PubMed] [Google Scholar]
- Wietrzynski W, Schaffer M, Tegunov D, Albert S, Kanazawa A, Plitzko JM, Baumeister W, Engel BD (2020) Charting the native architecture of Chlamydomonas thylakoid membranes with single-molecule precision. eLife 9: 53740. [DOI] [PMC free article] [PubMed] [Google Scholar]
- Williams WP, Selstam E, Brain T (1998) X-ray diffraction studies of the structural organisation of prolamellar bodies isolated from Zea mays. FEBS Lett 422: 252–254 [DOI] [PubMed] [Google Scholar]
- Zhang S, Heyes DJ, Feng L, Sun W, Johannissen LO, Liu H, Levy CW, Li X, Yang J, Yu X, et al. (2019) Structural basis for enzymatic photocatalysis in chlorophyll biosynthesis. Nature 574: 722–725 [DOI] [PubMed] [Google Scholar]
- Zhang X, Henriques R, Lin S-S, Niu Q-W, Chua N-H (2006) Agrobacterium-mediated transformation of Arabidopsis thaliana using the floral dip method. Nat Protocols 1: 641. [DOI] [PubMed] [Google Scholar]
Associated Data
This section collects any data citations, data availability statements, or supplementary materials included in this article.