

Abstract
Due to the outbreak of COVID-19 disease globally, countries around the world are facing shortages of resources (i.e. testing kits, medicine). A quick diagnosis of COVID-19 and isolating patients are crucial in curbing the pandemic, especially in rural areas. This is because the disease is highly contagious and can spread easily. To assist doctors, several studies have proposed an initial detection of COVID-19 cases using radiological images. In this paper, we propose an alternative method for analyzing chest X-ray images to provide an efficient and accurate diagnosis of COVID-19 which can run on edge devices. The approach acts as an enabler for the deep learning model to be deployed in practical application. Here, the convolutional neural network models which are fine-tuned to predict COVID-19 and pneumonia infection from chest X-ray images are developed by adopting transfer learning techniques. The developed model yielded an accuracy of 98.13%, sensitivity of 97.7%, and specificity of 99.1%. To highlight the important regions in the X-ray images which directs the model to its decision/prediction, we adopted the Gradient Class Activation Map (Grad-CAM). The generated heat maps from the Grad-CAM were then compared with the annotated X-ray images by board-certified radiologists. Results showed that the findings strongly correlate with clinical evidence. For practical deployment, we implemented the trained model in edge devices (NCS2) and this has achieved an improvement of 90% in inference speed compared to CPU. This shows that the developed model has the potential to be implemented on the edge, for example in primary care clinics and rural areas which are not well-equipped or do not have access to stable internet connections.
Keywords: Chest x-ray, Edge computing, Deep learning, Visualization
Introduction
COVID-19 is an infectious disease caused by severe acute respiratory syndrome coronavirus 2 (SARS-CoV-2) and instigates respiratory infections in humans. This virus first emerged in Wuhan, China, back in December 2019. As of 1 November 2021, there have been 246,594,191 confirmed cases of COVID-19, including 4,998,784 deaths, making it one of the deadliest pandemics in history. The outbreak due to COVID-19 was declared a Public Health Emergency of International Concern on January 30, 2020, and was escalated to a global pandemic status on March 11, 2020, by The World Health Organization (WHO) (WHO 2021; Shereen et al. 2020). Once a person is infected by COVID-19, he or she may exhibit mild symptoms, such as fever, fatigue, cough, loss of taste, or smell. There is a small percentage of patients that suffer from severe and critical conditions, in which the virus leads to pneumonia, multi-organ failure, and even death.
Vaccination is one of the solution to end the pandemic. The development and its enrollment, however, are long and complex processes. Currently, the technique that is widely considered as the gold standard to diagnose COVID-19 according to WHO guidelines, is reverse transcription-polymerase chain reaction (RT-PCR). For the RT-PCR test, a sample of data is obtained and collected from a person’s nose and then placed in an RT-PCR machine to be analyzed. The results are usually available within a few hours or up to a few days. However, due to the outbreak, most countries have been overwhelmed and suffered from shortages of medical resources. The ability to offer COVID-19 testing is constrained in high- and low-income countries alike (Nogee and Tomassoni 2020; He et al. 2020). Hence, the test is only carried out on patients that exhibit relevant symptoms. As stated in He et al. (2020), this poses a serious issue because the probability of transmission of the virus from asymptomatic and pre-symptomatic patients is up to 75%. Before these groups of patients are tested and become confirmed COVID-19 cases, many people are already affected by them. Therefore, it is important that we have an accurate and timely diagnosis tools so that infected patients can be isolated and treated promptly.
Researchers have been looking for alternative screening methods. One of these alternatives are methods based on computerized tomography (CT) scans or chest X-ray images (Fang et al. 2020; Ai et al. 2019). CT scans employ a series of rotated X-ray image to generate create cross-sectional and details images of the body. It, however, is costly and usually only available in big cities. Chest X-ray image, on the other hand, may not be as detailed as CT scans but it is still reliable in assisting medical doctors in diagnosing many respiratory infections. Generally, X-ray image is accessible and affordable compared to CT scans. And, most of the primary care clinics in cities and rural areas have X-ray machines (Ariff and Teng 2002; Falcon 2019).
As reported in Sufian et al. (2020), Pham et al. (2020), Fang et al. (2020) and Ai et al. (2019), radiological imaging could be used as a screening method for detecting COVID-19. Several studies have demonstrated promising results for detecting and prediction COVID-19 cases using chest radiography images (Ariff and Teng 2002; Falcon 2019). In particular, the studies are focused on using and fine-tuning deep learning techniques to detect COVID-19 features.
Deep learning is an emerging field and has been adopted in various medical fields including segmentation of medical imaging data (Kayalıbay et al. 2017), classification and identification of skin cancer (Victor and Ghalib 2017), lung cancer detection and classification (Alakwaa et al. 2017), malaria diagnosis (Liang et al. 2017), and classification and identification of Alzheimer’s disease (Farooq et al. 2017). Researchers have also reported the use of the neural network-based method in predictingCOVID-19 cases (Elsheikh et al. 2021). Nonetheless, to train a deep neural network with promising results, a vast amount of dataset and immense computational resources are required.
The high computational demand is also a challenge in deep learning applications. This is also highlighted in a recent survey paper (Sufian et al. 2020). The high computation cost makes it difficult and impractical to apply deep learning models where resources are limited. Hence, current efforts of deep learning applications have resorted to cloud computing. The trend of cloud computing has continued to grow significantly over the past decade, outpacing many other sectors. However, cloud computing requires a strong internet connection as the end-user device needs to be connected to a central data center. Unfortunately, this is also accompanied by other issues such as data latency, server overload, risk of data leakage, and memory cost. Therefore, a deep learning model which can detect COVID-19 using cloud computing is not preferred.
The trend of edge computing has emerged as it has the potential to combat the concerns associated with cloud computing. Edge computing is defined as a way to process and store data on resource-constrained terminal devices where they are closer to the data sources. This results in a decentralized system whereby the computing is handled locally. Edge computing can be used to replace cloud computing, or to complement existing cloud systems. For example, with an edge, we can offset the load on the cloud and share its computing loads. This can improve the performance of the system and can be adopted for a wide range of deep learning applications (Wang et al. 2020). From the survey papers (Sufian et al. 2020; Pham et al. 2020) however, we can see that works on edge computing for COVID-19 are mostly on monitoring condition especially on hospital services. The use of edge devices for COVID-19 prediction is still limited.
In this work, we aim to develop a method, which can identify/predict COVID-19 and pneumonia in chest X-ray images that is able to be run on edge devices. To overcome the problems of an inadequate dataset, transfer learning techniques are exploited to develop the model. Transfer learning is a popular approach to improve the accuracy and generalization ability whereby a pre-trained model is reused to solve a target task while utilizing the previous knowledge gained (Pan and Yang 2010).
As an additional contribution to establish appropriate confidence and introduce interpretability of the final classification result, the Grad-CAM technique is also applied to the proposed model to extract the gradient information which streams into the final layers of the model. The output of the applied Grad-CAM on the trained model will be a heat map that highlights the important region of the input image that leads to the final decision of the model. To deploy the proposed model on the edge, the model will be optimized for edge application. The proposed system utilizes Intel Neural Compute Stick 2 (NCS2) together with the OpenVINO toolkit to accelerate inference and optimize the proposed model. A low-cost but high-yielding system which can predict COVID-19 and pneumonia diseases using chest X-ray images can serve as a solution to assist relevant healthcare facilities that are less well-equipped or do not have access to stable internet connections. The edge system will serve as an optimal solution for healthcare facilities that have to deal with data privacy and compliance issues as the data center is managed locally.
In summary, the main contributions of this paper are listed as follows:
A deep learning model which can classify and predict COVID-19 and pneumonia disease using chest X-ray images is developed. The model is optimized for implementation in edge devices.
Visual interpretation of the classification results by applying Grad-CAM to the model is adapted to serve as clinical evidence.
The structure of the rest of the paper proceeds as follows: Sect. 2 describes the material used and the proposed methodology for developing the overall system, Sect. 3 presents the experimental analysis to assess the performance of the system. Finally, the paper is concluded in Sect. 4 and future work is also presented.
Material and methods
In this section, the dataset and the methodology are presented. As depicted in the overall design of the system in Fig. 1, there are 3 main stages in developing the proposed system. The first stage is collecting and preparing the dataset which is used to develop the deep learning model. The next stage is developing a convolutional neural network model by exploiting transfer learning to classify healthy, COVID-19, and pneumonia chest X-rays. The models are evaluated by computing the confusion matrix and observing the learning curve of the model during the training and testing process. To establish appropriate trust and confidence in the classification result of the model, Grad-CAM is applied to the network in an effort to provide transparency and interpretability of the developed model. The final stage is the deployment of the model. The system aims to optimize and deploy the model on the edge without sacrificing performance.
Fig. 1.

General workflow of the overall system
Data preparation
The dataset used in the study is obtained from three publicly available sources. The first dataset was collected by Cohen et al. (2020). It is an open dataset that has chest X-rays and CT scans of COVID-19 cases, as well as other viral and bacterial types of pneumonia. Another dataset was obtained from a Kaggle repository (Kermany 2018). The database consists of chest X-ray images for cases of normal, bacterial pneumonia, and viral pneumonia. The final dataset was obtained from Chowdhury et al. (2020), Rahman et al. 2020), the database was contributed by a team of researchers in collaboration with medical doctors. A total of 9337 images were collected from these sources. The collected dataset consists of 795 COVID-19 cases, 2924 normal cases, and 5618 cases of pneumonia. With the COVID-19 class being the minority, the dataset’s class imbalanced problem will affect the model’s accuracy as the model will have the tendency to be biased towards the class with more instances. Hence, random under-sampling techniques are applied to the dataset (Rendón et al. 2020). This technique involves removing data in a random manner from the majority classes to achieve the same amount of data in the minority class. After removing data from normal and pneumonia classes, the dataset consists of 795 data in each class. All of the collected images were normalized to a common scale and resized to 299 × 299 pixels required by the Inception-ResNet-v2 model.
To enable the model to generalize well to unseen data, data augmentation is also implemented on the training set in a random manner. Data augmentations increase diversity in the dataset and could prevent problems like overfitting. Therefore, different data augmentation techniques and values were tested on the dataset to find the best combination that balances overfitting and under-fitting. The data augmentation techniques applied include rotating images at various angle values in the range of , zooming in the range of , horizontal flipping, and shearing in the range of . The dataset is further divided into 2 sets which are the train and test set. The train set consists of 80% of the data, and the remaining fractions for testing purposes. After processing, the combined dataset consists of 1905 images in the train set and 480 in the test set. Each class contains 635 training data and 160 testing data.
Model development
A transfer learning-based approach and its optimization are employed in this project. The base model used in this paper is Inception-ResNet-v2 that has 572 layers. Due to it being a very deep network, it has the advantage of being able to generalize well to never-seen-before data as it can learn complex and non-linear functions. However, a very deep model may also cause degradation problems and could increase the training time significantly. Inception-ResNet-v2 model is a hybrid model that combines both the Inception structure and residual networks. Inception blocks utilize multiple different sizes of kernels in parallel to increase the effectiveness of the variable-size feature in object recognition. Residual blocks can accelerate the training speed of deep models while reducing the vanishing gradient problem. Hence, it can achieve high accuracy while also satisfying the requirements of having increased speed and smaller size (Deng et al. 2010).
When retraining with the new COVID-19 dataset that contains only 1905 images, the machine will be able to exploit the previous knowledge to improve generalization and accuracy. The model is instantiated without the top classifier layer and replaced with modified custom layers as shown in Fig. 2. The newly added custom layers consist of 5 layers which are AveragePooling2D layer, Flatten layer, Dense layer with 64 nodes, Dropout layer, and a final Dense layer with 3 nodes and “softmax” activation function for 3 class prediction. The custom layers are added to reshape the shape dimension for fine-tuning the class prediction (Karthik et al. 2021; Chowdhury et al. 2021).
Fig. 2.
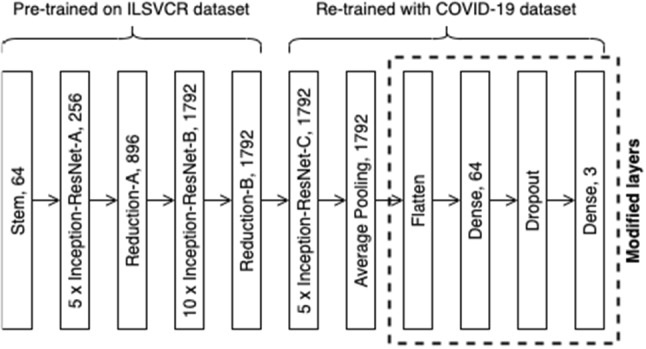
Architectural details of the proposed model [adapted from Szegedy et al. (2017)]
During the first 15 epochs, the pre-trained weights of the initial convolutional layers are frozen, and only the new modified layers are trained on the new dataset to convert extracted features from the early frozen convolutional layers into 3 class predictions. Training is then continued for another 15 epochs whereby part of the later layers will be unfrozen. The weights of the later layers are fine-tuned along with the custom layers using the COVID-19 dataset with a lower learning rate. By doing so, significant improvement of the model’s accuracy could be achieved as the pre-trained features will be more adapted to the new dataset.
Localization using Grad-CAM
Gradient-weighted Class Activation Map (Grad-CAM) aims to build trust in intelligent systems by introducing transparency and interpretability in AI models. It allows intelligent models to explain why the model predicts what they predict. Grad-CAM works by utilizing the gradient information which streams into the last convolutional layer of the model to detect the importance of each neuron for a particular decision made by the model. Class activation map techniques are generally utilized to visually debug a deep learning model due to the non-transparent nature of the neural network. However, Grad-CAM was used in the proposed system to localize the potentially infected area to confirm the classification result. Grad-CAM technique can be used in any layer of a network to provide an explanation of the activations. In the proposed system, Grad-CAM is used in the final convolutional layer as convolutional layers generally preserve spatial information which is usually lost in fully connected layers. The last convolutional layers offer the best trade-off between high-level semantics information and its spatial information (Selvaraju et al. 2020).
To assist the model to localize better, the input chest X-ray images were processed before being read by the proposed model. The lung region was manually extracted as illustrated in Fig. 3. The extracted lung X-ray image will then be taken as input. Once the predicted label has been calculated by the proposed model, the Grad-CAM technique is applied and adopted on the last convolutional layer to obtain a heat-map that highlights regions with the highest importance. The heat-map generated by the Grad-CAM algorithm will be overlaid on the original image for better comparison with the radiologist-marked X-ray image,
Fig. 3.

(Left) Sample original image that is used as input of the model during training (Right) Extracted image that is used as input during prediction
Deployment of the model on the edge
The Intel Movidius Neural Stick 2 (NCS2) is utilized to run the deep learning model on the edge. The OpenVINO toolkit optimizes the CNNs for various Intel-specific hardware devices including the NCS2 (Misra 2019). However, the Inception-ResNet-v2 based model is developed using the deep learning framework Keras that is not supported on the OpenVINO toolkit. Thus, the Keras model, which runs on top of Tensorflow, is converted into a Tensorflow compatible format (Protocol Buffers.pb file) which can be read by the model optimizer of the OpenVINO toolkit. The Model Optimizer (MO) is one of the 2 main components of the OpenVINO toolkit. The other one being the Inference Engine (IE). MO is used in the offline phase and fed with the definition files of the model (Intel Corporation 2022). The primary tasks of MO are described as follows:
Convert the Tensorflow model (.pb file) to Intermediate Representation (IR) format which is the only format that is readable for the IE. The IR format includes 2 files:.xml file which describes the network architecture in XML format and.bin file which consists of the parameters of the trained model in binary format.
Execute optimization of the model such as quantization of the model’s weight and merging model’s layers which result in reduced model’s size.
The model optimizer is able to optimize the model using various precision formats such as INT8, FP16, and FP32. However, due to the computing constraints of NCS2, the model is optimized using FP16 format.
The MO prepares the model to be ready for the deployment phase, whereas the IE executes the inference on the edge device. The IE is installed independently on the inference device and it consists of an API to read the IR files generated by the MO. This deployment environment is separated from the training environment and requires only 2 light-weighted IR files that are generated by the MO to execute inference. The workflow of the inference engine is illustrated in Fig. 4.
Fig. 4.

General workflow of the Inference Engine
Results and Analysis
The experiments are conducted to assess and evaluate the performance of the proposed method. The assessments are as follows;
-
(i)
The classification between healthy, COVID-19, and pneumonia disease.
-
(ii)
The interpretability of the network by comparing X-ray images marked by a board-certified radiologist and the heat-map computed by using Grad-CAM.
-
(iii)
The performance of the optimized model when deploying on different platforms.
The dataset of 2385 images is split into 80% training set and 20% testing set. Hence, the performance of the model is evaluated based on 480 images. Figure 5 illustrates the confusion matrices before and after fine-tuning to discriminate between COVID-19, normal, and pneumonia X-rays. In the confusion matrix, the blue boxes represent classes that are classified correctly, and the white boxes represent misclassified classes. Before fine-tuning, out of 160 COVID-19 X-rays, it can be observed that 1 is misclassified as a normal case and 1 is classified as pneumonia. Only 1 of the normal X-rays is classified as COVID-19, and 5 of them are misclassified as pneumonia. For pneumonia, 1 is classified incorrectly as a COVID-19 case, and 5 are classified as normal cases.
Fig. 5.

Left) Confusion matrix before fine-tuning (Right) Confusion matrix after fine-tuning
After fine-tuning, it is observed that the performance of the model is adjusted and improved. The number of accurate classifications of COVID-19 remain the same, but none of the normal are incorrectly predicted as COVID-19. The number of misclassifications of normal cases as pneumonia are also reduced to 3. There is no misclassification of pneumonia as COVID-19, but 4 of them are still misclassified as normal.
From the confusion matrix, four metrics can be calculated; accuracy, specificity, sensitivity, and F-1 score. Accuracy is the most common and important metric that measures how well the model performs across all classes with can be determined using Eq. 1.
| 1 |
Here, is the number of true positive cases, is the number of true negative cases, indicates the number of false-positive cases and indicates the number of false-negative cases.
Sensitivity, or recall, is the percentage of true positive cases among all the cases that are correctly identified. It measures how well the model is able to identify cases that have the disease.
| 2 |
Specificity is the proportion of cases that are correctly predicted as negative among cases that do not have the disease. It is a measurement of how well the model can predict cases that do not have the disease.
| 3 |
F-1 score measures the accuracy of the model on a dataset, it is the weighted average of sensitivity and specificity. F-1 score takes into consideration both false-positive and false-negative cases. Hence, it is more useful than accuracy when there is an uneven class distribution of false-positive and false-negative cases.
| 4 |
Table 1 summarizes the overall performance on the test set before and after fine-tuning. The results showed improvement in the overall performance metrics, with the overall accuracy increasing from 97.1 to 98.13%.
Table 1.
Summarized result of the performance of the model before and after fine-tuning
| Sensitivity (%) | Specificity (%) | F-1 score (%) | Accuracy (%) | |
|---|---|---|---|---|
| Before fine-tuning | 97.1 | 98.5 | 97.1 | 97.1 |
| After fine-tuning | 97.7 | 99.1 | 98.3 | 98.13 |
The accuracy and loss of the model for both train and test set are also observed for each epoch. This is illustrated in Fig. 6 where the variation of accuracy and loss during the process of training and testing can be monitored. The training and testing loss decrease with the increase of training iteration epochs and gradually converges after approximately 25 epochs. This indicates that no significant overfitting or under-fitting problems is observed.
Fig. 6.
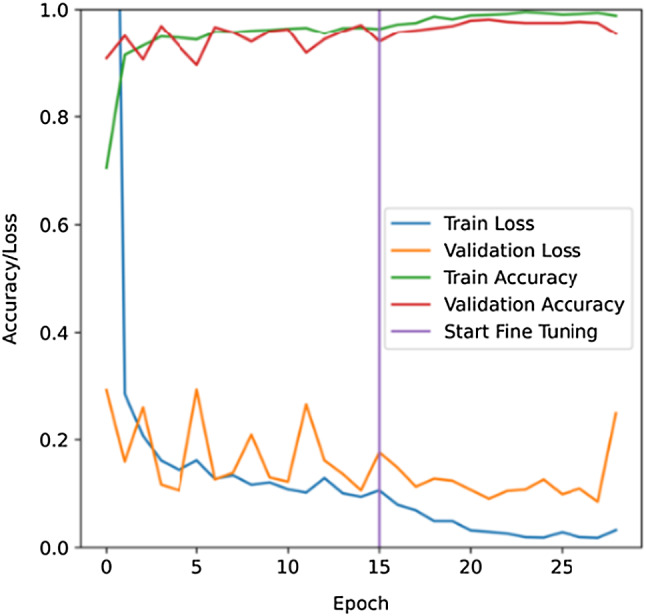
Learning curves of the training and testing process. Validation using Grad-CAM for a visual explanation
Visualization
To improve the reliability of the proposed model, it is crucial to associate the classification results with clinical symptoms/evidences. Grad-CAM algorithm computes a heat-map that highlights the important regions in the X-ray images that contributed to the classification. The heat-map contains intensity values that correspond to the importance of that particular pixels. Higher intensity indicates higher importance to the result. The highlighted region produced by the Grad-CAM algorithm corresponds to the potentially infected region as shown in Fig. 7.
Fig. 7.

(Column 1) Original X-ray images marked by a radiologist (Column 2) Color-coded heatmap generated by Grad-CAM algorithm (Column 3) Heatmap overlaid on the extracted original image (Column 4) Intensity values of the heatmap generated by Grad-CAM algorithm
To validate the credibility of the model, five (5) COVID-19 chest X-ray images (Fig. 7, Column 1) were collected from trusted source (Narayan Das et al. 2020) and compared with the Grad-CAM generated heatmap overlaid chest X-ray images (Fig. 7, Column 3). These 5 images exhibit different regions of the infected area to prove that the model inference results are not biased. The region that displayed specific signs of COVID-19 (ROI) was marked by a board-certified radiologist (Fig. 7, Column 1). All 5 images were predicted as COVID-19 by the proposed model. The weights and node values that contributed to these 5 inference results are analyzed by the Grad-CAM algorithm and heatmaps (Fig. 7, Column 4) are computed from these inferences. The heatmap intensity is converted into color-coded by matching yellow bring the highest intensity and blue being the lowest intensity (Fig. 7, Column 2). The color-coded heatmaps are then overlaid onto the cropped-out chest X-ray (Fig. 7, Column 3).
The model correctly considers the lungs area as indicators of COVID-19 in Fig. 7. The highlighted regions in the heatmap that have relatively higher intensity values (yellow) mostly fall within the lungs region. Even though not all marked regions by the radiologist are highlighted in the heatmap, the region that has the highest intensity value coincides with the region marked by the radiologist. The model is able to identify the affected area in the lungs effectively and make predictions accordingly. This is because the final classification result could be derived based on one problematic area, indicating that to identify all affected areas is not necessary for an accurate COVID-19 diagnosis.
Edge implementation
Two different devices are considered to evaluate the performance and efficiency trade-offs. The first experiment is conducted on Google Colab with a single-core Intel® Xeon® CPU @ 2.20 GHz and 12.72 GB RAM. The second one is a Raspberry Pi 4 with SoC Broadcom BCM2711 Quad-Core Cortex A-72 @ 2.5 GHz and 4 GB SDRAM. The NCS2 is connected to Raspberry Pi 4 to illustrate the edge device.
To evaluate the performance of the model on different devices, the same test set is utilized in calculating the average frame per second (FPS), average inference time, and the final accuracy. The original developed model’s size is also compared with the optimized model’s size. The comparisons are shown in Figs. 8 and 9.
Fig. 8.

Performance comparison in terms of inference time, frame per second, and accuracy
Fig. 9.

Comparison in terms of model's size
As illustrated in Fig. 8, it takes 1.85 s on average to classify a single X-ray image on the CPU. On the other hand, the NCS2 has an average inference time of approximately 0.2 s. The optimized model on NCS2 demonstrates an increased performance by a factor of 9.25 times in terms of inference time. It also shows significant improvement in terms of average frame per second (FPS). The average FPS on NCS2 is 5, which is almost 10 times of the CPU. As depicted in Fig. 9 the optimized model has a total size of approximately 214 MB (694 KB.xml file + 213 MB.bin file). The model in CPU, which is stored in the file format of HDF5, has a size of 430 MB, which is double the size of the optimized model.
The accuracy is reduced from 98.13 to 93.96%. However, a significant improvement can be observed from the average inference speed, average FPS, and model size. The inference speed and FPS have an improvement of 90%, and the model’s size is reduced by 50%. The experiments show that the optimized model has a smaller size and faster inference time with slightly reduced accuracy. It displays the potential of the model to be deployed on the edge as it has a good trade-off between efficiency and performance on tightly constrained platforms. Such characteristics are ideal for primary and rural clinics as the model can be employed without the need to invest in higher computing machines. The edge system is an optimal solution for clinics that do not have access to internet connections. It will enable primary and rural clinics to predict expected COVID-19 cases from chest X-ray images.
Performance evaluation
Few studies have developed chest X-ray analysis for the classification of COVID-19 using deep learning. Heidari et al. (2020) developed a computer-aided scheme of chest X-ray images to detect COVID-19 and pneumonia disease. The study utilized the VGG-16 to classify the images into 3 classes. Their model had an overall accuracy of 93.9% in 3-classes classification. Wang et al. (2021) developed a method based on deep learning to identify COVID-19 from community-acquired pneumonia (CAP). Two models were developed. Their method was able to yield an accuracy of 98.7% for the first model, and an accuracy of 93.0% for the second model. Das et al. (2021) used a transfer learning approach to classify chest X-ray images into 3 classes, namely: COVID-19, pneumonia and no infection. Their best performing model was based on VGG16 and had an accuracy of 97.7%, precision of 96.7%, recall of 96.5%, and F1 score of 96.6%. Karakanis and Leontidis (2021) aimed to generate synthetic chest X-ray images using the concept of conditional generated adversarial networks (cGANs). The model had 98.3% accuracy, 99.3% sensitivity, and 98.1% specificity for multi-class prediction. This research also used interpretable AI to visualize the areas that contributed to the model’s decision. Rajpal et al. (2021) explored the use of transfer learning using the base model of ResNet-50 to perform multiclass classification involving 3 classes as well: COVID-19, pneumonia, and normal/healthy cases. The model had an overall accuracy of 97.4%. Ismael and Şengür (2021) used ResNet50 model also to perform feature extraction, along with the SVM classifier Linear kernel function to perform binary classification of COVID-19 and healthy X-ray images. This model produced an accuracy of 94.7%. Umer et al. (2021) developed a CNN approach to detect COVID-19 cases with 97% accuracy for 2-classes classification.
Recently, researchers also develop an application for COVID-19 prediction on edge devices. Shen et al. (2022) developed a method to detect COVID-19 from Chest X-ray(CXR) images using ResNet18 as a feature extractor with discrete social learning particle swarm optimization algorithm (DSLPSO) as the feature selections and Support Vector Machine (SVM) to classify the images into COVID-19, pneumonia and no infection classes. It is reported the method has 95.86% accuracy. They however do not report which edge devices used in their experiment. Laxmi Lydia et al. (2021) developed a federated deep learning-based COVID-19 (FDL-COVID) detection model on edge computing environment. The method was based on SqueezeNet architecture. The edge devices uploaded the images into the cloud which was then performed federated learning to develop the global cloud model. The model was used to classify CXR images into COVID-19, pneumonia and no infection classes. It was reported that the average accuracy was 0.97. Rangarajan and Ramachandran (2021) developed an application of deep learning models on smart-phone. They used and tested five CNN models namely VGG16, MobileNetV2, Xception, NASNetMobile and InceptionResNetV2. It was reported that VGG16 and Xception performed better in a smartphone. The validation accuracy of those models were 98.6% and 98.1% respectively.
From the literature, we found that the results of our proposed model are comparable with other reported models which have accuracy ranging from 93.9% to 98.7%. Especially for works on edge devices, our models which have 98.13% accuracy are better than most of the reported works. In addition to that, the credibility of our model has been verified by the addition of the interpretability function. Furthermore, the proposed model is able to be implemented at the edge, where computing resources are scarce and limited without sacrificing much of the accuracy in exchange for accelerated inference speed. This is a relatively good trade-off in performance. With the implementation of the model on the edge, the system has demonstrated its potential for real-world application.
Conclusion
Due to the current COVID-19 pandemic and the limitations of the diagnosis method, deep learning-based method can be adopted as an alternative tool for detecting COVID-19. The deep learning models generally, however, require high computational resources which are not suitable for deployment in primary care clinics in cities and rural areas. As these areas may have limited internet access, a cloud-based approach is also not preferred.
To solve these challenges, in this work,
We developed a deep learning model which can classify and predict COVID-19 and pneumonia disease using chest X-ray images that can run on edge devices.
Transfer learning techniques are employed to resolve the issue of having an inadequate dataset. The proposed model is trained with 1905 X-ray images and evaluated with 480 images and has an accuracy of 98.13%, sensitivity of 97.7%, and specificity of 99.1% for 3-class prediction. The proposed model is deployed on a Raspberry Pi 4 and NCS2, which can consider as an edge device. Results show that there is a significant improvement in terms of inference speed (0.2 s) and frame per second (5 FPS), reduction in size of the model (214 MB), and a slight reduction in accuracy (93.96%).
-
2.
We also developed a visual interpretation of the classification results by applying Grad-CAM to the model.
Grad-CAM localization is applied to provide transparency and interpretability of the results. The generated heatmap highlights the important region in the input image that the model identified as discriminating for COVID-19. The highlighted areas are compared to annotated X-ray images that were marked by a board-certified radiologist and are found to be correlated with clinical findings.
It is shown that the proposed method has the potential to act as assistive intelligence to medical practitioners. As part of future work, the model can be trained and evaluated with more datasets of COVID-19 to improve its robustness and accuracy.
Acknowledgements
The authors would like to thank Mr. Ewe Kok Howg and Mr. Ho Nee Shen from Intel Malaysia who provided us with Intel Neural Compute Stick 2. We would also like to thank the Department of Electrical and Electronic Engineering, University of Nottingham Malaysia for making this project possible.
Declarations
Competing interest
The authors declare no conflict of interest. The funding agency had no role in the design of the study; in the collection, analyses, or interpretation of data; in the writing of the manuscript, or in the decision to publish the results”.
References
- Ai T et al (2020) Correlation of Chest CT and RT-PCR testing for coronavirus disease 2019 (COVID-19) in China: a report of 1014 cases. Radiology 296(2). 10.1148/radiol.2020200642 [DOI] [PMC free article] [PubMed]
- Alakwaa W, Nassef M, Badr A. Lung cancer detection and classification with 3D convolutional neural network (3D-CNN) Int J Biol Biomed Eng. 2017;11:66–73. [Google Scholar]
- Ariff KM, Teng CL. Rural health care in Malaysia. Austral J Rural Health. 2002;10(2):99–103. doi: 10.1111/j.1440-1584.2002.tb00017.x. [DOI] [PubMed] [Google Scholar]
- Chowdhury MEH, et al. Can AI help in screening viral and COVID-19 pneumonia? IEEE Access. 2020;8:132665–132676. doi: 10.1109/ACCESS.2020.3010287. [DOI] [Google Scholar]
- Chowdhury NK, Kabir MA, Rahman MM, Rezoana N. ECOVNet: a highly effective ensemble based deep learning model for detecting COVID-19. PeerJ Comput Sci. 2021;8:e551. doi: 10.7717/peerj-cs.551. [DOI] [PMC free article] [PubMed] [Google Scholar]
- Cohen JP, Morrison P, Dao L (2020) COVID-19 Image Data Collection: Prospective Predictions Are the Future Joseph Paul Cohen and Paul Morrison and Lan Dao and Karsten Roth and Tim Q Duong and Marzyeh Ghassemi. https://github.com/ieee8023/covid-chestxray-dataset
- Das AK, Kalam S, Kumar C, Sinha D. TLCoV- An automated Covid-19 screening model using Transfer Learning from chest X-ray images. Chaos Solitons Fractals. 2021;144:110713. doi: 10.1016/j.chaos.2021.110713. [DOI] [PMC free article] [PubMed] [Google Scholar]
- Deng J, Dong W, Socher R, Li L-J, Li K, Fei-Fei L (2010) ImageNet: a large-scale hierarchical image database. Proceeding in: 2009 IEEE Conference on Computer Vision and Pattern Recognition 20–25. 10.1109/CVPR.2009.5206848
- Elsheikh AH, Saba AI, Panchal H, Shanmugan S, Alsaleh NA, Ahmadein M. Artificial intelligence for forecasting the prevalence of covid-19 pandemic: an overview. Healthcare (switzerland) 2021;9(12):1614. doi: 10.3390/healthcare9121614. [DOI] [PMC free article] [PubMed] [Google Scholar]
- Falcon DJ. The Health Care Gap in Rural Malaysia. New Malays. 2019;37(6):1–2019. [Google Scholar]
- Fang Y et al (2020) Sensitivity of chest CT for COVID-19: comparison to RT-PCR. Radiology 296(2). 10.1148/radiol.2020200432 [DOI] [PMC free article] [PubMed]
- Farooq A, Anwar S, Awais M, Rehman S (2017) A deep CNN based multi-class classification of Alzheimer’s disease using MRI. In: IST 2017—IEEE International Conference on imaging systems and techniques, Proceedings, 2017. 10.1109/IST.2017.8261460
- He J, Guo Y, Mao R, Zhang J. Proportion of asymptomatic coronavirus disease 2019: A systematic review and meta-analysis. J Med Virol. 2020 doi: 10.1002/jmv.26326,Jul. [DOI] [PMC free article] [PubMed] [Google Scholar]
- Heidari M, Mirniaharikandehei S, Khuzani AZ, Danala G, Qiu Y, Zheng B (2020) Improving performance of CNN to predict likelihood of COVID-19 using chest X-ray images with preprocessing algorithms. arXiv [DOI] [PMC free article] [PubMed]
- Intel Corporation (2022) “OpenVino Overview”. https://docs.openvino.ai/latest/index.html. Accesed on 10 Sep 2021
- Ismael AM, Şengür A. Deep learning approaches for COVID-19 detection based on chest X-ray images. Expert Syst Appl. 2020;164(September 2020):114054. doi: 10.1016/j.eswa.2020.114054. [DOI] [PMC free article] [PubMed] [Google Scholar]
- Karakanis S, Leontidis G. Lightweight deep learning models for detecting COVID-19 from chest X-ray images. Comput Biol Med. 2021;130(September 2020):104181. doi: 10.1016/j.compbiomed.2020.104181. [DOI] [PMC free article] [PubMed] [Google Scholar]
- Karthik R, Menaka R, Hariharan M. Learning distinctive filters for COVID-19 detection from chest X-ray using shuffled residual CNN. Appl Soft Comput. 2021;99:106744. doi: 10.1016/j.asoc.2020.106744. [DOI] [PMC free article] [PubMed] [Google Scholar]
- Kayalıbay B, Jensen G, van der Smagt P (2017) CNN-based segmentation of medical imaging data. arXiv
- Kermany D (2018) Labeled optical coherence tomography (OCT) and chest X-ray images for classification. Mendeley Data. 10.17632/rscbjbr9sj.2. Accessed on 10 June 2020
- Laxmi Lydia E, Anupama CSS, Beno A, Elhoseny M, Alshehri MD, Selim MM. Cognitive computing-based COVID-19 detection on Internet of things-enabled edge computing environment. Soft Comput. 2021;6:1–12. doi: 10.1007/s00500-021-06514-6. [DOI] [PMC free article] [PubMed] [Google Scholar]
- Liang Z et al (2017) CNN-based image analysis for malaria diagnosis. In: Proceedings—2016 IEEE International Conference on Bioinformatics and Biomedicine, BIBM 2016, 2017. 10.1109/BIBM.2016.7822567
- Misra A. Deep learning acceleration on the edge. Trinity College: The University of Dublin; 2019. [Google Scholar]
- Narayan Das N, Kumar N, Kaur M, Kumar V, Singh D. Automated deep transfer learning-based approach for detection of COVID-19 infection in chest X-rays. Irbm. 2020;1:1–6. doi: 10.1016/j.irbm.2020.07.001. [DOI] [PMC free article] [PubMed] [Google Scholar]
- Nogee D, Tomassoni AJ. Covid-19 and the N95 respirator shortage: closing the gap. Infect Control Hosp Epidemiol. 2020;41(8):958. doi: 10.1017/ice.2020.124. [DOI] [PMC free article] [PubMed] [Google Scholar]
- Pan SJ, Yang Q. A survey on transfer learning. IEEE Trans Knowl Data Eng. 2010;22(10):1345–1359. doi: 10.1109/TKDE.2009.191. [DOI] [Google Scholar]
- Pham QV, Nguyen DC, Huynh-The T, Hwang WJ, Pathirana PN. Artificial intelligence (AI) and big data for coronavirus (COVID-19) pandemic: a survey on the state-of-the-arts. IEEE Access. 2020;8:130820–130839. doi: 10.1109/ACCESS.2020.3009328. [DOI] [PMC free article] [PubMed] [Google Scholar]
- Rahman T et al (2020) Exploring the effect of image enhancement techniques on COVID‐19 detection using chest X‐rays images. ComputBiol Med 132:104319 [DOI] [PMC free article] [PubMed]
- Rajpal S, Lakhyani N, Singh AK, Kohli R, Kumar N. Using handpicked features in conjunction with ResNet-50 for improved detection of COVID-19 from chest X-ray images. Chaos Solitons Fractals. 2021;145:110749. doi: 10.1016/j.chaos.2021.110749. [DOI] [PMC free article] [PubMed] [Google Scholar]
- Rangarajan AK, Ramachandran HK. A preliminary analysis of AI based smartphone application for diagnosis of COVID-19 using chest X-ray images. Expert Syst Appl. 2021;183:115401. doi: 10.1016/j.eswa.2021.115401. [DOI] [PMC free article] [PubMed] [Google Scholar]
- Rendón E, Alejo R, Castorena C, Isidro-Ortega FJ, Granda-Gutiérrez EE. Data sampling methods to deal with the big data multi-class imbalance problem. Appl Sci. 2020;10(4):1276. doi: 10.3390/app10041276. [DOI] [Google Scholar]
- Selvaraju RR, Cogswell M, Das A, Vedantam R, Parikh D, Batra D (2020) Grad-CAM: visual explanations from deep networks via gradient-based localization. IEEE Int J Comput Vis (ICCV) 2017:618–626
- Shen C, Zhang K, Tang J. A COVID-19 detection algorithm using deep features and discrete social learning particle swarm optimization for edge computing devices. ACM Trans Internet Technol. 2022;22(3):1–17. doi: 10.1145/3453170. [DOI] [Google Scholar]
- Shereen MA, Khan S, Kazmi A, Bashir N, Siddique R. COVID-19 infection: origin, transmission, and characteristics of human coronaviruses. J Adv Res. 2020;24:94–98. doi: 10.1016/j.jare.2020.03.005. [DOI] [PMC free article] [PubMed] [Google Scholar]
- Sufian A, Ghosh A, Sadiq AS, Smarandache F. A survey on deep transfer learning to edge computing for mitigating the COVID-19 pandemic: DTL-EC. J Syst Archit. 2020;108(June):101830. doi: 10.1016/j.sysarc.2020.101830. [DOI] [Google Scholar]
- Szegedy C, Ioffe S, Vanhoucke V, Alemi AA (2017) Inception-v4, inception-ResNet and the impact of residual connections on learning. In: 31st AAAI Conference on Artificial Intelligence, AAAI pp 4278–4284
- Umer M, Ashraf I, Ullah S, Mehmood A, Choi GS. COVINet: a convolutional neural network approach for predicting COVID-19 from chest X-ray images. J Ambient Intell Humaniz Comput. 2021;13(2020):535–547. doi: 10.1007/s12652-021-02917-3. [DOI] [PMC free article] [PubMed] [Google Scholar]
- Victor A, Ghalib MR. Automatic detection and classification of skin cancer. Int J Intell Eng Syst. 2017;10:444–451. [Google Scholar]
- Wang X, Han Y, Leung VCM, Niyato D, Yan X, Chen X. Convergence of edge computing and deep learning: a comprehensive survey. IEEE Commun Surv Tutor. 2020;22(2):869–904. doi: 10.1109/COMST.2020.2970550. [DOI] [Google Scholar]
- Wang Z, et al. Automatically discriminating and localizing COVID-19 from community-acquired pneumonia on chest X-rays. Pattern Recognit. 2021;110:107613. doi: 10.1016/j.patcog.2020.107613. [DOI] [PMC free article] [PubMed] [Google Scholar]
- WHO (2021) WHO Coronavirus (COVID-19) Dashboards. WHO Coronavirus (COVID-19), 2021. [Online]. Available: https://covid19.who.int/. Accessed 2 Nov 2021