

Abstract
The remarkable growth of multi-platform genomic profiles has led to the challenge of multiomics data integration. In this study, we present a novel network-based multiomics clustering founded on the Wasserstein distance from optimal mass transport. This distance has many important geometric properties making it a suitable choice for application in machine learning and clustering. Our proposed method of aggregating multiomics and Wasserstein distance clustering (aWCluster) is applied to breast carcinoma as well as bladder carcinoma, colorectal adenocarcinoma, renal carcinoma, lung non-small cell adenocarcinoma, and endometrial carcinoma from The Cancer Genome Atlas project. Subtypes were characterized by the concordant effect of mRNA expression, DNA copy number alteration, and DNA methylation of genes and their neighbors in the interaction network. aWCluster successfully clusters all cancer types into classes with significantly different survival rates. Also, a gene ontology enrichment analysis of significant genes in the low survival subgroup of breast cancer leads to the well-known phenomenon of tumor hypoxia and the transcription factor ETS1 whose expression is induced by hypoxia. We believe aWCluster has the potential to discover novel subtypes and biomarkers by accentuating the genes that have concordant multiomics measurements in their interaction network, which are challenging to find without the network inference or with single omics analysis.
Index Terms: aWCluster, multiomics integration, cancer network, wasserstein distance, clustering
1. Introduction
THE molecular development of neoplasms occurs at a number of genomic, transcriptomic and epigenomic scales. The aggregation of multi-dimensional omics data potentially provides a comprehensive view of the etiology of oncogenesis and tumor progression at different molecular levels. Large scale cancer genome projects, such as The Cancer Genome Atlas (TCGA) project include an unprecedented amount of multi-dimensional data to explore the entire spectrum of genomic abnormalities in human cancer [1]. With the exponential growth of such data, the great need to obtain an integrated view of multiomics interplay is becoming ever more pressing.
Many sophisticated mathematical and statistical algorithms of multiomics clustering have been proposed, yet the need for more effective techniques to improve the clinical outcome prediction remains a challenge [2]. The mutiomics integrative methods could be primarily classified into two categories of early and late integration. A late integration approach considers clustering each single omic data separately, then finding the consensus of these clusterings [3], [4], [5], [6]. Such methods could result in loss of information from signals that are weak in each omic and they do not consider the interplay of different omic layers. A more appealing integration focuses on building a model for an earlier integration of multiomics followed by a single clustering of the samples. This approach includes network-based methods such as similarity network fusion (SNF) [7], Lemon-Tree for module network inference [8] and, PARADIGM [9] as well as matrix factorization methods such as non-negative matrix factorization (NMF) [10], [11] and iCluster [12]. The ongoing effort of multiomics integration have been successfully applied in cancer research for the identification of cancer patients subtypes and tumor molecular pattern [13], [14], [15], [16].
Our method of aggregating multiomics and Wasserstein distance clustering (aWCluster) considers a network-based integration of multiomics in early stage. The aWCluster integration approach regards the gene expression of any transcript as a biological function of the gene copy number alteration and DNA methylation which can also be modulated in any level by the other genes (gene products) in their protein-protein interaction (PPI) network. Therefore, using the clustering approach of aWCluster considers the PPI network of genes in representing the functional concordance of the multiomics in their interaction network.
Amplification of oncogenes and deletion of tumor suppressors give rise to malignant neoplasms [17]. Furthermore, epigenetic aberrations caused by DNA methylation has a central role in tumor progression [18]. Consequently, aWCluster’s approach for combining the values of copy number alteration and DNA methylation with gene expression in a network-based manner significantly improves the accuracy in characterizing the genes that have an essential role in cancer progression. Our method of integration in aWCluster is akin to CNAmet in aggregating the copy number, methylation, and gene expression data [19]. However, CNAmet does not consider the protein interaction network, clustering of samples and it only focuses on binary values of multiomics which could have sensitive dependency on thresholds.
In order to include the protein interaction network in aWCluster, we consider the weighted network for each sample as the result of an underlying stochastic process that is driven by interactions among connected nodes. For each sample, we construct a distribution of integrative measures across the nodes of the network, which is closely related to the invariant (stationary) measures of an associated Markov chain. We employ these integrative measures to cluster six cancer types from TCGA data. Our clustering method in aWCluster is based on optimal mass transport (OMT) methods, utilizing the 1-Wasserstein distance [20], also known as Earth Mover’s Distance (EMD), applied to the invariant distributions of integrative measures computed between samples [21]. We defined the cost of calculating the Wasserstein distance based on the shortest path between the genes in the (unweighted) PPI network. Using the Wasserstein distance is not only a very natural way to define the distance between distributions (assigned to samples) but also results in a network-based distance for clustering the data.
The invariant measure of the Markov chain considered in this work has an explicit closed formula which makes our method more efficient and interpretable than the spectral clustering methods used in other integrative methods such as SNF [7]. Also, our network-based method is quite different from the sample similarity approach in the iterative model of SNF; SNF does not consider the protein interaction network nor the mechanistic interplay of multiomics layers. The difficulty of interpretability also occurs with the latent variables in matrix factorization methods such as NMF and iCluster [12]. Using the proposed aWCluster methodology, we are able to identify the significant genes in the breast cancer cluster with a significantly low survival rate. We further perform gene ontology (GO) enrichment analysis on these genes utilizing a curated bioinformatics database (MetaCore) to discover the significantly correlated biological processes/pathways that could be related to the high mortality in this cluster. Consequently, an effective bridge between the biology of cancer and mathematical techniques can bring about a comprehensive, meaningful and predictive model of multiomics integration with identification of biomarkers for cancer treatment.
We primarily applied aWCluster for subtype analysis and biomarker identification in breast cancer. For validation purposes, we also utilized aWCluster for survival analysis in bladder urothelial carcinoma, colorectal adenocarcinoma, renal clear cell carcinoma, lung non-small cell adenocarcinoma, and endometrial carcinoma. Our breast cancer clustering result is concordant with well-known PAM50 subtypes, however, it provides additional heterogeneity within and across the subtypes. aWCluster is significantly effective in predicting survival rates in all cancer types and it facilitates the identification of the important driver genes in each cluster, which in turn may allow researchers to glean new therapeutic approaches from the results.
2. Materials and Methods
We adopted methods from OMT [20], [22] to measure the similarity of the integrative multiomics profiles between samples. To this end, we calculated the 1-Wasserstein distance between the probability distributions of the integrative measures assigned to the samples. More precisely, we first derived the integrative measures from the invariant measures of the stochastic matrix associated with the PPI network (Fig. 1). The integrative measures aggregate the gene expression, copy number alteration and methylation in a network-based fashion. We then utilized the Wasserstein distance to measure the similarity between every pair of distributions (π*) of integrative measures assigned to every two samples (Fig. 2). Consequently, we applied these pair-wise Wasserstein distances to perform the hierarchical clustering of the samples. In the following section, we first discuss our integration method in aWCluster, then we review the clustering of samples via 1-Wasserstein distance using the protein interaction network. In fact, the interaction network has been utilized in both integrating multiomics and calculating the Wasserstein distances for the clustering purposes.
Fig. 1.

Workflow of aWCluster’s methodology: A. Network-based integration of multiomics (mRNA expression, DNA methylation and copy number alteration) uses the PPI network (HPRD) to define the sample specific integrative measures. Integrative measures is defined for each gene (of a specific sample) and is measuring the concordance of all three multiomics of the gene and its neighbors in the interaction network. B. Network-based clustering of the samples by applying Wasserstein distance to the integrative measures where the cost is the shortest path in the PPI network. Hierarchical clustering has been applied to the samples which are represented as a vector of their distances to all others. C. The clustering is used for clinical outcome analysis such as survival rate and also GO enrichment analysis for discovering biomarkers associated with each subtype.
Fig. 2.

The integration of multiomics in aWCluster is network-based. We assigned an integrative measure to the nodes of the interaction network using the network connectivity and the values of gene expression, copy number alteration and methylation. The integrative measures define a weighted network for each sample. Wasserstein distance calculates the most efficient way to move the distribution of integrative measure from one sample to another sample where the cost is the shortest path in the network. Here, we only show a small network for the purpose of illustration.
2.1. Constructing Sample Specific Integrative Measures
We applied our method to integrate the multiomics data of TCGA breast carcinoma. The integrative measure is defined via the mRNA expression (z-score of RNA Seq), copy number alteration and methylation data of TCGA, and the PPI network from the Human Protein Reference Database (HPRD, http://www.hprd.org) [23]. The breast cancer TCGA data consists of mRNA expression of 18,022 genes for 1,100 cases, copy number values of 15,213 genes for 1,080 cases and methylation of 15,585 genes in 741 cases. The intersection of all three data resulted in 7,737 genes and 726 samples. Moreover, this gene set has 3,426 genes in common with HPRD in the largest connected component. Subsequently, we applied aWCluster to aggregate all the three multiomics of 3,426 genes using their connected interaction network to cluster 726 samples. We further considered making the method computationally less expensive by limiting the genes with the ones only in common with OncoKB (Precision Oncology Knowledge Base) genes (http://oncokb.org/) which is discussed extensively in the Supplementary Information, which can be found on the Computer Society Digital Library at http://doi.ieeecomputersociety.org/10.1109/TCBB.2020.3039511. Similarly, the intersection of three data types results in 8031 genes (311 in HPRD/ OncoKB) and 116 samples for bladder urothelial carcinoma, 9646 genes (535 in HPRD/OncoKB) and 195 samples for colorectal adenocarcinoma, 1399 genes (154 in HPRD/OncoKB) and 80 samples for renal clear cell carcinoma, 12936 genes (542 in HPRD OncoKB) and 416 samples for lung cancer, and 1426 genes (305 in HPRD) and 108 samples for endometrial carcinoma.
A given gene interaction network such as HPRD provides an unweighted graph where nodes are genes and edges represent the interaction among genes. We further constructed a weighted graph by considering the gene interaction network as a Markov chain [21]. Consider a gene i and its neighbor genes j ∈ N(i) in their interaction network (here in HPRD) for a given sample. Let gek denote the expression level of gene k in a given sample. The principle of mass action allows us to compute the probability of the interaction of gene i to gene j (pij) to be proportional to their expression, i.e., pij ∞ (gei)(gej)[24]. By normalizing pij such that ∑jipij = 1, we have the stochastic matrix p of the Markov chain associated to the network as follows:
| (1) |
The Markov chain given by Eq. (1) reaches a stationary distribution which is invariant under a right multiplication by p, i.e., πp = π, [21]. Solving for the special stochastic matrix p defined by Eq. (1), π has the explicit expression- for every gene i in the network we have:
| (2) |
where Z is a normalization factor forcing π to be a probability distribution (∑π = 1). Note that this normalization is necessary since we want to consider the invariant measure to be a probability distribution over all genes for each specific sample. The invariant measure defined by Eq. (2), gives a value to each gene which is not only dependent on the expression of the gene i, but also on the expressions of its neighboring genes j ∈ N(i).
We have extended this invariant measure to the integrative measure in order to consider copy number alteration and methylation in addition to gene expression. Our approach roughly follows that of CNAmet [19], however, our method is network based. We characterize the genes that are up-regulated with high expression, amplification and hypomethylation, and also have many connections with similarly up-regulated genes in their interaction network. Correspondingly, the integrative measures identified genes that are down-regulated with low expression, deletion and hypermethylation within their interaction network. In fact, for TCGA data, the Spearman’s correlations between the gene expression and the copy number alteration across the samples are mostly significantly positive (see Fig. S3 of Supplementary Information, available online). Similarly, positive correlations exist between gene expression and 1—methylation (one minus methylation). Therefore, we considered the values of 1—methylation (which are positive as methylation values are between 0 and 1) to calculate the integrative measures in Eq. (4). In CNAmet, the gene expression (mean across all samples) values have been multiplied by binary values assigned to copy number and methylation. In the proposed aWCluster method, we utilized the actual normalized values of copy number and methylation in the integrative measures assigned to samples.
In order to define the integrative measure of gene i in the PPI network, we first consider the invariant measure (Eq. (2)) for each of the single omics:
| (3) |
where ξ is any of the ge, cn, and me (which stands for gene expression, copy number, and methylation respectively). Consequently, we define the network integrative measure (for gene i) as follows:
| (4) |
Here, the scaling factor ϵi is defined based on the normalized methylation and copy number alteration of gene i and its neighbors in the network:
| (5) |
where di is the node degree of the gene i in the interaction network.
In integrative measure formulation (Eq. (4)), the multiplication of omics’ invariants measures capture the network-based concordance of gene expression with methylation and copy number alteration. In addition, the scaling factor ϵ [19], accounts for the concordance of copy number alteration and methylation.
For each sample, we calculated the vector for all the genes in our data sets. We also added the normalization factor Z in Eq. (4) so that integrative measure of each sample forms a probability distribution. We finally applied methods from OMT [20] to find the distance between a pair of vectors of the form π* (Fig. 2) assigned to every two samples. In fact, we measured the similarity between samples by finding the Wasserstein distance between the distributions of the integrative measures assigned to them, which we define in more detail in the following section.
Here, we also present an alternative closed form formula for an integrative measure which is convenient for implementing. Let Adj denote the adjacency matrix of our network, i. e., the n × n matrix whose (i, j)entry is 1 if there is an edge (interaction) connecting node (gene) i and node j, and 0 otherwise. The vector π* of integrative measures for a specific sample is defined as follows:
| (6) |
where
| (7) |
and
| (8) |
In these expressions, ○ denotes the component-wise (Hadamard) product, whereas × is the standard matrix multiplication. Also, d is the vector of all node degrees, 1 is all-ones vector, and is the n × n identity matrix. Here, every row of the matrix is divided by the corresponding component of d + 1.
2.2. Clustering via Wasserstein Distance
aWCluster uses the theory of OMT to define distances among samples. OMT is a rapidly developing area of research that deals with the geometry of probability densities [20]. The subject began with the work of Gaspard Monge in 1781 [25] who formulated the problem of finding minimal transportation cost to move a pile of soil (“deblais”), with mass density ρ0, to an excavation (“remblais”), with a mass density ρ1. A relaxed version of the problem was introduced by Leonid Kantorovich in 1942 [26]. Let ρ0; ρ1 ∈ P(Ω) where and . The 1-Wasserstein distance, also known as the Earth Mover’s Distance (EMD), is defined as follows:
| (9) |
where Γ(ρ0, ρ1) denotes the set of all couplings between ρ0 and ρ1, that is the set of all joint probability measures γ on Ω × Ω whose marginals are ρ0 and ρ1. Here, the cost function of the transportation is defined as the ground distance .
This optimization problem has an analogous formulation on a weighted graph (network). Let us consider a connected undirected graph with n nodes in and m edges in . Given two probability densities ρ0, on the graph, the EMD problem seeks a joint distribution with marginals ρ0 and ρ1 minimizing the total cost :
| (10) |
Here cij is the cost of moving unit mass from node i to node j and is taken to be the minimum of the number of steps (unweighted shortest path) to go from i to j, namely, c is the ground metric on the graph. The minimum of this optimization problem defines a metric W1 (the Earth Mover’s Distance) on the space of probability densities on . Note that this optimization problem consists of n2 variables.
An alternative and computationally more efficient formulation of the EMD (often called the Beckmann formulation [27]) is defined by optimizing the flux vector m : in the following manner:
| (11) |
where is the standard euclidean distance based norm.
A graph-theoretic formulation of Eq. (11) is as follows which gives an alternative way to compute the EMD on the graph :
| (12) |
On the graph , the fluxes ui are defined on the m edges, and denotes the incidence matrix of with an assigned orientation. More precisely, the incidence matrix D is a matrix with rows and columns indexed by the vertices and edges of G such that every entry (i, k) is equal to 1 if the vertex i is assigned to be the head of the edge k and is equal to −1 if it is the tail of k. Very importantly, note that the optimization problem in Eq. (12) depends on m variables, while the primal node based version of OMT on a graph in Eq. (10) depends on n × n variables. Thus formula in Eq. (12) is certainly much more efficient especially when the graph is sparse, that is, m < < n2.
aWCluster is implemented in MATLAB and the code including a sample data set is publicly available in http://github.com/mpouryah/aWCluster. For implementations of Wasserstein distance in low dimensional data (< 1000 nodes in network) we used the Rubner’s algorithm [28], and for larger networks (> 1000 nodes) we applied CVX package [29] to solve the optimization problem in Eq. (11). The average computational time required to compute distance between two samples on a single CPU is 68 seconds for a network of 290 genes via Rubner’s algorithm and is 278 seconds for a network of 3426 genes via CVX algorithm. After calculating the pairwise EMD of samples in the dataset, each sample is represented as a vector of its distances to all other samples (its distance to itself is zero). We then applied the hierarchical agglomerative clustering algorithm to these vectors. To achieve a certain number of clusters, the hierarchy is cutoff at the relevant depth. The optimal number of clusters can be determined with several techniques. In the present work, we chose the optimal number of cluster based on the homogeneity of clusters measured by silhouette mean values [30]. The silhouette value for each sample is a measure of how similar that sample is to other samples in its own cluster compared to samples in other clusters. The silhouette value for the sample i, s(i) is defined as:
| (13) |
where a(i) denotes the average distance of the sample i to all samples within its own cluster (squared euclidean distance between sample vectors), and b(i) denotes the minimum average distance of the sample i to samples of other clusters. Silhouette values range from −1 to +1. A high silhouette value indicates that the data are appropriately clustered. Therefore, we chose the optimal number of clusters by analyzing the average silhouette values of samples to make sure they stay close to 1.
We also compared the survival analysis in aWCluster to alternative multiomics clustering methods of iCluster [12], SNF [7], and CNAmet [19]. As we discussed earlier, the network-based approach in SNF is quite different from aWCluster and it considers the sample similarity network rather than the gene interaction network. CNAmet primarily focuses on the integration step and lets users define their own method to cluster the samples. Here, we used CNAmet’s combination score (methylation and copy number) multiplied with gene expression of samples to perform the hierarchical clustering. We also compared our breast cancer clustering results with the well-known PAM50 molecular subtypes of breast cancer (Luminal A, Luminal B, HER2-enriched, Basal-like, and Normal-like), which were first described in 2000 by Perou et al. [31], [32], [33]. This classification begins with the analysis of microarray expressions of 50 genes (known as the “PAM50” gene signatures) to cluster breast tumors into one of the subtypes. The results of these comparison is discussed further in the following section.
3. Results
We primarily applied aWCluster to TCGA breast cancer data consisting of 3,426 genes and 726 samples. The hierarchical clustering of 726 samples of TCGA breast cancer via aWCluster is shown in Fig. 3a. The Kaplan-Meier plot of the clusters’ survival rate is illustrated in Fig. 3b. The data has been truncated at 5 years, i.e., patients’ status is considered to be living (censoring) if the death is after 5 year follow-up. The log-rank test indicates a significantly different survival time between the four Kaplan-Meier curves (p-value=0.0018). The number of clusters is chosen based on the silhouette values we discussed previously in the ‘Materials and Methods‘ section. Here, choosing three or four clusters had a very small effect on the silhouette values, however, clusters 1 and 2 (which are combined in the presence of three clusters) have very different survival rates. Therefore, we chose the number of clusters to be four.
Fig. 3.

(a) Hierarchical clustering of 726 samples using 3,426 genes via aWCluster. The first bar underneath the hierarchical clustering corresponds to the PAM50 subtypes. The black color represents the samples whose PAM50 subtypes are not available. Furthermore, the heatmaps represent the integrative measures, gene expression, copy number alteration, and methylation of 150 genes selected based on ANOVA. Here, these top 150 genes are sorted (descending order) for cluster 1. The difference in the integrative measures between clusters is visually detectable in the heatmap. Of note, the samples are ordered based on clustering via integrative measures and if we started with one of these single omics we would not be able to achieve this clustering. We still see the pattern in the values of each single omics especially for gene expression and copy number alteration, however, they are not as clear as the one with the integrative values. (b) Display of survival rate using the Kaplan-Meier curves with respect to multiomics (aWCluster) and single omic subgroups of TCGA breast carcinoma. Sample survival time (months) are plotted on the y-axis (truncated at 5 years), and the probability of survival calculated according to the Kaplan-Meier method is plotted on the x-axis. The p-value (log-rank test) for mutiomics is significantly lower than single omic subtypes. The number of clusters with each data type is chosen based on the silhouette mean value 13. In aWCluster, Cluster 2* has a very low survival rate compared to the other three subgroups.
We compared our clustering with the well-known PAM50 molecular subtypes of breast cancer (Luminal A, Luminal B, HER2-enriched, Basal-like, and Normal-like). As shown in Table 1, our clustering substantially recovers the major PAM50 subtypes (chi-squared test’s p-value ≪ 10−4) even though there are only 19 of the PAM50 genes in the network utilized by aWCluster. We have the PAM50 subtype classification for 649 out of 726 samples in the database. Clusters 3 and 4 significantly distinguish Luminal A from the Basal-like subtype. Cluster 4 also includes most of the Luminal B subtype. Moreover, many of the Her2 enriched tumor types are in cluster 1 whereas the normal-like subtype is clustered together with Luminal A tumors in cluster 3. Also, as we expected, the overall survival status of cluster 3 which mainly consists of the Luminal A subtype is higher than cluster 4 which includes many of the Luminal B and Basal-like subtypes (p-value=0.014). Despite this consistency, our clustering provides additional heterogeneity within PAM50 subtypes which is significantly more predictive of survival rates (Table 2). As shown in Fig. 3b, Cluster 2* in aWCluster has a significantly low survival rate compared to the other three clusters. This Cluster of 53 samples mostly consist of Basal-like and Luminal B subtypes.
TABLE 1.
aWCluster Subgroups are Concordant With the PAM50 Subtypes
| PAM50 | Cluster 1 | Cluster 2* | Cluster 3 | Cluster 4 | Total |
|---|---|---|---|---|---|
| Lum A | 7 | 8 | 240 | 83 | 338 |
| Lum B | 11 | 18 | 32 | 69 | 130 |
| Her 2 | 17 | 4 | 5 | 14 | 40 |
| Basal | 4 | 16 | 17 | 76 | 113 |
| Normal | 0 | 1 | 21 | 6 | 28 |
| Total | 39 | 47 | 315 | 248 | 649 |
The chi-squared test’s p-value ≪ 10−4 (after excluding the normal subtype due to small counts). Cluster 3 includes most of the Luminal A subtype, whereas cluster 4 consists of the Basal-like and Luminal B subtypes.
TABLE 2.
We Compared aWCluster to Alternative Methods of iCluster, SNF, CNAmet, and PAM50 Subtypes for Breast Carcinoma and Lung Non-Small Cell Adenocarcinoma
| Integration method | aWCluster | PAM50 | CNAmet | iCluster | SNF |
|---|---|---|---|---|---|
| Breast Cancer | 4:23 × 10−3 | 6:05 × 10−2 | 3:62 × 10−1 | 2:23 × 10−2 | 3:72 × 10−2 |
| Lung Cancer | 7:3 × 10⁻³ | - | 5:59 × 10−1 | 3:28 × 10−2 | 1:17 × 10−1 |
The p-value (log-rank test) of aWCluster is significantly lower than the alternative methods.
Fig. 3a shows the heatmap of integrative measures of 150 selected genes for 726 samples. The values of integrative measures are visually distinguishable between clusters which assures the accuracy of the clustering method. We utilized Analysis of Variance (ANOVA) to choose 150 top genes that have significantly different mean values of integrative measures across the four clusters. For better visualization, we further reordered these 150 genes based on the highest to lowest mean values in cluster 1. The highest values of integrative measures in cluster 1 (which has many HER2-enriched tumors) are by far ERBB2, GRB7, and PIK3C2A. Also, these genes have very significantly different mean values across the 4 clusters (after sorting based on ANOVA’s p-values). This result is consistent with the known co-amplification of ERBB2 and GRB7 in HER2-enriched breast cancer [34]. The complete list of these 150 genes has been provided in S1 Dataset of Supplementary Information, available online. We also provided the heatmap of gene expression, copy number alteration, and methylation in Fig. 3a. We still see the pattern in the values of each single omics, however, these single omics patterns are not as clear as the one with the integrative values.
In order to investigate the importance of integrating the multiomics in aWCluster, we compared aWCluster to clustering with individual single omics (gene expression/ copy number alteration/ methylation). We applied the network-based invariant measures given in Eq. (2) which only depends on one single omics. As shown in Fig. 3b, single omic analysis mostly did not result in significantly different survival clusters, but aWCluster had significant differences in survival rates. We also provide a complement analysis by removing one of the three omics (Fig. 5). To this end, we applied a multiplication of invariant measures in Eq. (2) for two of the omics. Consistent with single omics analysis, the most predictive data type for survival analysis is mRNA expression and clustering with DNA methylation and DNA copy number not resulting in a predictive subgroups for survival rate.
Fig. 5.

Display of survival rate using the Kaplan-Meier curves with respect to excluding one of the three multiomics in TCGA breast cancer. Sample survival time (months) are plotted on the y-axis (truncated at 5 years), and the probability of survival calculated according to the Kaplan-Meier method is plotted on the x-axis. The number of clusters with each data type is chosen based on the silhouette mean value. The p-value (log-rank test) for DNA copy number and methylation is significantly higher than two other multiomics.
We also repeated aWCluster to cluster TCGA breast cancer data using the genes that are only included in the OncoKB database to evaluate the robustness of the method. This smaller network with 290 genes is computationally much more efficient. The clustering of the 726 samples using this gene set is significantly consistent with our previous clustering using the 3,426 genes (chi-squared test’s p-value ≪ 10−4 for contingency Table S4 of Supplementary Information, available online,) indicating the robustness of aWCluster’s methodology to preselection of genes. We included the details of this clustering along with more clinical outcome analysis in Supplementary Information, available online.
For validation of aWCluster performance in other cancer types, we applied our pipeline to five other cancer types using the genes that each one shares with HPRD/ OncoKB in their largest connected component of their network. The number of samples for these five cancers are much smaller that breast cancer (with the highest being 416 samples for lung cancer and the smallest being 80 samples for renal carcinoma), and the number of clusters remained two for these cancer types. The result in Fig. 4 shows the generalizability of aWCluster in stratifying subgroups of patients with different cancer type with regard to their survival outcome.
Fig. 4.

Display of survival rate using the Kaplan-Meier curves for five TCGA cancer types. Sample survival time (months) are plotted on the y-axis (truncated at 5 years), and the probability of survival calculated according to the Kaplan-Meier method is plotted on the x-axis. The significant p-values (log-rank test) shows that aWCluster successfully stratifies patients of all cancer types into the groups with significantly different survival rates.
We also compared aWCluster to the alternative methods of iCluster, SNF, and CNAmet. Unlike aWCluster, both iCluster and SNF are dependent on hyperparameters in their method. iCluster is less robust to the choice of hyperparameter (Lasso parameter) and preselection of genes. Here, we compare the four methods with the same set of genes. SNF and CNAmet are less computationally expensive than iCluster and aWCluster but achieves a higher p-value for log-rank test of survival rate. The log-rank p values of these methods are provided in Table 2 for breast and lung cancer. All four methods have substantially recovered the Luminal A subtypes in breast cancer, yet aWCluster subtypes are more similar to iCluster rather than to SNF and CNAmet.
We furthermore studied the immune subtypes of the TCGA breast cancer samples provided in the paper [35]. Table 3 provides the immune subtypes in our two largest clusters via aWCluster. As shown in Table 3, cluster 3 recovers most of the inflammatory immune subtype. This group was defined by Th17 and Th1 gene elevation and lower level aneuploidy [35] and it has the best prognosis among TCGA data. Likewise, our cluster 3 which consists of mostly Luminal A, has a very good prognosis (Fig. 3b). Of note, cluster 3 includes even more samples of inflammatory immune subtype (81 percent) compared to the PAM50 Luminal A subtype (73 percent).
TABLE 3.
Immune Subtypes of Breast Cancer TCGA Data in the Two Largest Clusters (via aWCluster)
| Immune Subtype | Cluster 3 | Cluster 4 | Total (all 4 clusters) |
|---|---|---|---|
| Wound healing | 89 (40%) |
98 (44%) |
225 (31%) |
| IFN-γ domminant | 107 (39%) |
127 (47%) |
271 (36%) |
| Inflammatory | 113 (81%) |
21 (15%) |
139 (19%) |
| Lymphocyte depleted | 27 (44%) |
22 (36%) |
61 (8%) |
| TGF-β dominant | 18 (69%) |
5 (19%) |
26 (4%) |
Cluster 3 which has a good prognosis recovers most of the inflammatory immune subtype. The percentages of each immune subtype in our clusters are included in the table. The complete table including all four clusters is provided in Table S5 of Supplementary Information, available online.
One of the advantages of aWCluster is its interpretability. The integrative measures of aWCluster are defined explicitly for all genes in the study. Therefore, we can investigate genes that contribute the most in separating a specific cluster. Here, we are interested in the GO enrichment analysis of the significant genes in the clusters to see which biological processes/ pathways are related to the clusters with distinguished survival rates in breast cancer. As we see in Fig. 3b, cluster 2 has the lowest survival rate compared to all other clusters. We identified the genes that have significantly different mean values in this cluster compared to the other three clusters using the t-test. We chose 166 significant genes (S2 Dataset in Supplementary Information, available online) in cluster 2 based on the (t-test) Bonferroni corrected p-value less than 0.01. We then performed a GO enrichment analysis of these genes via MetaCore software (Thomson Reuters). MetaCore is an integrated software based on a manually-curated database of molecular interactions, molecular pathways, gene-disease associations, chemical metabolism, and toxicity information. We discovered that the significant genes in cluster 2 notably correspond with hypoxia. In the top ten biological processes presented in Table 4, the first, second, and also fifth processes are strongly correlated to hypoxia (p-value ≪ 10−6) . Tumor hypoxia, a well-known phenomenon where tumor cells have been deprived of oxygen, is a prominent issue in tumor physiology and cancer treatment [36], [37]. Specifically, hypoxia appears to be strongly associated with tumor malignancy, resistance to treatment and the metastatic phenotype of cancer [38], [39]. Performing similar analysis for choosing the significant genes in the other three clusters, did not result in hypoxia as a top biological process in the other GO enrichment analysis.
TABLE 4.
Top 10 Biological Processes Obtained From the Gene Ontology Enrichment Analysis of the Significant Genes for the Subgroup With the Worst Survival Outcome
| Ranking | Biological Processes |
|---|---|
| 1 | Response to decreased oxygen levels |
| 2 | Response to hypoxia |
| 3 | Regulation of cellular biosynthetic process |
| 4 | Cellular macromolecule metabolic process |
| 5 | Response to oxygen levels |
| 6 | Regulation of macromolecule biosynthetic process |
| 7 | Regulation of biosynthetic process |
| 8 | Positive regulation of macromolecule biosynthetic Process |
| 9 | Positive regulation of cellular biosynthetic process |
| 10 | Positive regulation of nucleobase-containing compound |
| metabolic process |
Top biological processes (first, second and also fifth) are strongly correlated with hypoxia.
The protein/ gene interaction network of these 166 genes is also presented in Fig. 6. The network is very much connected which indicates that many of these 166 genes are related to each other. The three hub nodes, ETS1, AP-1, and STAT3 located within the nucleus are highly connected to many other proteins in the network. The hypoxia-inducible factor (HIF-1) is the principal transcription factor related to hypoxia, and it has been demonstrated that HIF-1 activity is increased in various tumors relative to that found within normal tissues [40], [41]. Along with HIF-1, members of the v-ets erythroblastosis virus E26 oncogene homolog (ETS) family transcription factors, most prominently the proto-oncogene ETS1, participate in the upregulation of hypoxia-inducible genes [42]. Oikawa et al. [36] showed for the first time that ETS1 is induced in the setting of hypoxia via the transcriptional activity of HIF-1. Of note, increased expression of ETS1 is seen in a variety of solid cancers including lung, colorectal, sarcoma, and squamous cell carcinomas, and higher levels have correlated with a higher incidence of lymph node metastasis and overall worse prognosis [43]. This gene is also involved in tumor progression in breast cancer, where in the setting of hypoxia, increased expression by mammary epithelial cells contributes to aggressive tumor phenotypes by activating the transcription of genes involved in angiogenesis, extracellular matrix remodeling, cell adhesion, and invasion [36], [44]. Moreover, increased expression of ETS1 is associated with increased risk of recurrence and worse prognosis in human breast cancers [45].
Fig. 6.
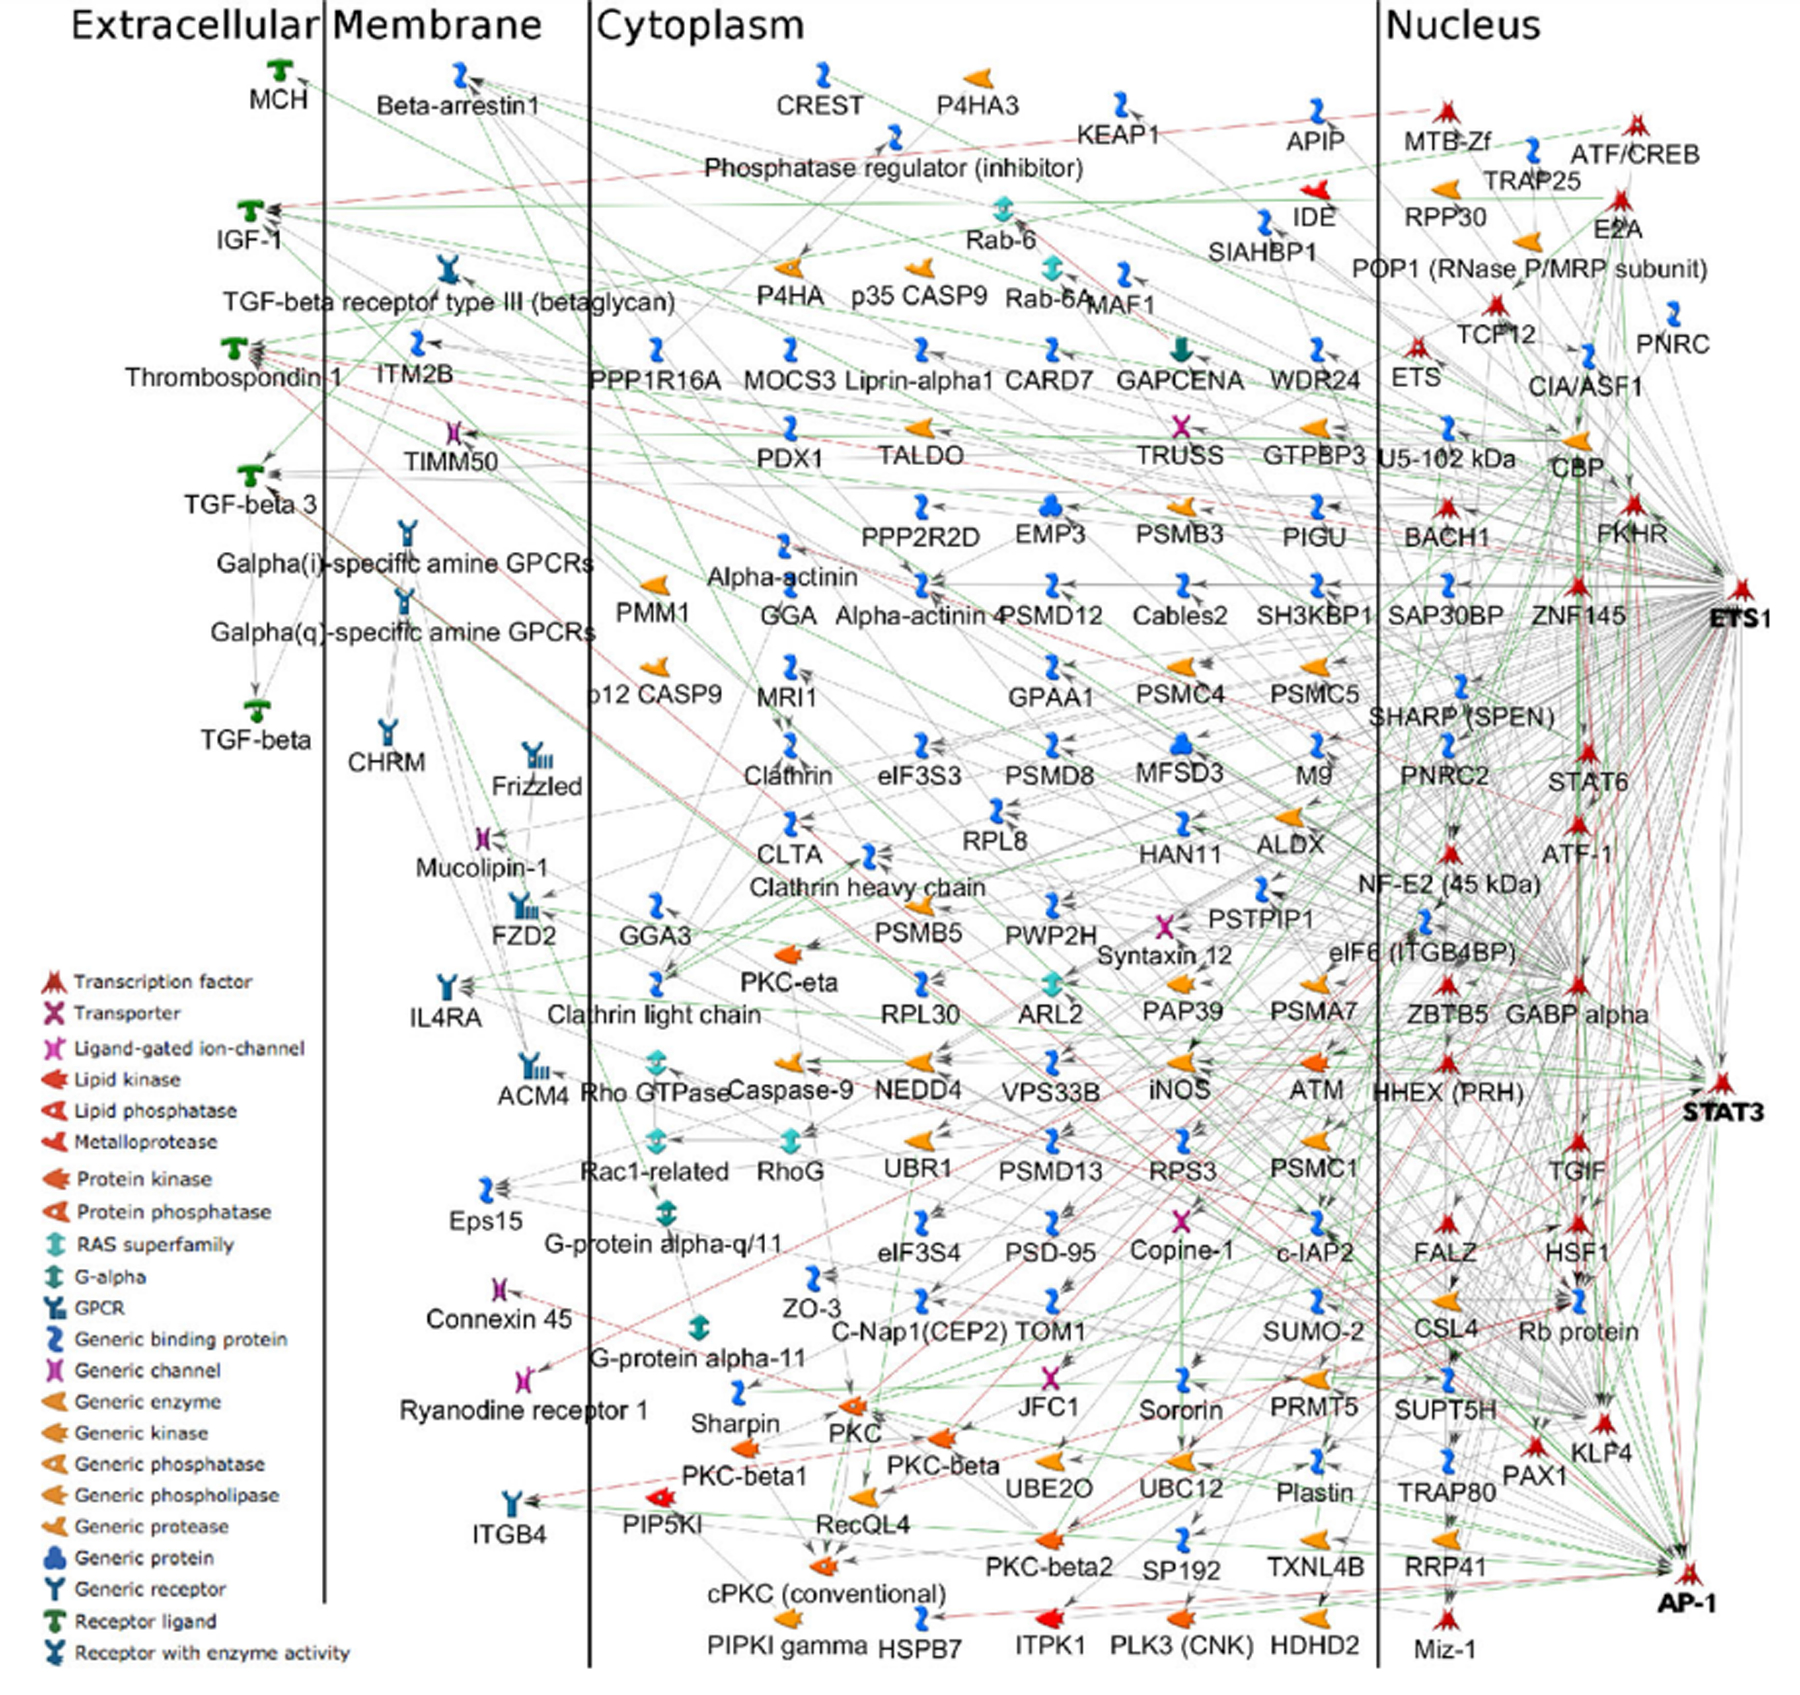
The protein (gene) interaction network of the significant genes for the subgroup with the worst survival outcome (via MetaCore). The network includes the hub nodes ETS1 as well as AP-1 and STAT3 located within the nucleus.
In addition, Activator Protein 1 (AP-1), another hub node in our network of significant genes (Fig. 6) has also been identified as a hypoxia-inducible transcription factor [46]. C-jun, a proto-oncogene, encodes a major component of AP-1 transcription factors, which are key regulators of immediate-early signals directing cellular proliferation, differentiation, survival, and environmental stress responses [47]. AP-1 appears to be involved in the modulation of the apoptotic pathway and also plays a protective role in cellular response to DNA damage [48], [49]. Piret et al. [50] demonstrated an AP-1 mediated protective role of hypoxia against cell death induced by the chemotherapeutic agent etoposide. Similarly, in the setting of hypoxia, an anti-apoptotic role of AP-1 was seen in paclitaxel exposed breast cancer cells [51].
Furthermore, STAT3 is another hub node in our network and is included in the set of 166 significant genes related to the subgroup with the worst survival. Hypoxia can induce the activation of transcription 3 (STAT3) protein, with the hypoxia-induced biochemical alterations likely contributing to drug resistance under hypoxic conditions [52]. Notably, hypoxia-induced STAT3 accelerates the accumulation of HIF-1 protein and has been shown to prolong its half-life in solid tumor cells [53]. Moreover, in a triple-negative breast cancer cell line, STAT3 has been shown to play a key role in hypoxia-induced chemoresistance to the chemotherapeutic agent cisplatin [54].
4. Discussion
The complexity of cancer etiology, the advent of large scale diverse genome-wide data, and the significant improvement in mathematical/statistical data analysis tools has resulted in considerable progress in the field of multiomics integration [55]. We believe that in aggregating multiomics, it should be considered that cancer-related genes do not act individually, but within an interaction network, which must be explicitly incorporated into the integration procedure. Recent efforts in network-based analysis of ‘omics’ allow identification of new disease genes, pathways and rational drug targets that were not easily detectable by isolated gene analysis [56]. The network based integration of aWCluster considers the mRNA expression, DNA methylation, and copy number alteration of the genes in their corresponding neighborhoods of the interaction network. The concordance of the mutiomic values for a gene and its neighbors in the network results in a high integrative measure of the gene. aWCluster defines the similarity measured among samples by the Wasserstein distance between the distributions of the samples of the integrative measures along the genes. Applying aWCluster to six cancer types from TCGA data successfully clusters data with significantly different survival rates. We showed that network-based integration of all the genomic, transcriptomic, and epigenomic data increases the information content and accuracy of the results more than any of the single omics studies separately.
We were able to recover the well-known PAM50 subtypes in breast cancer TCGA data and identified the inflammatory immune subtype which has an improved prognosis. The immune subtype analysis of TCGA data has been done through the characteristic immuno-oncologic gene signatures [35]. The identification of the inflammatory immune subgroup with increased survival in our independent clustering results may support the existence of other gene signatures in this subtype.
Our clustering results also reveal a subgroup of breast cancer patients with substantially poor survival outcome. We performed the GO enrichment analysis on the genes that have significantly different values in this cluster compared to others. The analysis discovered that this gene set is significantly related to the biological process of hypoxia. Also, as we see in Fig. 6, the network of these genes is very densely connected, with a hub node ETS1 which is a transcription factor included in the list of 166 significant genes of the subgroup with the worst survival rate.
We should note that our methodology does not identify the dominant etiology of the hypoxia subtype. In particular, these cases may represent an evolution from states represented by another cluster. Another limitation of the present work is that we only consider an undirected form of the interaction network. In addition to considering directionality, we previously studied the type of control (e.g., activator and repressor in transcription networks) in biological networks [57]. Accordingly, in future work, we plan to include the effect of both the network direction and regulation control type in our integrative measures.
In conclusion, we believe that the integration of multiomics/biological data paves the way for precision medicine in treating sophisticated diseases such as cancer. To this end, we proposed a novel integrating method, based on the theory of optimal mass transport, that allows for the interactive relationship among different omics layers, and accurately clusters breast and lung cancer samples with significantly different survival rates.
Supplementary Material
Acknowledgments
This work was supported by AFOSR grant (FA9550-17-1-0435), a grant from National Institutes of Health (R01-AG048769), MSK Cancer Center Support Grant/Core Grant (P30 CA008748), and a grant from Breast Cancer Research Foundation (BCRF-17-193).
Biographies

Maryam Pouryahya received the BSc and MS degrees in mathematics from the University of Tehran, Iran, in 2008 and 2010, respectively, and the PhD degree in applied mathematics-computational biology track from Stony Brook University, New York, in 2018. She is currently a postdoctoral research scholar with the Department of Medical Physics, Memorial Sloan Kettering Cancer Center, New York. Her research focuses on computational genomics & genetics, statistical machine learning, biological network analysis, systems biology, medical imaging, and topological data analysis.

Jung Hun Oh received the PhD degree in computer science from the University of Texas, Arlington, in 2008. He is currently an assistant attending computer scientist with the Department of Medical Physics, Memorial Sloan Kettering Cancer Center. His current research interests include outcomes modeling, radiomics, and radiogenomics in cancer using machine learning and bioinformatics techniques.

Pedram Javanmard completed his Internal Medicine residency and chief residency training at SUNY Stony Brook University Hospital in Long Island, New York. He subsequently moved to New York City and completed his clinical fellowship training in Endocrinology, Diabetes, and Bone Diseases at The Mount Sinai Hospital. After completing fellowship, he joined the faculty at Mount Sinai Hospital as a full time clinical endocrinologist. He has published over a dozen highly cited peer-reviewed journal articles and has presented his work at multiple international conferences.

James C. Mathews received the PhD degree in mathematics from Stony Brook University, in 2017. He is a postdoctoral researcher with MSKCC. His research interests include differential and information geometry, topological data analysis, statistics, and genomics.

Zehor Belkhatir received the engineering and MSc degrees in automatic control from Ecole Nationale Polytechnique, Algiers, Algeria, in 2012, and the PhD degree in electrical engineering from the King Abdullah University of Science and Technology, Jeddah, Saudi Arabia, in 2018. From 2018 to 2019, she held a postdoctoral research scholar position with the Department of Medical Physics, Memorial Sloan Kettering Cancer Center, New York. She is currently a lecturer with the School of Engineering, University of Leicester, Leicester, United Kingdom. Her research interests include the areas of modeling, estimation and control of complex systems, and biological/medical imaging data analysis.

Joseph O. Deasy is the chair of the Department of Medical Physics and chief of the Service for Predictive Informatics (SPI), Memorial Sloan Kettering Cancer Center. He created the SPI in 2011 with a mission of conducting image-based/big data analyses, and advancing new clinical decision support tools, e.g., image-based radiation oncology, radiomics, imaging genomics, tumor response, toxicity prediction, and genome-based predictive models. He has more than 20 years of experience in data science and informatics, including creating the CERR software platform.

Allen R. Tannenbaum (Fellow, IEEE) is a distinguished professor of Computer Science and Applied Mathematics & Statistics, Stony Brook University as well as Affiliate Attending Computer Scientist with Memorial Sloan Kettering Cancer Center. His research interests include systems and control, network theory, computer vision, systems biology, and medical image processing.
Footnotes
Additional Information: Supplementary Information, available online accompanies this paper. The code for implementing aWCluster is freely available at https://github.com/mpouryah/aWCluster.
The authors declare that they have no competing interests.
Contributor Information
Maryam Pouryahya, Department of Medical Physics, Memorial Sloan Kettering Cancer Center, New York, NY 10065 USA..
Jung Hun Oh, Department of Medical Physics, Memorial Sloan Kettering Cancer Center, New York, NY 10065 USA..
Pedram Javanmard, Division of Endocrinology Diabetes and Bone Disease, Icahn School of Medicine at Mount Sinai, New York, NY 10029 USA..
James C. Mathews, Department of Medical Physics, Memorial Sloan Kettering Cancer Center, New York, NY 10065 USA.
Zehor Belkhatir, Department of Medical Physics, Memorial Sloan Kettering Cancer Center, New York, NY 10065 USA..
Joseph O. Deasy, Department of Medical Physics, Memorial Sloan Kettering Cancer Center, New York, NY 10065 USA..
Allen R. Tannenbaum, Department of Computer Science and Department of Applied Mathematics and Statistics, Stony Brook University, Stony Brook, NY 11794 USA..
References
- [1].Network CGAR et al. , “The cancer genome atlas pan-cancer analysis project,” Nat. Genet, vol. 45, no. 10, pp. 1113–1120, 2013. [DOI] [PMC free article] [PubMed] [Google Scholar]
- [2].Huang S, Chaudhary K, and Garmire LX, “More is better: Recent progress in Multi-Omics data integration methods,” Front. Genet, vol. 8, Jun. 2017, Art. no. 84. [DOI] [PMC free article] [PubMed] [Google Scholar]
- [3].Nguyen T, Tagett R, Diaz D, and Draghici S, “A novel approach for data integration and disease subtyping,” Genome Res, vol. 27, no. 12, pp. 2025–2039, Oct. 2017. [DOI] [PMC free article] [PubMed] [Google Scholar]
- [4].Bruno E and Marchand-Maillet S, “Multiview clustering: A late fusion approach using latent models,” in Proc. 32nd Int. ACM SIGIR Conf. Res. Develop. Inf. Retrieval, 2009, pp. 736–737. [Google Scholar]
- [5].Lock EF and Dunson DB, “Bayesian consensus clustering,” Bioinformatics, vol. 29, no. 20, pp. 2610–2616, Oct. 2013. [DOI] [PMC free article] [PubMed] [Google Scholar]
- [6].Hoadley KA, “Multiplatform analysis of 12 cancer types reveals molecular classification within and across tissues of origin,” Cell, vol. 158, no. 4, pp. 929–944, 2014. [DOI] [PMC free article] [PubMed] [Google Scholar]
- [7].Wang B et al. , “Similarity network fusion for aggregating data types on a genomic scale,” Nat. Methods, vol. 11, 2014, Art. no. 333–337. [DOI] [PubMed] [Google Scholar]
- [8].Bonnet E, Calzone L, and Michoel T, “Integrative multi-omics module network inference with lemon-tree,” PLoS Comput. Biol, vol. 11, no. 2, Feb. 2015, Art. no. e1003983. [DOI] [PMC free article] [PubMed] [Google Scholar]
- [9].Vaske CJ et al. , “Inference of patient-specific pathway activities from multi-dimensional cancer genomics data using paradigm,” Bioinformatics, vol. 26, no. 12, pp. i237–i245, 2010. [DOI] [PMC free article] [PubMed] [Google Scholar]
- [10].Zhang S, Li Ǫ, Liu J, and Zhou XJ, “A novel computational framework for simultaneous integration of multiple types of genomic data to identify microRNA-gene regulatory modules,” Bioinformatics, vol. 27, no. 13, pp. 401–409, 2011. [DOI] [PMC free article] [PubMed] [Google Scholar]
- [11].Zhang S, Liu C-C, Li W, Shen H, Laird PW, and Zhou XJ, “Discovery of multi-dimensional modules by integrative analysis of cancer genomic data,” Nucleic Acids Res, vol. 40, no. 19, pp. 9379–9391, 2012. [DOI] [PMC free article] [PubMed] [Google Scholar]
- [12].Shen R, Olshen AB, and Ladanyi M, “Integrative clustering of multiple genomic data types using a joint latent variable model with application to breast and lung cancer subtype analysis,” Bioinformatics, vol. 25, no. 22, pp. 2906–2912, 2009. [DOI] [PMC free article] [PubMed] [Google Scholar]
- [13].Sathyanarayanan A, Gupta R, Thompson EW, Nyholt DR, Bauer DC, and Nagaraj SH, “A comparative study of multiomics integration tools for cancer driver gene identification and tumour subtyping,” Brief. Bioinf, 2019, Art. no. bbz121. [Online]. Available: 10.1093/bib/bbz121 [DOI] [PMC free article] [PubMed] [Google Scholar]
- [14].Yang B, Zhang Y, Pang S, Shang X, Zhao X, and Han M, “Integrating multi-omic data with deep subspace fusion clustering for cancer subtype prediction,” IEEE/ACM Trans. Comput. Biol. Bioinf, to be published, doi: 10.1109/TCBB.2019.2951413. [DOI] [PubMed] [Google Scholar]
- [15].Zheng R, Li M, Liang Z, Wu F-X, Pan Y, and Wang J, “Sinnlrr: A robust subspace clustering method for cell type detection by non-negative and low-rank representation,” Bioinformatics, vol. 35, no. 19, pp. 3642–3650, Oct. 2019. [DOI] [PubMed] [Google Scholar]
- [16].Liu J, Cheng Y, Wang X, Cui X, Kong Y, and Du J, “Low rank subspace clustering via discrete constraint and hypergraph regularization for tumor molecular pattern discovery,” IEEE/ACM Trans. Comput. Biol. Bioinf, vol. 15, no. 5, pp. 1500–1512, Sep. 2018. [DOI] [PubMed] [Google Scholar]
- [17].Tang Y-C and Amon A, “Gene copy-number alterations: A cost-benefit analysis,” Cell, vol. 152, no. 3, pp. 394–405, Jan. 2013. [DOI] [PMC free article] [PubMed] [Google Scholar]
- [18].Jones PA and Baylin SB, “The fundamental role of epigenetic events in cancer,” Nat. Rev. Genet, vol. 3, 2002, pp. 415–428. [DOI] [PubMed] [Google Scholar]
- [19].Louhimo R and Hautaniemi S, “CNAmet: An R package for integrating copy number, methylation and expression data,” Bioinformatics, vol. 27, no. 6, pp. 887–888, 2011. [DOI] [PubMed] [Google Scholar]
- [20].Villani C, Optimal Transport: Old and New vol. 338, Berlin, Germany: Springer, 2009. [Google Scholar]
- [21].Chen Y et al. “Pediatric sarcoma data forms a unique cluster measured via the earth mover’s distance,” Sci. Rep, vol. 7, no. 1, 2017, Art. no. 7035. [DOI] [PMC free article] [PubMed] [Google Scholar]
- [22].Evans L, “Partial differential equations and monge–kantorovich mass transfer,” Curr. Develop. Math, vol. 1997, pp. 65–126, 1999. [Google Scholar]
- [23].Keshava Prasad TS et al. , “Human protein reference database–2009 update,” Nucleic Acids Res, vol. 37, pp. D767–D772, 2009. [DOI] [PMC free article] [PubMed] [Google Scholar]
- [24].Teschendorff AE, Banerji CRS, Severini S, Kuehn R, and Sollich P, “Increased signaling entropy in cancer requires the scale-free property of protein interaction networks,” Sci. Rep, vol. 5, 2015, Art. no. 9646. [DOI] [PMC free article] [PubMed] [Google Scholar]
- [25].Monge G, Mémoire sur la théorie des déblais et des remblais De l’Imprimerie Royale, 1781. [Google Scholar]
- [26].Kantorovich LV, “On the translocation of masses,” J. Math. Sci, vol. 133, no. 4, pp. 1381–1382, 2006. [Google Scholar]
- [27].Beckmann M, “A continuous model of transportation,” Econometrica, vol. 20, pp. 643–660, 1952. [Google Scholar]
- [28].Rubner Y, “The earth mover’s distance as a metric for image retrieval,” Int. J. Comput. Vis, vol. 40, no. 2, pp. 99–121, 2000. [Google Scholar]
- [29].Boyd S and Vandenberghe L, Convex Optimization Cambridge, U.K.: Cambridge Univ. Press, 2004. [Google Scholar]
- [30].Rousseeuw PJ, “Silhouettes: A graphical aid to the interpretation and validation of cluster analysis,” J. Comput. Appl. Math, vol. 20, pp. 53–65, 1987. [Google Scholar]
- [31].Perou CM et al. “Molecular portraits of human breast tumours,” Nature, vol. 406, 2000, pp. 747–752. [DOI] [PubMed] [Google Scholar]
- [32].Sorlie T et al. “Gene expression patterns of breast carcinomas distinguish tumor subclasses with clinical implications,” Proc. Nat. Acad. Sci. USA, vol. 98, no. 19, pp. 10 869–10 874, Sep. 2001. [DOI] [PMC free article] [PubMed] [Google Scholar]
- [33].Parker JS et al. , “Supervised risk predictor of breast cancer based on intrinsic subtypes,” J. Clin. Oncol, vol. 27, no. 8, pp. 1160–1167, Mar. 2009. [DOI] [PMC free article] [PubMed] [Google Scholar]
- [34].Pradip D, Bouzyk M, Dey N, and Leyland-Jones B, “Dissecting GRB7-mediated signals for proliferation and migration in HER2 overexpressing breast tumor cells: GTP-ase rules,” Amer. J. Cancer Res, vol. 3, no. 2, pp. 173–195, 2013. [PMC free article] [PubMed] [Google Scholar]
- [35].Thorsson V et al. “The immune landscape of cancer,” Immunity, vol. 48, no. 4, pp. 812–830.e14, 2018. [DOI] [PMC free article] [PubMed] [Google Scholar]
- [36].Oikawa M, Abe M, Kurosawa H, Hida W, Shirato K, and Sato Y, “Hypoxia induces transcription factor ETS-1 via the activity of hypoxia-inducible factor-1,” Biochem. Biophys. Res. Commun, vol. 289, no. 1, pp. 39–43, 2001. [DOI] [PubMed] [Google Scholar]
- [37].Vaupel P and Mayer A, “Hypoxia and anemia: Effects on tumor biology and treatment resistance,” Transfusion Clinique Biol, vol. 12, no. 1, pp. 5–10, Feb. 2005. [DOI] [PubMed] [Google Scholar]
- [38].Höckel M and Vaupel P, “Tumor hypoxia: Definitions and current clinical, biologic, and molecular aspects,” JNCI: J. Nat. Cancer Inst, vol. 93, no. 4, pp. 266–276, 2001. [DOI] [PubMed] [Google Scholar]
- [39].Brown JM, Tumor Hypoxia in Cancer Therapy Cambridge, MA, USA: Academic Press, 2007, pp. 295–321. [Google Scholar]
- [40].Bos R, van Diest PJ, and van der Wall E, “RESPONSE: Re: Levels of Hypoxia-Inducible factor-1 during breast carcinogenesis,” JNCI J. Nat. Cancer Inst, vol. 93, no. 15, pp. 1177–1177, Aug. 2001. [DOI] [PubMed] [Google Scholar]
- [41].Dachs GU et al. , “Targeting gene expression to hypoxic tumor cells,” Nat. Med, vol. 3, no. 5, pp. 515–520, May 1997. [DOI] [PubMed] [Google Scholar]
- [42].Salnikow K et al. , “Regulation of hypoxia-inducible genes by ETS1 transcription factor,” Carcinogenesis, vol. 29, no. 8, pp. 1493–1499, Aug. 2008. [DOI] [PMC free article] [PubMed] [Google Scholar]
- [43].Dittmer J, “The biology of the ets1 proto-oncogene,” Mol. Cancer, vol. 2, Aug. 2003, Art. no. 29. [DOI] [PMC free article] [PubMed] [Google Scholar]
- [44].Behrens P, Rothe M, Wellmann A, Krischler J, and Wernert N, “The Ets-1 transcription factor is up-regulated together with MMP 1 and MMP 9 in the stroma of pre-invasive breast cancer,” J. Pathol, vol. 194, no. 1, pp. 43–50, May 2001. [DOI] [PubMed] [Google Scholar]
- [45].Span PN et al. , “Expression of the transcription factor ets-1 is an independent prognostic marker for relapse-free survival in breast cancer,” Oncogene, vol. 21, no. 55, pp. 8506–8509, Dec. 2002. [DOI] [PubMed] [Google Scholar]
- [46].Cummins EP and Taylor CT, “Hypoxia-responsive transcription factors,” Pflugers Archiv, vol. 450, no. 6, pp. 363–371, Sep. 2005. [DOI] [PubMed] [Google Scholar]
- [47].Laderoute KR et al. , “The response of c-Jun/AP-1 to chronic hypoxia is Hypoxia-Inducible factor 1α dependent,” Mol. Cell. Biol, vol. 22, no. 8, pp. 2515–2523, Apr. 2002. [DOI] [PMC free article] [PubMed] [Google Scholar]
- [48].Park S, Hahm E-R, Lee D-K, and Yang C-H, “Inhibition of AP-1 transcription activator induces myc-dependent apoptosis in HL60 cells,” J. Cell. Biochem, vol. 91, no. 5, pp. 973–986, Apr. 2004. [DOI] [PubMed] [Google Scholar]
- [49].Potapova O, Basu S, Mercola D, and Holbrook NJ, “Protective role for c-jun in the cellular response to DNA damage,” J. Biol. Chem, vol. 276, no. 30, pp. 28 546–28 553, Jul. 2001. [DOI] [PubMed] [Google Scholar]
- [50].Piret J-P, Cosse J-P, Ninane N, Raes M, and Michiels C, “Hypoxia protects HepG2 cells against etoposide-induced apoptosis via a HIF-1-independent pathway,” Exp. Cell Res, vol. 312, no. 15, pp. 2908–2920, Sep. 2006. [DOI] [PubMed] [Google Scholar]
- [51].Flamant L, Notte A, Ninane N, Raes M, and Michiels C, “Anti-apoptotic role of HIF-1 and AP-1 in paclitaxel exposed breast cancer cells under hypoxia,” Mol. Cancer, vol. 9, Jul. 2010, Art. no. 191. [DOI] [PMC free article] [PubMed] [Google Scholar]
- [52].Abyaneh HS et al. “STAT3 but not HIF-1a is important in mediating Hypoxia-Induced chemoresistance in MDA-MB-231, a triple negative breast cancer cell line,” Cancers, vol. 9, no. 10, Oct. 2017, Art. no. 137. [DOI] [PMC free article] [PubMed] [Google Scholar]
- [53].Jung JE et al. , “STAT3 inhibits the degradation of HIF-1alpha by pVHL-mediated ubiquitination,” Exp. Mol. Med, vol. 40, no. 5, pp. 479–485, Oct. 2008. [DOI] [PMC free article] [PubMed] [Google Scholar]
- [54].Abyaneh HS, Gupta N, Alshareef A, Gopal K, Lavasanifar A, and Lai R, “Hypoxia induces the acquisition of cancer stem-like phenotype via upregulation and activation of signal transducer and activator of transcription-3 (STAT3) in MDA-MB-231, a triple negative breast cancer cell line,” Cancer Microenviron, vol. 11, no. 2–3, pp. 141–152, Dec. 2018. [DOI] [PMC free article] [PubMed] [Google Scholar]
- [55].Kristensen VN, Lingjærde OC, Russnes HG, Vollan HKM, Frigessi A, and Børresen-Dale A-L, “Principles and methods of integrative genomic analyses in cancer,” Nat. Rev. Cancer, vol. 14, no. 5, pp. 299–313, May 2014. [DOI] [PubMed] [Google Scholar]
- [56].Pouryahya M, Oh JH, Mathews JC, Deasy JO, and Tannenbaum AR, “Characterizing cancer drug response and biological correlates: A geometric network approach,” Sci. Rep, vol. 8, no. 1, 2018, Art. no. 6402. [DOI] [PMC free article] [PubMed] [Google Scholar]
- [57].Pouryahya M, Mathews J, and Tannenbaum A, “Comparing three notions of discrete ricci curvature on biological networks,” 2017, arXiv: 1712.02943 [Google Scholar]
Associated Data
This section collects any data citations, data availability statements, or supplementary materials included in this article.