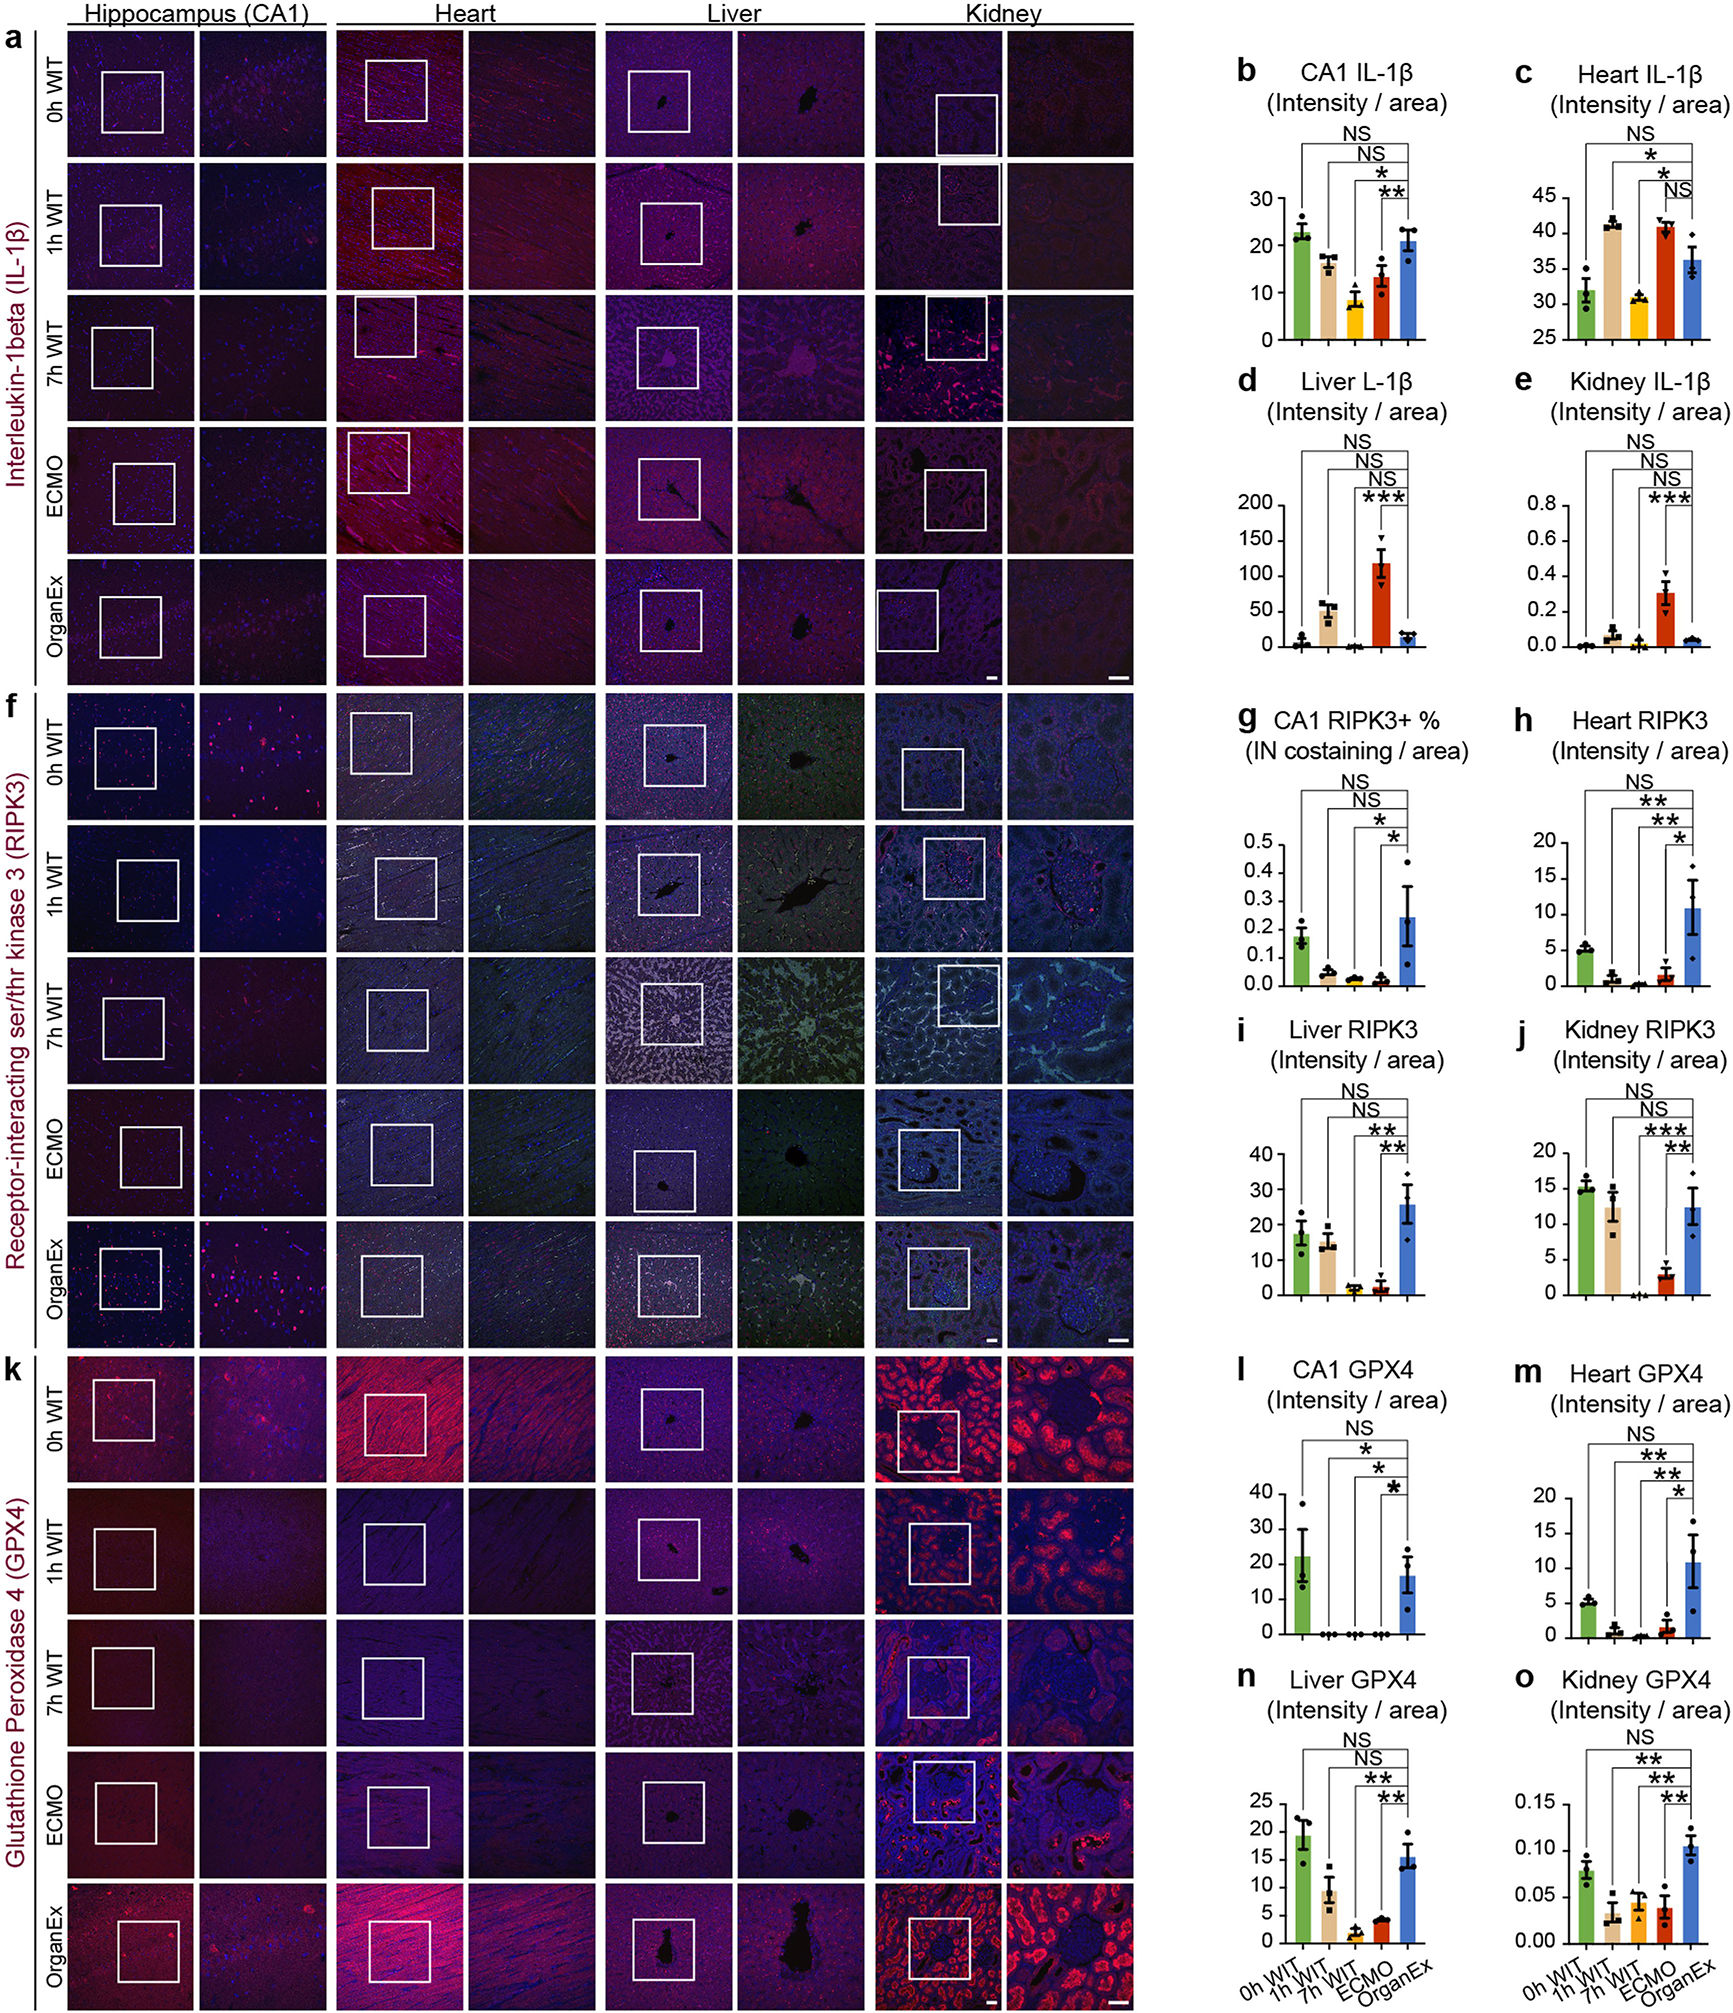
Extended Data Fig. 5 |. Evaluation of different cell death pathways by immunohistochemical staining for important molecules in pyroptosis (IL-1B), necroptosis (RIPK3) and ferroptosis (GPX4) across the experimental conditions.

a, f, k, Representative confocal images of immunofluorescent staining for pyroptosis marker IL-1B, necroptosis marker RIPK3, and ferroptosis marker GPX4, each co-stained with DAPI nuclear stain in CA1, heart, liver, and kidney. b-e, Quantification of IL-1B immunolabeling signal intensity in CA1 (b), heart (c), liver (d), and kidney (e). n = 3. g-j, Quantification of RIPK3 positive intranuclear co-staining in CA1 (g), and immunolabeling signal intensity heart (h), liver (i), kidney (j). n = 3. l-o, Quantification of GPX4 immunolabeling signal intensity in CA1 (l), heart (m), liver (n), and kidney (o). n = 3. Scale bars, 50 μm left and right panels. Data presented are mean ± s.e.m. One-way ANOVA with post-hoc Dunnett’s adjustments was performed. For more detailed information on statistics and reproducibility, see methods. *P < 0.05, **P < 0.01, ***P < 0.001. IN, intranuclear.
