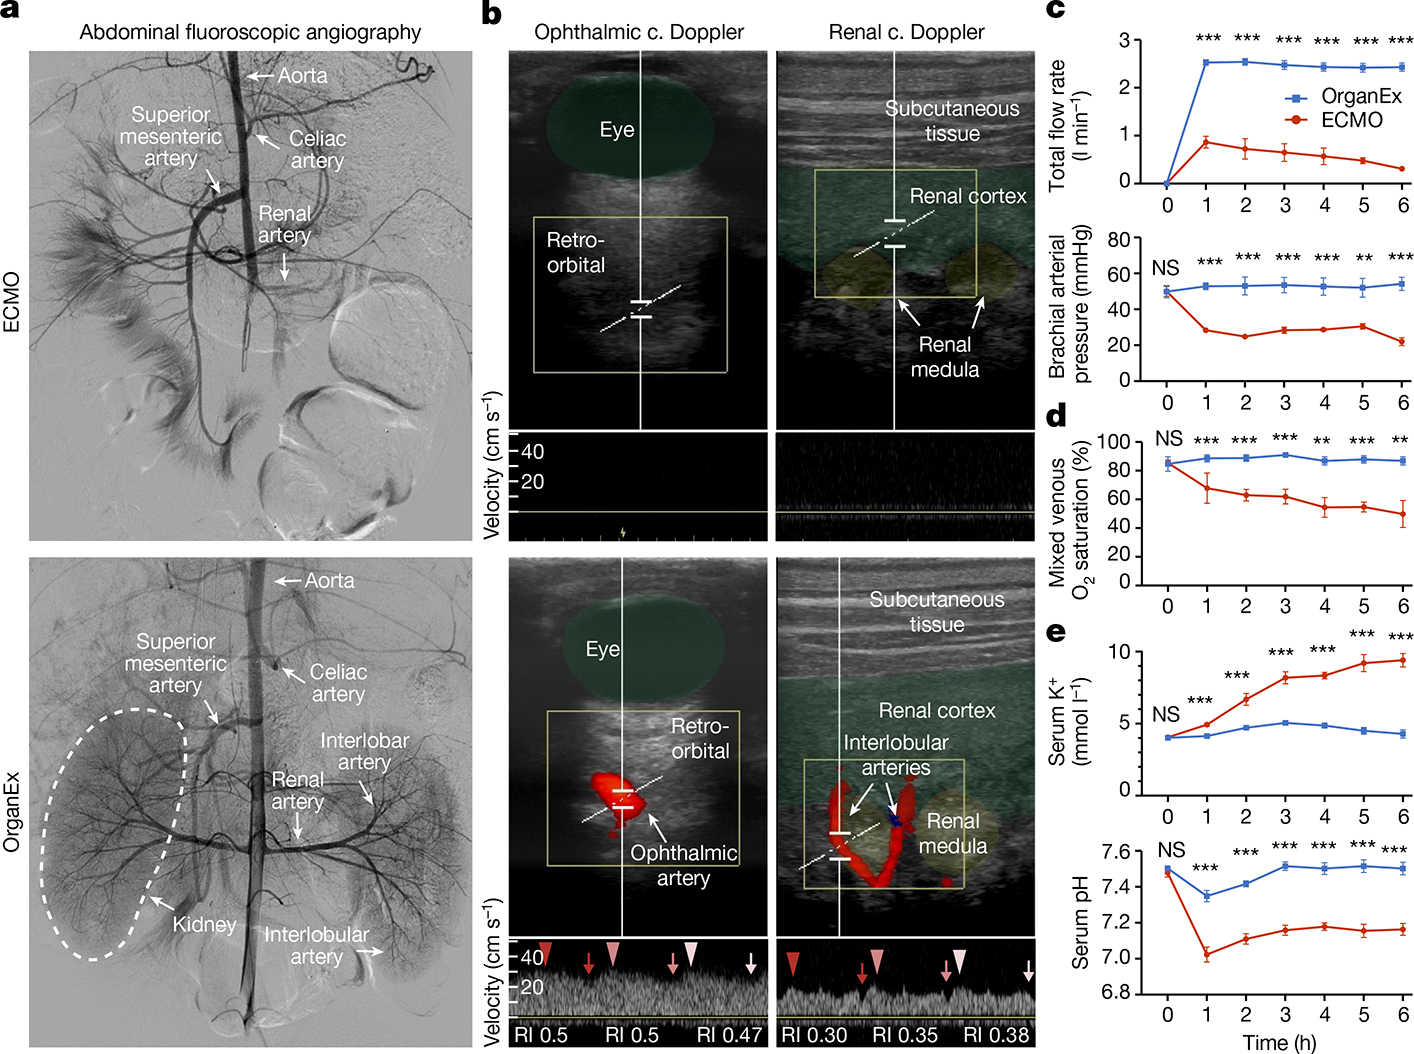
Fig. 2 |. Circulation and blood/perfusate properties during the perfusion protocols.

a,b, Representative images of abdominal fluoroscopy (a; n = 9) and ophthalmic and renal ultrasound (b; n = 6) after 3 h of perfusion. ECMO is shown at the top and OrganEx is shown at the bottom. c., colour; RI, resistive index. c–e, Changes in the total flow rate and brachial arterial pressure (c), the percentage of venous O2 saturation (d) and K+ concentration and pH in the serum (e) throughout the perfusion protocols. n = 6. For c–e, data are mean ± s.e.m. Statistical analysis was performed using unpaired two-tailed t-tests; **P < 0.01, ***P < 0.001; NS, not significant. Further detailed information on statistics and reproducibility are provided in the Methods.
