Abstract
Glycosphingolipids are involved in intercellular signaling, adhesion, proliferation, and differentiation. Saposins A, B, C, and D are cofactors required for glycosphingolipid hydrolysis. Saposins A–D are present in series in a common precursor protein, prosaposin. Thus, glycosphingolipids amounts depend on prosaposin cellular levels. We previously reported that prosaposin and saposin B bind coenzyme Q10 in human cells. Coenzyme Q10 is an essential lipid of the mitochondrial electron transport system, and its reduced form is an important antioxidant. Coenzyme Q10 level decrease in aging and in various progressive diseases. Therefore, it is interesting to understand the cellular response to long-term coenzyme Q10 deficiency. We established a long-term coenzyme Q10 deficient cell model by using the coenzyme Q10 biosynthesis inhibitor, 4-nitrobenzoate. The levels of coenzyme Q10 were reduced by 4-nitrobenzoate in HepG2 cells. Administration of 4-nitrobenzoate also decreased prosaposin protein and mRNA levels. The cellular levels of coenzyme Q10 and prosaposin were recovered by treatment with 4-hydroxybenzoquinone, a substrate for coenzyme Q10 synthesis that counteracts the effect of 4-nitrobenzoate. Furthermore, the ganglioside levels were altered in 4-nitrobenzoate treated cells. These results imply that long-term coenzyme Q10 deficiency reduces cellular prosaposin levels and disturbs glycosphingolipid metabolism.
Keywords: 4-nitrobenzoate, coenzyme Q10, glycosphingolipids, prosaposin
Introduction
Coenzyme Q10 (CoQ10) is a key component of the mitochondrial electron transfer chain.(1) The reduced form of CoQ10, ubiquinol, is one of the most important lipid-soluble antioxidants.(2) CoQ10 cellular levels decrease with aging.(3) Moreover, several diseases are associated with low CoQ10 levels, such as Parkinson’s disease.(4,5) Interestingly, these disorders, as well as aging, progress over several years. To elucidate the physiological relevance of CoQ10, the cellular response after long-term CoQ10 deficiency needs to be understood.
CoQ10 is synthesized in vivo from acetyl-CoA. Starting from acetyl-CoA, a series of reactions comprising the mevalonate pathway produces farnesyl-PP, the cholesterol precursor, CoQ10, dolichol, and isoprenylated proteins.(6) The quinone part derives from a tyrosine. The hydroxybenzoic acid produced from tyrosine is bound to the side chain by the Coq2 enzyme. This reaction is blocked by a competitive inhibitor, namely, 4-nitrobenzoate (4-NB).(7,8) Administration of 4-NB has been shown to reduce cellular CoQ10 levels.(7,8)
We previously reported that CoQ10 is, at least to some extent, bound to saposin B and its precursor, prosaposin (Psap), in human cells.(9) Psap is a highly conserved multifunctional glycoprotein and is the lysosomal precursor of four small sphingolipid activator proteins, known as saposins A, B, C, and D. These four saposins are homologous and contain six conserved cysteines and one common glycosylation site.(10) The mature saposins activate several lysosomal hydrolases involved in the metabolism of various sphingolipids and ceramides. Saposins act as essential cofactors for sphingolipid hydrolases and/or destabilize the lipids.(10) We reported that the loss of Psap in HepG2 and Caco-2 cells decreases CoQ10 cellular levels.(11,12)
Psap and its derived proteins, saposins A–D, are implicated in the sphingolipid metabolism.(13) Psap is important to maintain normal glycosphingolipid levels.(10,14) Glycosphingolipids are involved in intercellular signaling,(15) adhesion,(16) proliferation,(17) and differentiation.(18) Therefore, it is essential to maintain normal sphingolipid levels.
Here, we analyzed the levels of the CoQ10 binding protein Psap in cells with long-term CoQ10 deficiency. CoQ10 is a lipid synthesized from acetyl-CoA together with cholesterol. The liver is a key organ to control lipid metabolism in the body. We used HepG2 cells, which are hepatoma cell line. We established 4-NB treated HepG2 cell models. In the previous studied using 4-NB,(7,8) 4-NB is usually treated for a few days to 1 week. To elucidate the Psap level in chronic CoQ10 deficiency, we created a cell model which is treated 4-NB for more than a month, and we call these cell model as a long-term CoQ deficient cell model in this study. We found that long-term CoQ10 deficiency induced reduced Psap levels and modulated the lipid metabolism in cells.
Materials and Methods
Preparation of HepG2 cells
HepG2 cells (Dainippon Sumitomo Pharma Co., Ltd., Osaka, Japan) were cultured in Dulbecco’s MEM (Sigma, St. Louis, MO) supplemented with 10% fetal calf serum (HyClone; Thermo Scientific, Waltham, MA), 100 units/ml penicillin, and 100 μg/ml streptomycin at 37°C in a humidified atmosphere of 5% CO2 and 95% air.
Cell treatment with 4-NB
4-NB (Wako, Osaka, Japan) was dissolved in DMSO before use. We treated the cells with 4-NB at 0.1, 0.5, 1, 5, and 10 mM and determined the optimal concentration for generating CoQ10-deficient cells over 96 h. The cells were collected every 24 h to quantify the amount of CoQ10. In the following experiments, 4-NB-treated cells were kept in culture medium containing 5 mM 4-NB. The control cells were incubated with DMSO at the corresponding concentration. 4-NB treated cells and control cells were cultured for the same treatment time. It should be noted that we did not see any morphological changes such as hypertrophy in DMSO treated control cells in these periods.
To demonstrate that the effects of 5 mM 4-NB were mediated by the CoQ10 deficiency rather than by side effects of the compound, cells were cotreated with 5 mM 4-NB and 25 μM 4-hydroxybenzoate (4-HB; Wako) or were incubated with normal medium.
Western blot analysis
Western blotting analysis was performed as reported previously with minor modification.(12) Briefly, Each dish of HepG2 cells was incubated with lysis buffer [150 mM NaCl, 50 mM Tris–HCl pH 7.4, 0.1% nonidet P-40 (Nacalai Tesque, Tokyo, Japan), 0.1 mM EDTA, 1 mM phenylmethylsulfonyl fluoride, 1 μg/ml of leupeptin, pepstatin A, 1 μg/ml N-tosyl-l-phenylalanyl chloromethyl ketone, and 1 μg/ml N-tosyl-l-lysyl chloromethyl ketone] for 1 h. Then, the samples were collected and centrifuged at 15,000 × g for 10 min. The protein concentration was measured in the supernatants with a Pierce BCA Protein Assay Kit (Thermo Scientific). The same protein amount (10 μg) was loaded to each well. Samples were separated by electrophoresis through a 7.5% or 10% SDS/polyacrylamide gel. After electrophoresis, proteins were transferred to polyvinylidene di-fluoride membranes. The membranes were incubated with mouse anti-saposin B IgGs (monoclonal antibody generated previously)(9) or mouse anti-acrolein IgGs (NOF Co., Tokyo, Japan) for 1 h at room temperature. Proteins were detected with horseradish peroxidase-conjugated secondary antibodies (Bio-Rad Japan, Tokyo, Japan) for 1 h at room temperature. The protein bands were visualized using EzWestBlue (#AE-1490; ATTO, Tokyo, Japan) for 5 min at room temperature and were Imaged by the GNU Image Manipulation Program 2.8. The imaged protein bands analyzed using the ImageJ software.
RNA isolation and quantitative PCR (qPCR)
The mRNA expression levels in HepG2 cells were determined by reverse transcription PCR as reported previously.(19) Briefly, cells were seeded into 6-well plates (7.5 × 10⁵ cells/well), and total RNA was extracted using TRizol reagent (Thermo Fisher Scientific). The RNA quality and concentration were assessed using a Ultrospec 2100 pro (Biochrom, Cambridge, UK). A reverse transcription was performed to synthesize cDNA using QuantiTect Reverse Transcription Kit (QIAGEN, Venlo, The Netherlands). The expression levels of the following genes were measured by qPCR: Psap, the nuclear transcription factor Y subunit beta (NF-YB), and beta-actin (ACTB). The sequences of the primers are presented in Table 1. A QuantStudio® 5 (Thermo Fisher Scientific) was used to perform the qPCR (95°C for 15 min followed by 40 cycles of 95°C for 15 s and 72°C for 30 s and a final extension step at 60°C for 30 s). The changes in gene expression were calculated with the 2−ΔΔCT method.(20)
Table 1.
List of primer sequences used in the qPCR assays
| NFYB-1 | Forward | 5'-GGTGCCATCAAGAGAAACGG-3' |
| Reverse | 5'-GACTGCTCCACCAATTCCCT-3' | |
| PSAP | Forward | 5'-CTTCCGAAACCGAACATGTCTG-3' |
| Reverse | 5'-GGATCTTATTGGACTCCAGCTG-3' | |
| ACTB | Forward | 5'-ATTGCCGACAGGATGCAGAA-3' |
| Reverse | 5'-GCTGATCCACATCTGCTGGAA-3' |
CoQ10 and free cholesterol (FC) analysis
The cellular concentrations of CoQ10 and free cholesterol (FC) were determined by HPLC, as reported previously with minor modifications.(19,21) Briefly, cells collected in 2-propanol were centrifuged, and the supernatant was injected into the HPLC system. Two separation columns (Ascentis® C8, 5 μm, 250 mm × 4.6 mm i.d. and SupelcosilTM LC-18, 3 μm, 5 cm × 4.6 mm i.d.; Supelco Japan, Tokyo, Japan) and a reduction column (RC-10, 15 mm × 4 mm i.d.; IRICA, Kyoto, Japan) were employed. The mobile phase for the separation columns was 50 mM sodium NaClO4 in methanol/2-propanol (85/15, v/v) and was delivered at a flow rate of 0.8 ml/min. The columns were maintained at 25°C.
Ganglioside analysis
Gangliosides were isolated as described previously(22) and analyzed by thin-layer chromatography (TLC). The TLC solvent system was CHCl3/MeOH/CaCl2 (0.02%) (11/9/2, (v/v/v). Samples were separated on a plate similar to pure ganglioside GM3 standard (Funakoshi Co. Ltd., Tokyo, Japan). The ganglioside bands were detected with a resorcinol thiosulfuric acid coloring reagent. The TLC plate was sprayed with the reagent and developed at 100°C for 30 min. The ImageJ software was used to view and analyze the blot images.
Statistical analysis
Statistical significance was assessed using Student’s t test and one-way analysis of variances (ANOVA). Statistical analysis was performed using BellCurve for Excel (Social Survey Research Information Co., Ltd., Tokyo, Japan). Generally, group differences at the level of *p≤0.05, **p≤0.01, and ***p≤0.001 were considered statistically significant.
Results
Effect of 4-NB treatment on CoQ10 cellular levels
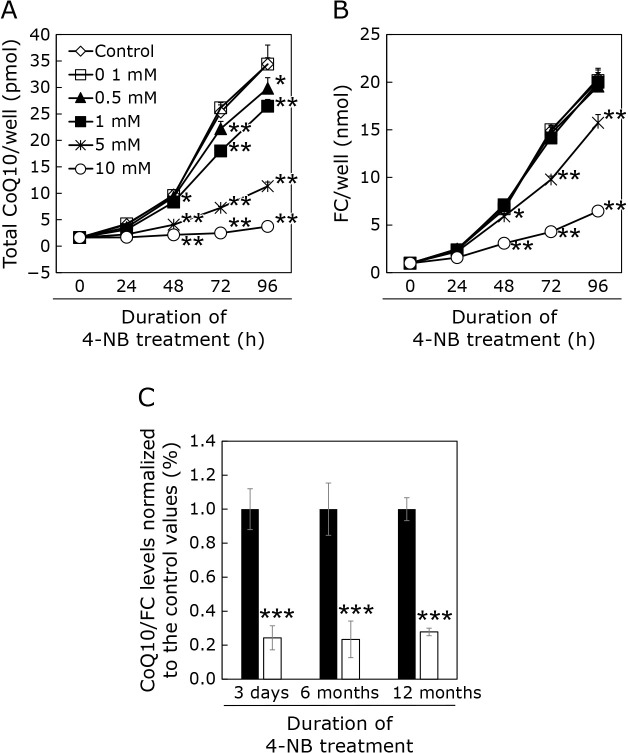
As shown in Fig. 1A, the CoQ10 cellular levels were reduced by 4-NB treatment in a dose-dependent manner. In our previous study,(11,12) we corrected the CoQ values with the amount of FC that would be extracted into isopropyl alcohol as well as CoQ. It should be noted that FC s also produced from acetylCoA via mevalonate pathway, as CoQ. Figure 1B shows the FC level measured in each culture dish well. As shown in this figure, 10 mM 4-NB administration reduced not only CoQ level in each well but also FC level in the well. This result suggests that the administration of 10 mM 4-NB markedly inhibited cell proliferation. Thus, we used 5 mM 4-NB in the following experiments. We administrated 4-NB for 3 days to up to 16 months. CoQ10 cellular levels were significantly decreased compared with those of controls after 3 days of 4-NB treatment. These levels were also low after 6 and 12 months of 4-NB treatment (Fig. 1C).
Fig. 1.
Levels of CoQ10 in HepG2 cells treated or not with 4-NB. (A) Measurement of CoQ10 levels over 96 h of treatment with various concentrations of 4-NB. (B) Measurement of FC levels over 96 h of treatment with various concentrations of 4-NB. (C) Total CoQ10 levels normalized with free cholesterol level in the presence (white bar) or absence (black bar) of 5 mM 4-NB. Data are expressed as mean ± SD. Statistical analysis was conducted by one-way analysis of variances (ANOVA) against the level in control (A, B), and using the Student’s t test (C). *p<0.05, **p<0.01, ***p<0.001 vs control.
To investigate the effects of 4-NB on cellular oxidative stress, we measured the cellular levels of acrolein-bound proteins (Fig. 2A). It can be seen that the amount of high molecular weight acrolein-bound protein has increased in cells treated with 4-NB for 15 months. We have not been able to identify the type of these proteins. Figure 2B shows the proportion of oxidized CoQ10 (%CoQ10) after 3 days and 6 months of 4-NB treatment. This value is an indicator of the oxidative stress and is calculated as follows: [oxidized form of CoQ10]/[oxidized form of CoQ10 + reduced form of CoQ10] × 100. As shown in this figure, %CoQ10 increased after 3 days and 6 months of 4-NB treatment.
Fig. 2.
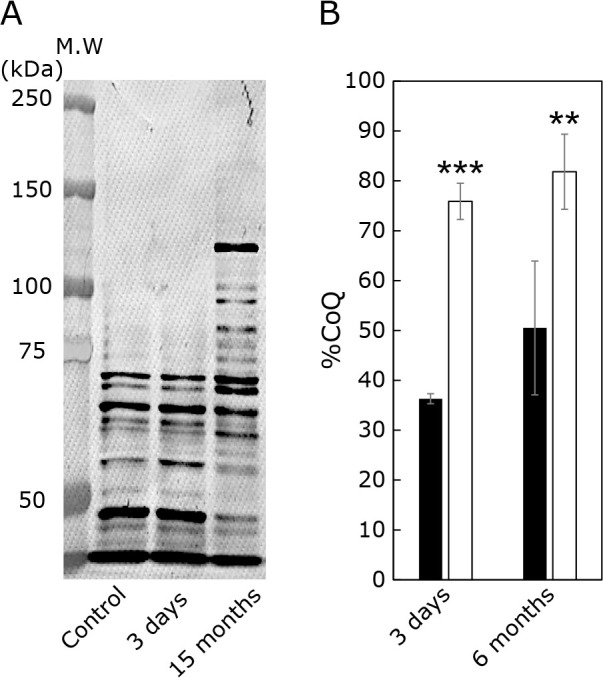
Effect of 4-NB treatment on cellular redox balance. (A) acrolein-bound protein acrolein was detected in control and 4-NB-treated cells by Western blot. (B) %CoQ10 value in control (black bar) and 4-NB-treated cells (white bar). The redox balance of the CoQ10 was assessed using as an indicator the oxidized form of CoQ10 content (%CoQ10) in total CoQ10: [oxidized form of CoQ10]/[oxidized form of CoQ10 + reduced form of CoQ10] × 100. Data are expressed as mean ± SD. The statistical analysis was conducted using the Student’s t test. **p<0.01, ***p<0.001 vs control.
Determination of Psap cellular levels in 4-NB-treated cells
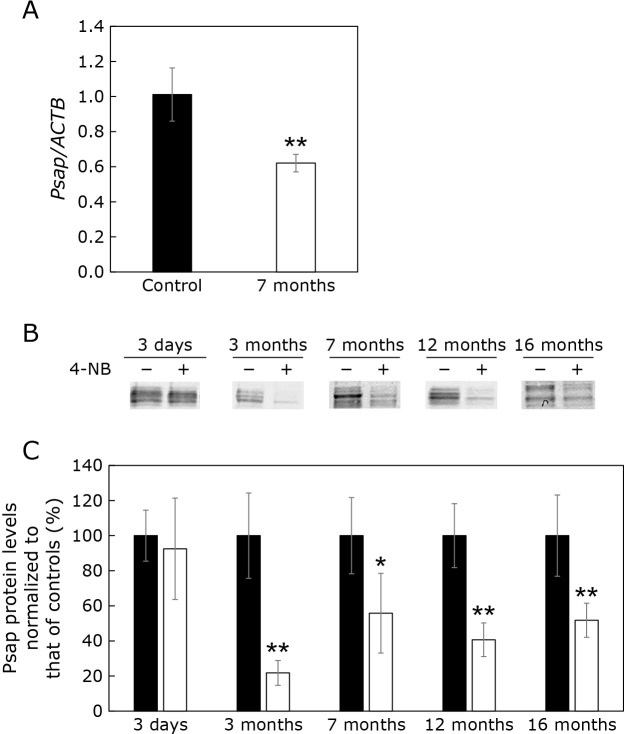
We previously reported that CoQ10 is, at least partly, bound to Psap and its derived protein saposin B.(9) Therefore, we analyzed Psap mRNA levels in cells with CoQ10 deficiency induced by 4-NB. As shown in Fig. 3A, Psap mRNA levels were reduced in cells treated with 4-NB for 7 months. We also analyzed Psap protein levels. As shown in Fig. 3B, Psap protein levels were not significantly altered after 3 days of 4-NB treatment. However, Psap levels were decreased after 3 months of 4-NB treatment, and the reduction persisted in cells treated with 4-NB for up to 16 months. Psap levels were decreased after 3 months of 4-NB treatment and the reduction persisted in cells treated with 4-NB for up to 16 months (Fig. 3C).
Fig. 3.
Effect of the 4-NB treatment on Psap mRNA and protein levels. (A) Psap mRNA levels normalized to ACTB mRNA in control cells and cells treated with 4-NB for 7 months. (B) Western blot of Psap protein in controls and cells treated with 4-NB for 3 days, 3, 7, 12, and 16 months. (C) Quantification of Psap protein levels using ImageJ. Black bars: control cells, white bars: 4-NB-treated cells. Data are expressed as mean ± SD. The statistical analysis was conducted using the Student’s t test. *p<0.05, **p<0.01 vs control.
Figure 4A shows the CoQ10 cellular levels in the absence and presence of 4-NB and/or 4-HB. 4-HB is a substrate used for CoQ10 production. The administration of 4-HB has been reported to counteract the CoQ10 deficiency induced by 4-NB.(7) As shown in Fig. 4A, CoQ10 cellular levels were reduced after the administration of 4-NB for 7 months. This reduction was prevented by the co-administration of 4-HB and 4-NB for 3 days as it resulted in similar CoQ10 levels than that in the control cell line. Figure 4A lane 4 shows the CoQ10 levels in cells treated with 4-NB for 7 months and then moved to normal medium (without 4-NB) for 3 days. These cells also contained similar CoQ10 amounts than those in control cells. As shown in Fig. 4B, Psap protein levels were reduced in 4-NB-treated cells but were similar to those of controls in cells cotreated with 4-HB or cultured without 4-NB for 3 days. These results imply that the decrease of Psap protein levels is not caused by 4-NB cytotoxicity but is rather due to the CoQ10 reduction induced by 4-NB.
Fig. 4.
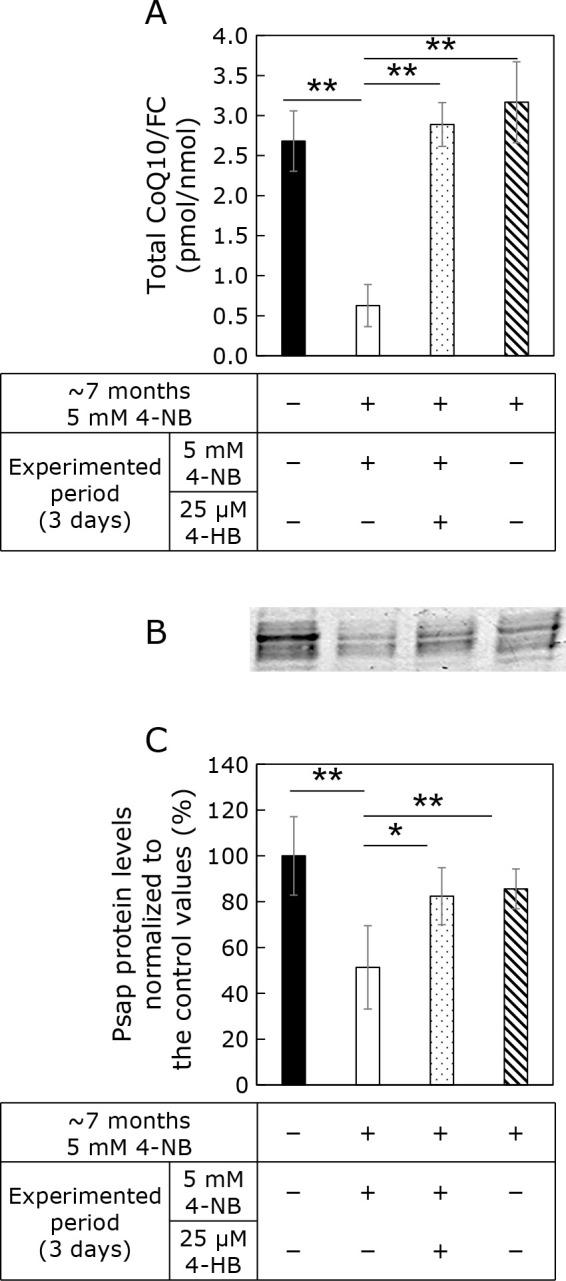
Effect of 4-NB and 4-HB treatments on CoQ10 and Psap protein levels. Cells were treated or not with 4-NB for 7 months. Then, the cells were divided into three groups: cells treated with 4-NB, cells cotreated with 4-NB and 4-HB (4-NB + 4-HB), and 4-NB removed medium. (A) CoQ10 quantification in the cells. (B) Western blot analysis of Psap. (C) Quantification of Psap protein levels using ImageJ. Data are expressed as mean ± SD. The statistical analysis was conducted by one-way analysis of variances. *p<0.05, **p<0.01 vs control.
Cellular levels of gangliosides in 4-NB-treated cells
Psap is a precursor of saposins A–D, which are non-enzymatic essential proteins metabolizing glycosphingolipids. Therefore, we analyzed ganglioside cellular levels in 4-NB-treated cells. Figure 5A shows the results of the TLC analysis. The amount of lipid linked to sialic acid was altered by 4-NB administration. Lipids positively stained with sialic acid were detected in extracts from control and 4-NB-treated cells. When GM3 was used as a marker, a positively stained band was present at the same position as GM3. The intensity of this band was reduced in 4-NB-treated cell extracts. TLC analysis of GM1, GM2 and GD under the same conditions showed staining at a lower position than that of GM3 (data not shown). Further analysis is necessary but this result suggests that the cellular levels of lipids bound to sialic acid are reduced in 4-NB-treated cell lines (Fig. 5B).
Fig. 5.
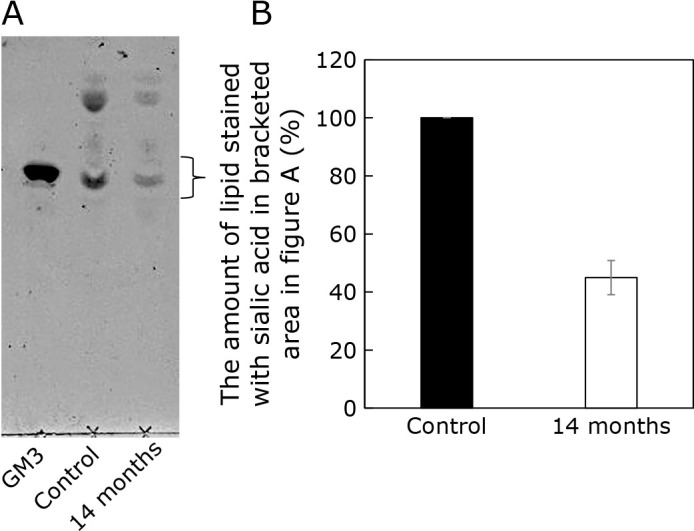
TLC analysis of lipids containing sialic acid. (A) Representative TLC plate. Lane 1: GM3 marker, Lane 2: control cell extracts, Lane 3: extract from 4-NB-treated cells. (B) Quantitative analysis of lipid sialic acid content by ImageJ. Data are expressed as mean ± SD (n = 2).
Cellular levels of nuclear transcription factor Y subunit beta (NF-YB) 4-NB-treated cells
Tharyan et al.(23) previously reported that NFYB-1 regulates the expression of Psap. Indeed, the inhibition of NFYB-1 expression caused an upregulation of Psap mRNA expression. Since we found that Psap mRNA levels were reduced in 4-NB-treated cells, we investigated the expression of NF-YB mRNA. NF-YB is a human homologue of the NFYB-1 gene in C. elegans. As shown in Fig. 6, NF-YB mRNA levels were not increased, but rather reduced, by the 4-NB treatment. Therefore, it is likely that NF-YB is not involved in the decrease of Psap mRNA mediated by 4-NB.
Fig. 6.
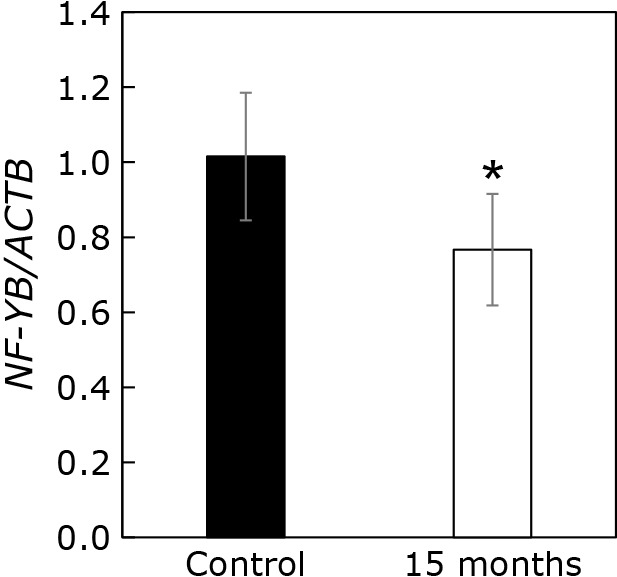
Expression level of NF-YB mRNA normalized to ACTB mRNA level. The gene expression in control (black bar) and 4-NB-treated cells (white bar) was measured by quantitative PCR. The results are shown as mean ± SD of triplicate measurements. The mean expression level was normalized to that of the control (2−ΔΔCT method). The statistical analysis was conducted with the Student’s t test. *p<0.05.
Discussion
As shown above, long-term CoQ10 deficiency reduced Psap cellular levels. In cells treated with 4-NB for 3 days, CoQ10 levels were decreased, but there was no change in Psap quantities. However, Psap levels were diminished after 3 months of 4-NB treatment and remained low after several months of 4-NB treatment. These results imply that Psap levels are decreased if CoQ10 levels are maintained chronically low, and not immediately after CoQ10 decrease. In addition, the administration of 4-HB, a substrate used for CoQ10 synthesis, suppressed the Psap decrease, suggesting that the latter was not due to a mere toxic effect of 4-NB administration, but rather to the decrease in CoQ10 levels.
Reduced cellular CoQ10 levels lowered Psap cellular amounts and perturbed glycosphingolipid cellular content. Psap plays an important role in the metabolism of sphingoglycolipids. A disease caused by mutations in the Psap gene, resulting in a lack of Psap, has been reported in at least four families worldwide.(24–27) In all reported cases, severe neurological symptoms, such as generalized convulsive seizures and marked hepatosplenomegaly, were observed immediately after birth or in early neonatal and infantile stages. The clinical features are similar to those of Gaucher disease type II (acute neurological type). Fetal death has also been reported. In those cases, the liver was found to contain ceramide, glucosylceramide, lactosylceramide, sulfatide, digalactosylceramide (digalactosylceramide), globotriaosylceramide, globoside, GM1 and GM2 gangliosides, and other glycosphingolipids.
Fujita et al.(28) generated Psap-deficient mice, which showed a phenotype very similar to that induced by Psap deficiency in humans. The birth rate of Psap-deficient mice was very low, and most of them died before or 1–2 days after birth. In 30-day-old Psap-deficient mice, various glycosphingolipids accumulated in tissues throughout the body, similarly to what was described in human cases, and many membrane-like inclusions occur in cells of the nervous and retinal systems.(13,28)
Thus, a decrease in Psap disrupts the lipid homeostasis. Here, we measured sialic acid containing lipids and showed that it was reduced in 4-NB-treated cells. A lipid positively stained for sialic acid was detected at a similar position than GM3, which was used as a marker. Therefore, we considered this band as derived from GM3. The intensity of this band was reduced by the administration of 4-NB. The analysis of the effects of 4-NB treatment on other lipids will be required in the future.
The present study showed that the long-term CoQ10 decrease reduces the amount of Psap in cells. Indeed, Psap mRNA levels were decreased in CoQ10-deficient cells. Tharyan et al.(23) reported that NFYB-1, a highly conserved histone-like transcription factor, represses the expression of Psap. In our long-term CoQ10-deficient cell model, NF-YB, NFYB-1 homolog in human, expression levels were rather decreased (Fig. 5). Therefore, the reduction of Psap mRNA levels is likely caused by mechanism(s) independent of NF-YB. Oxidative stress has been shown to increase Psap protein levels.(29,30) The oxidative stress was increased in 4-NB treated cells as judged from the levels of acrolein-bound protein and the %CoQ10 value (Fig. 2). However, Psap mRNA and protein levels were reduced. Therefore, the mechanisms mediating the effects of 4-NB treatment on Psap levels need further investigation.
In conclusion, we established a long-term CoQ10-deficient cell model by treating the cells with a CoQ10 biosynthesis inhibitor, 4-NB. The amount of intracellular CoQ10-binding protein Psap decreased with prolonged reduction of CoQ10 levels. Psap is a protein involved in the metabolism of glycosphingolipids. The amount of gangliosides also changed in cells with decreased Psap induced by prolonged CoQ10 deficiency. Further investigations are needed to understand the effects of changes in the amounts of CoQ10 and its binding protein Psap on intracellular glycolipid metabolism.
Author Contributions
Study concept and design: AF, YY, and MK; acquisition of data: HT, KS, MOkamoto, AN, TT, YF, KI, HY, and AM; interpretation of data: MOkada, AM, AF, YY, and MK; drafting of manuscript: MOkamoto, AF, YY, and MK. All authors approved the final version of this manuscript to be published.
Abbreviations
- ACTB
actin beta
- CoQ10
coenzyme Q10
- FC
free cholesterol
- 4-HB
4-hydroxybenzoate
- 4-NB
4-nitrobenzoate
- NF-YB
nuclear transcription factor Y subunit beta
- Psap
prosaposin
- TLC
thin-layer chromatography
Conflict of Interest
No potential conflicts of interest were disclosed.
References
- 1.Crane FL, Hatefi Y, Lester RL, Widmer C. Isolation of a quinone from beef heart mitochondria. Biochim Biophys Acta 1957; 25: 220–221. [DOI] [PubMed] [Google Scholar]
- 2.Turunen M, Olsson J, Dallner G. Metabolism and function of coenzyme Q. Biochim Biophys Acta 2004; 1660: 171–199. [DOI] [PubMed] [Google Scholar]
- 3.Kalén A, Appelkvist EL, Dallner G. Age-related changes in the lipid compositions of rat and human tissues. Lipids 1989; 24: 579–584. [DOI] [PubMed] [Google Scholar]
- 4.Manzar H, Abdulhussein D, Yap TE, Cordeiro MF. Cellular Consequences of Coenzyme Q10 Deficiency in Neurodegeneration of the Retina and Brain. Int J Mol Sci 2020; 21: 9299. [DOI] [PMC free article] [PubMed] [Google Scholar]
- 5.Eggens I, Elmberger PG, Löw P. Polyisoprenoid, cholesterol and ubiquinone levels in human hepatocellular carcinomas. Br J Exp Pathol 1989; 70: 83–92. [PMC free article] [PubMed] [Google Scholar]
- 6.Dallner G, Sindelar PJ. Regulation of ubiquinone metabolism. Free Radic Biol Med 2000; 29: 285–294. [DOI] [PubMed] [Google Scholar]
- 7.Quinzii CM, Tadesse S, Naini A, Hirano M. Effects of inhibiting CoQ10 biosynthesis with 4-nitrobenzoate in human fibroblasts. PLoS One 2012; 7: e30606. [DOI] [PMC free article] [PubMed] [Google Scholar]
- 8.Forsman U, Sjöberg M, Turunen M, Sindelar PJ. 4-Nitrobenzoate inhibits coenzyme Q biosynthesis in mammalian cell cultures. Nat Chem Biol 2010; 6: 515–517. [DOI] [PubMed] [Google Scholar]
- 9.Jin G, Kubo H, Kashiba M, et al. Saposin B is a human coenzyme q10-binding/transfer protein. J Clin Biochem Nutr 2008; 42: 167–174. [DOI] [PMC free article] [PubMed] [Google Scholar]
- 10.O'Brien JS, Kishimoto Y. Saposin proteins: structure, function, and role in human lysosomal storage disorders. FASEB J 1991; 5: 301–308. [DOI] [PubMed] [Google Scholar]
- 11.Kashiba M, Terashima M, Sagawa T, Yoshimura S, Yamamoto Y. Prosaposin knockdown in Caco-2 cells decreases cellular levels of coenzyme Q10 and ATP, and results in the loss of tight junction barriers. J Clin Biochem Nutr 2017; 60: 81–85. [DOI] [PMC free article] [PubMed] [Google Scholar]
- 12.Kashiba M, Oizumi M, Suzuki M, et al. Prosaposin regulates coenzyme Q10 levels in HepG2 cells, especially those in mitochondria. J Clin Biochem Nutr 2014; 55: 85–89. [DOI] [PMC free article] [PubMed] [Google Scholar]
- 13.Doering T, Holleran WM, Potratz A, et al. Sphingolipid activator proteins are required for epidermal permeability barrier formation. J Biol Chem 1999; 274: 11038–11045. [DOI] [PubMed] [Google Scholar]
- 14.Matsuda J, Yoneshige A, Suzuki K. The function of sphingolipids in the nervous system: lessons learnt from mouse models of specific sphingolipid activator protein deficiencies. J Neurochem 2007; 103 Suppl 1: 32–38. [DOI] [PubMed] [Google Scholar]
- 15.Yamashita T. Recent advances in the study of glycosphingolipids. Curr Pharm Biotechnol 2012; 13: 2663–2668. [DOI] [PubMed] [Google Scholar]
- 16.Eich C, Manzo C, de Keijzer S, et al. Changes in membrane sphingolipid composition modulate dynamics and adhesion of integrin nanoclusters. Sci Rep 2016; 6: 20693. [DOI] [PMC free article] [PubMed] [Google Scholar]
- 17.Muthusamy T, Cordes T, Handzlik MK, et al. Serine restriction alters sphingolipid diversity to constrain tumour growth. Nature 2020; 586: 790–795. [DOI] [PMC free article] [PubMed] [Google Scholar]
- 18.Russo D, Della Ragione F, Rizzo R, et al. Glycosphingolipid metabolic reprogramming drives neural differentiation. EMBO J 2018; 37: e97674. [DOI] [PMC free article] [PubMed] [Google Scholar]
- 19.Okamoto M, Shimogishi M, Nakamura A, et al. Differentiation of THP-1 monocytes to macrophages increased mitochondrial DNA copy number but did not increase expression of mitochondrial respiratory proteins or mitochondrial transcription factor A. Arch Biochem Biophys 2021; 710: 108988. [DOI] [PubMed] [Google Scholar]
- 20.Livak KJ, Schmittgen TD. Analysis of relative gene expression data using real-time quantitative PCR and the 2−ΔΔCT method. Methods 2001; 25: 402–408. [DOI] [PubMed] [Google Scholar]
- 21.Nagase M, Yamamoto Y, Mitsui J, Tsuji S. Simultaneous detection of reduced and oxidized forms of coenzyme Q10 in human cerebral spinal fluid as a potential marker of oxidative stress. J Clin Biochem Nutr 2018; 63: 205–210. [DOI] [PMC free article] [PubMed] [Google Scholar]
- 22.Bollmann G. N-acetylneuraminic acid estimation in human serum by neuraminidase and resorcinol/ferric(III) chloride reagent in hydrochloric solution. Eur J Clin Chem Clin Biochem 1994; 32: 37–40. [PubMed] [Google Scholar]
- 23.Tharyan RG, Annibal A, Schiffer I, et al. NFYB-1 regulates mitochondrial function and longevity via lysosomal prosaposin. Nat Metab 2020; 2: 387–396. [DOI] [PubMed] [Google Scholar]
- 24.Schnabel D, Schröder M, Fürst W, et al. Simultaneous deficiency of sphingolipid activator proteins 1 and 2 is caused by a mutation in the initiation codon of their common gene. J Biol Chem 1992; 267: 3312–3315. [PubMed] [Google Scholar]
- 25.Bradová V, Smíd F, Ulrich-Bott B, Roggendorf W, Paton BC, Harzer K. Prosaposin deficiency: further characterization of the sphingolipid activator protein-deficient sibs. Multiple glycolipid elevations (including lactosylceramidosis), partial enzyme deficiencies and ultrastructure of the skin in this generalized sphingolipid storage disease. Hum Genet 1993; 92: 143–152. [DOI] [PubMed] [Google Scholar]
- 26.Hulková H, Cervenková M, Ledvinová J, et al. A novel mutation in the coding region of the prosaposin gene leads to a complete deficiency of prosaposin and saposins, and is associated with a complex sphingolipidosis dominated by lactosylceramide accumulation. Hum Mol Genet 2001; 10: 927–940. [DOI] [PubMed] [Google Scholar]
- 27.Elleder M, Jerábková M, Befekadu A, et al. Prosaposin deficiency—a rarely diagnosed, rapidly progressing, neonatal neurovisceral lipid storage disease. Report of a further patient. Neuropediatrics 2005; 36: 171–180. [DOI] [PubMed] [Google Scholar]
- 28.Fujita N, Suzuki K, Vanier MT, et al. Targeted disruption of the mouse sphingolipid activator protein gene: a complex phenotype, including severe leukodystrophy and wide-spread storage of multiple sphingolipids. Hum Mol Genet 1996; 5: 711–725. [DOI] [PubMed] [Google Scholar]
- 29.Panigone S, Bergomas R, Fontanella E, et al. Up-regulation of prosaposin by the retinoid HPR and its effect on ceramide production and integrin receptors. FASEB J 2001; 15: 1475–1477. [DOI] [PubMed] [Google Scholar]
- 30.Toyofuku T, Nojima S, Ishikawa T, et al. Endosomal sorting by Semaphorin 4A in retinal pigment epithelium supports photoreceptor survival. Genes Dev 2012; 26: 816–829. [DOI] [PMC free article] [PubMed] [Google Scholar]


