

Abstract
Background & aims:
While many studies revealed transcriptomic subtypes of hepatocellular carcinoma (HCC), concordance of the subtypes are not fully examined. We aim to examine consensus of transcriptomic subtypes and correlate them with clinical outcomes.
Approach and results:
By integrating 16 previously established genomic signatures for HCC subtypes, we identified 5 clinically and molecularly distinct consensus subtypes. STM (STeM) is characterized by high stem cell features, vascular invasion, and poor prognosis. CIN (Chromosomal INstability) has moderate stem cell features but high genomic instability and low immune activity. IMH (IMmune High) is characterized by high immune activity. BCM (Beta-Catenin with high Male predominance) is characterized by prominent β-catenin activation, low miRNA expression, hypomethylation, and high sensitivity to sorafenib. DLP (Differentiated and Low Proliferation) is differentiated with high HNF4A activity. We also developed and validated a robust predictor of consensus subtype with 100 genes (PICS100) and demonstrated that 5 subtypes were well conserved in patient derived xenograft (PDX) models and cell lines. By analyzing serum proteomic data from the same patients, we further identified potential serum biomarkers that can stratify patients into subtypes.
Conclusions:
Five HCC subtypes are correlated with genomic phenotypes and clinical outcomes and highly conserved in pre-clinical models, providing a framework for selecting the most appropriate models for preclinical studies.
Keywords: liver cancer, hepatocellular carcinoma, gene expression profile, consensus subtypes, sorafenib, patient derived xenograft model, cancer immune activity
Graphical Abstract

Introduction
Hepatocellular carcinoma (HCC) represents about 75% of primary liver cancer, the seventh most common cancer globally.(1) HCC development is a multistep process involving the accumulation of genetic and epigenetic changes in cancer-related genes, such as oncogenes and tumor suppressor genes, and the resultant altered expression of their downstream target genes.(2, 3) HCC is a highly heterogeneous disease, as reflected by its different clinical courses. Stratifying HCC tumors into clinically and molecularly homogeneous subgroups could significantly improve treatment selection by physicians. Thus, researchers have devoted considerable effort to establishing such stratification methods by applying various approaches.(4) These approaches have included genomic or transcriptomic profiling; however, substantial gaps in translating subtypes into clinical practice remain.
Although many of the transcriptomic subtypes of HCC that have been discovered are clinically relevant, their translation to the clinic has been hampered by discrepant results, which are probably due to differences in technological platforms, patient populations, the preparation and processing of samples, and classification algorithms among studies. However, there is considerable overlap among the subtypes identified by previous studies. For example, the hepatic stem cell subtype is a subset of the poor-prognosis National Cancer Institute proliferation (NCIP) subtype and is highly similar to isocitrate dehydrogenase—like subtypes,(5, 6) and the β-catenin subtype is a subset of Hoshida’s S3 subtype.(7) Such similarities are outwardly superficial but nonetheless suggest that, among the different classification methods, there are consensus subtypes of HCC that are clinically and biologically homogenous. Finding such consensus subtypes would greatly benefit patients to receive the most appropriate treatment and researchers to uncover the underlying biology of subtypes that will lead to better selection of therapeutic targets. In the present study, we integrated information about previously identified HCC subtypes to examine consensus of the subtypes and uncover distinct transcriptomic subtypes correlated with clinical outcomes.
Materials and methods
Gene expression data from HCC tumors.
Gene expression data from the National Cancer Institute (NCI) cohort were generated in earlier studies (5, 8, 9) and the data are publicly available from the National Center for Biotechnology Information (NCBI)’s Gene Expression Omnibus (GEO) database (GSE1898 and GSE4024). Gene expression data from University of Hong Kong (UHK), Heptromic, Korea, Samsung, Modena, Fudan, and Zhongshan cohorts have been described previously and are available from the NCBI’s GEO database (accession numbers, GSE14520, GSE25097, GSE63898, GSE16757, GSE43619, GSE36376, and GSE54236) and the National Omics Data Encyclopedia (NODE) database (OEP000321).(10–19) TCGA RNA sequencing data for HCC was downloaded from the University of California, Santa Cruz, Genomics Institute (https://xenabrowser.net/).(6) FPKM-normalized data were log-transformed. All data sets are listed in supplementary Table S1.
Liver cancer subtypes, associated gene expression signatures, and application of the signatures.
All subtypes are described in supporting information and listed in supplementary Table S2. The BRB Array Tools software program (http://linus.nci.nih.gov/BRB-ArrayTools.html) was used for the construction of a prediction model.(20) A heatmap was generated using the Cluster and TreeView software programs,(21) and further statistical analysis was performed using the R software environment (http://www.r-project.org). MBatch algorithm (v. 1.4.1) is applied to correct batch effect in gene expression data sets used for analysis. MBatch algorithm is previously published in pan-cancer analysis of TCGA data and available at GitHub (https://github.com/MD-Anderson-Bioinformatics/BatchEffectsPackage).(22) To estimate baseline difference, we used dispersion separability criterion (DSC) that is a metric for quantifying the extent of batch effects in ‘omic data sets, and is computed as the ratio of the average distance between batch centroids and the global mean (D between) and the average distance between samples belonging to the same batch (D within).(23)
Cluster of clusters approach (COCA) and predictor of integrated consensus subtype with 100 genes (PICS100).
A COCA algorithm and PICS100 were applied and developed as described in supplementary method. R script for PICS100 is available in GitHub (https://github.com/kasaha1/PICS100). In addition, web-based PICS100 predictor is also available through Shiny web server (https://kasaha1.shinyapps.io/pics100/).
Other detailed methodologies, subsequent data analysis, and functional characterization are included in the supporting information.
Results
Discovery and validation of consensus subtypes of human HCC
The strategy and workflow of our analysis are shown in Fig. 1A. Datasets were divided into a discovery set (n=1006) and validation set (n=748; Supporting Table S1). After stratifying HCC tumors in the discovery set according to 16 subtyping algorithms (Supporting Table S2, Fig. S1 and S2), cluster-of-clusters assignment (COCA) (24) was applied to integrated data and the analysis revealed 5 consensus subtypes (A, B, C, D, and E) (Fig. 1B and Supporting Fig. S3). Importantly, the 5 subtypes were significantly associated with patient prognosis (P=3.1 × 10⁻⁵, log-rank test; Fig. 1C).
Fig. 1. Consensus subtypes of HCC discovered by cluster-of-clusters assignment analysis of previously recognized molecular and genomic subtypes.

A, Schematic diagram of the study strategy. Briefly, subtype information from the 16 subtyping algorithms was converted to the binary vectors (tumor samples in columns and subtype information in rows) and tumors were re-grouped according to those vectors by applying COCA. Consensus subtypes were further validated in the validation data set.
B, Heatmap and hierarchical dendrogram of the consensus subtypes. HCC tumors were subgrouped according to the shared features of independently discovered molecular subtypes. Tumors from 4 HCC cohorts (NCI, TCGA, UHK, and Heptromic cohorts, n=1006) were stratified using 16 genomic classification methods, and subtype information was used for the COCA analysis. Columns represent HCC tumors, and rows represent molecular subtypes from the 16 classification methods.
C, Clinical significance of the 5 consensus subtypes of HCC in the training cohorts. OS, overall survival. Tables at bottom shows p-values from pair-wise comparison of subtypes.
We selected subtype-specific gene expression signatures comprising 100 genes for each of the 5 subtypes (Supporting Table S3) and further selected 20 genes per subtype for construction of prediction model (Supporting Fig. S4, Fig. 2A, left, and Fig. S5A). For validation of the 5 subtypes, we constructed “predictor of integrated consensus subtype with 100 genes” (PICS100) and applied it to the validation set (Supporting Fig. S5B).(25, 26) It revealed that the 5 consensus subtypes were significantly associated with prognosis (P=2.0 × 10⁻⁹, log-rank test; Fig. 2A, B). Prognosis of subtypes is further validated in an additional independent cohort (Zhongshan hospital cohort, n = 159) (Fig. S5B). (16) In agreement with the association of subtypes with prognosis, subtype A had the highest 65-gene recurrence risk score (RS65) (11) in both the TCGA and validation cohorts (Fig. 2C).
Fig. 2. Validation of the 5 consensus subtypes of HCC.

A, Expression patterns of the prediction signatures for the 5 consensus subtypes of HCC in the TCGA and validation cohorts.
B, Prognostic significance of the consensus subtypes in the validation cohort (P=2.0× 10⁻⁷, log-rank test, n=748). Tables at bottom shows p-values from pair-wise comparison of subtypes.
C, Recurrence risk scores for the 5 subtypes in the TCGA and validation cohorts. In the box plots, the boundary of the box indicates the 25th to 75th percentile, a black line within the box marks the mean. Whiskers above and below the box indicate the 10th and 90th percentiles.
Molecular characteristics of consensus subtypes
Genes in PICS100 reflected hepatic cellular physiology well. KRT19, one of the best known markers of hepatic stem cells and progenitor cells,(27) was expressed exclusively in subtype A (Supporting Fig. S6A). Likewise, the stem cell factor LIF was highly expressed in subtype A,(28) suggesting that subtype A cancer cells are derived from hepatic stem cells or gain stem characteristics through genetic or epigenetic alterations. Subtype B was characterized by high expression of AFP, another marker of hepatic progenitor cells and a HCC marker,(29) indicating that subtype B cancer cells may also have stem cell characteristics. Interestingly, when the gene expression signatures of early (10-week) and late (17-week) human fetal hepatoblasts were applied to HCC tumors, subtype A was most strongly associated with early hepatoblasts, whereas subtype B was most strongly associated with late hepatoblasts (Supporting Fig. S6A), suggesting that subtypes A and B share hepatic stem cell characteristics but have different degrees of stemness. In good agreement with subtype B’s similarity to late fetal hepatoblasts, AFP expression was highest in late fetal hepatoblasts (Supporting Fig. S6B). Interestingly, the pattern of IGF2 expression, which was highest in subtype B and late fetal hepatoblasts, was highly similar to that of AFP expression (Supporting Fig. S6A), suggesting that IGF2 plays functional roles in subtype B. Subtype C was characterized by the high expression of immune-related genes such as CCL19, CCL21, IR7R, and DARC, suggesting that the basal immune reactivity of subtype C is higher than that of other subtypes. Subtype D had very high expression of RHBG and GLUL, which are hepatic-specific targets of β-catenin,(30) suggesting that β-catenin is activated in subtype D. Subtype E was characterized by the expression of hepatic metabolic genes such as GLS2, TAT, THRSP, and LPA, suggesting that subtype E was most differentiated of the 5 subtypes, as reflected by its best prognosis (Fig. 2B,C).
To uncover activated pathways and key upstream regulators in each subtype, we expanded the number of subtype-specific genes to 500 (representing the most significant top 100 genes per subtype; Supporting Table S3). Gene network analysis via Ingenuity Pathway Analysis revealed that the subtype A was characterized by the activation of the FOS and JUN transcription factors (Supporting Table S4 and Fig. S7A). Subtype B was characterized by MYC activation (Supporting Fig. S7B). Many of the upstream regulators in subtype C were regulators of the immune system (Supporting Fig. S7C). As predicted earlier, CTNNB1 was the most highly activated upstream regulator in subtype D (Supporting Fig. S7D). Hepatic transcription regulator HNF4A was highly activated in subtype E (Supporting Fig. S7E), further supporting that subtype E tumors were the most differentiated ones.
Genomic, epigenomic, and proteomic characteristics of the consensus subtypes
While there were no significant differences in mutation rates among the 5 subtypes (Fig. 3A), copy number alterations were significantly different among the subtypes, with subtype B having the most (Fig. 3B). Subtype B was characterized by the deletion of 1p, 4q, and 16q and the amplification of 8q and 20p (Fig. 3C). We next sought to identify mutations significantly associated with the subtypes (Fig. 3D). TP53 mutations are highest in subtype A (Supporting Fig. S8). Subtype A was associated with BAP1 and FAM47A mutations. Subtype B was associated with ARID1A, AXIN1, and RPS6KA3 mutations. Subtype D was associated with CTNNB1 (encoding β-catenin) mutations (85%, P=1.3 × 10⁻³², χ2 test).
Fig. 3. Genomic alterations associated with the consensus subtypes of HCC in the TCGA cohort.

A, Numbers of nonsynonymous mutations in the HCC subtypes (n=367).
B, Copy number alteration (CNA) scores, which were defined by the summation of the absolute values of each tumor’s GISTIC2 score, in the subtypes (n=361). Subtype B had significantly more alterations than the other subtypes did (P<0.001, Student t-test, for all comparisons)
C, Heat map of CNAs in the 22 autosomes in the 5 subtypes. Red and blue indicate chromosome copy number gains and losses, respectively.
D, Non-silent mutation rates for individual tumors (top); sex and grade details (middle), and genes with mutation rates more than 3% (bottom). Mutation types are indicated in the legend at the bottom. P values (χ2 test) describe associations between the mutations and consensus subtypes. Red indicates genes significantly associated with the subtypes (P<0.05).
An analysis of TCGA data revealed subtype-specific methylation patterns (Supporting Fig. S9A). Most strikingly, subtype D was associated with regional hypomethylation, indicating a potential connection between β-catenin activation and methylation in HCC. Subtype A was associated with hypermethylation, whereas subtype E showed methylation patterns similar to those of surrounding normal livers. Because DNA methylation status is balanced by DNA methyltransferases (DNMT1, DNMT3A, and DNMT3B) and demethylating enzymes (TET1, TET2, and TET3),(31) we assessed their expression. Subtype D had significantly lower DNMT1 expression, suggesting that low DNMT1 expression might account for hypomethylation in subtype D (P<0.001, Student t-test; Supporting Fig. S9B). Validating these observations, in the test cohort, subtype D had significantly lower DNMT1 expression (Supporting Fig. S9C).
Some results of our analysis of miRNA expression data are shown in Supporting Fig. S10A and Table S5. Subtype D was characterized by the downregulation of miRNA expression, whereas subtype B was characterized by its upregulation. As with their methylation patterns, subtypes C and E lacked subtype-specific miRNAs. The mean miRNA expression level was highly concordant with subtype-specific analysis. Subtype D had the lowest, and subtype B had the highest, mean miRNA expression (Supporting Fig. S10B). Interestingly, the expression of DICER1, a rate-limiting enzyme for producing miRNAs,(32) was lowest in subtype D (Supporting Fig. S10C). Furthermore, DICER1 expression was significantly correlated with mean miRNA expression (Supporting Fig. S10D).
Reverse phase protein array analysis revealed subtypes A and D to have highly distinctive proteomic characteristics (Supporting Fig. S11). In agreement with its poor prognosis and high proliferation features, subtype A had high expression of several kinases, including SYK, ERK2 (MAPK1), LCK, GSK3, p38 (MAPK14), and SRC, as well as anti-apoptotic proteins, including Bcl-xL (BCL2L1). Subtype D was characterized by the high expression of genome stability genes such as TP53, MSH2, and SETD2.
Hematoxylin and eosin staining analysis of tumors in the TCGA cohort revealed subtype A to have the lowest tumor purity, suggesting a strong stromal cell−cancer cell interaction in the subtype; genome-based estimations of tumor purity (ABSOLUTE(33) and ESTIMATE(34)) and an integrated model (consensus measurement of purity estimation [CPE] (35)) yielded consistent results (Supporting Fig. S12). ABSOLUTE, ESTIMATE, and CPE also revealed subtype C to have relatively low purity.
Clinical significance of consensus subtypes
We assessed the association of consensus subtypes with clinical variables in the Samsung cohort, for which the most extensive clinical data were available (Supporting Table S6). Not surprisingly, microvascular invasion was significantly associated with consensus subtype. Poor-prognosis subtype A had the highest rate of microvascular invasion (85.7%), whereas subtypes D and E, which have better prognoses, had lower rates of microvascular invasion (41.4% and 45.1%, respectively). The subtypes had similar associations with intrahepatic metastasis. Edmonson grade and T stage were associated with subtype, but tumor size was not. Barcelona Clinic Liver Cancer stage was not associated with consensus subtype. Importantly, multivariate analysis showed that consensus subtypes, in particular subtype A and E, are independent prognosticators (Supporting Fig. S13). In terms of etiology, HCV infection was significantly associated with subtype D (P=0.027, χ2 test). Like mRNA expression, the serum AFP level was highest in subtype B. It is interesting to point out that patient sex was associated with subtype. Subtype D patients were predominantly men, as was the case in both the training and validation cohorts (Supporting Table S7).
Consensus subtypes in cell lines and association with sensitivity to drugs.
Because established cancer cell lines are the most practical experimental models,(36) we applied PICS100 to gene expression data from a liver cancer model repository (LIMORE) data set (37) that contains genomic and pharmacologic data from 81 liver cancer cell lines (Fig. 4A). In agreement with data from primary tumors, activation mutations of CTNNB1 were significantly associated with subtype D (P =1.1 × 10⁻⁶ by χ2-test), suggesting that cell lines recapitulate the molecular and biological characteristics of the corresponding primary HCC well. We next examined the associations of the consensus subtypes with drug-response data for the 81 cell lines by analyzing activity area data reflecting response to drugs among the cell lines. Subtype A and B cell lines are most sensitive to YM155, an inhibitor of survivin (Fig. 4B). Interestingly, subtype B with high AFP level is most sensitive to alkylating chemotherapy drug cisplatin. In contrast, subtype E is highly resistant to erastin (inducer of ferroptotic cell death).(38) Most interestingly, β-catenin active subtype D is most sensitive to sorafenib and regorafenib, current standard systemic treatments for HCC,(39, 40) suggesting a potential connection of active β-catenin to sensitivity to sorafenib and regorafenib at the molecular level.
Fig. 4. Significant association of consensus subtypes with potential treatment.
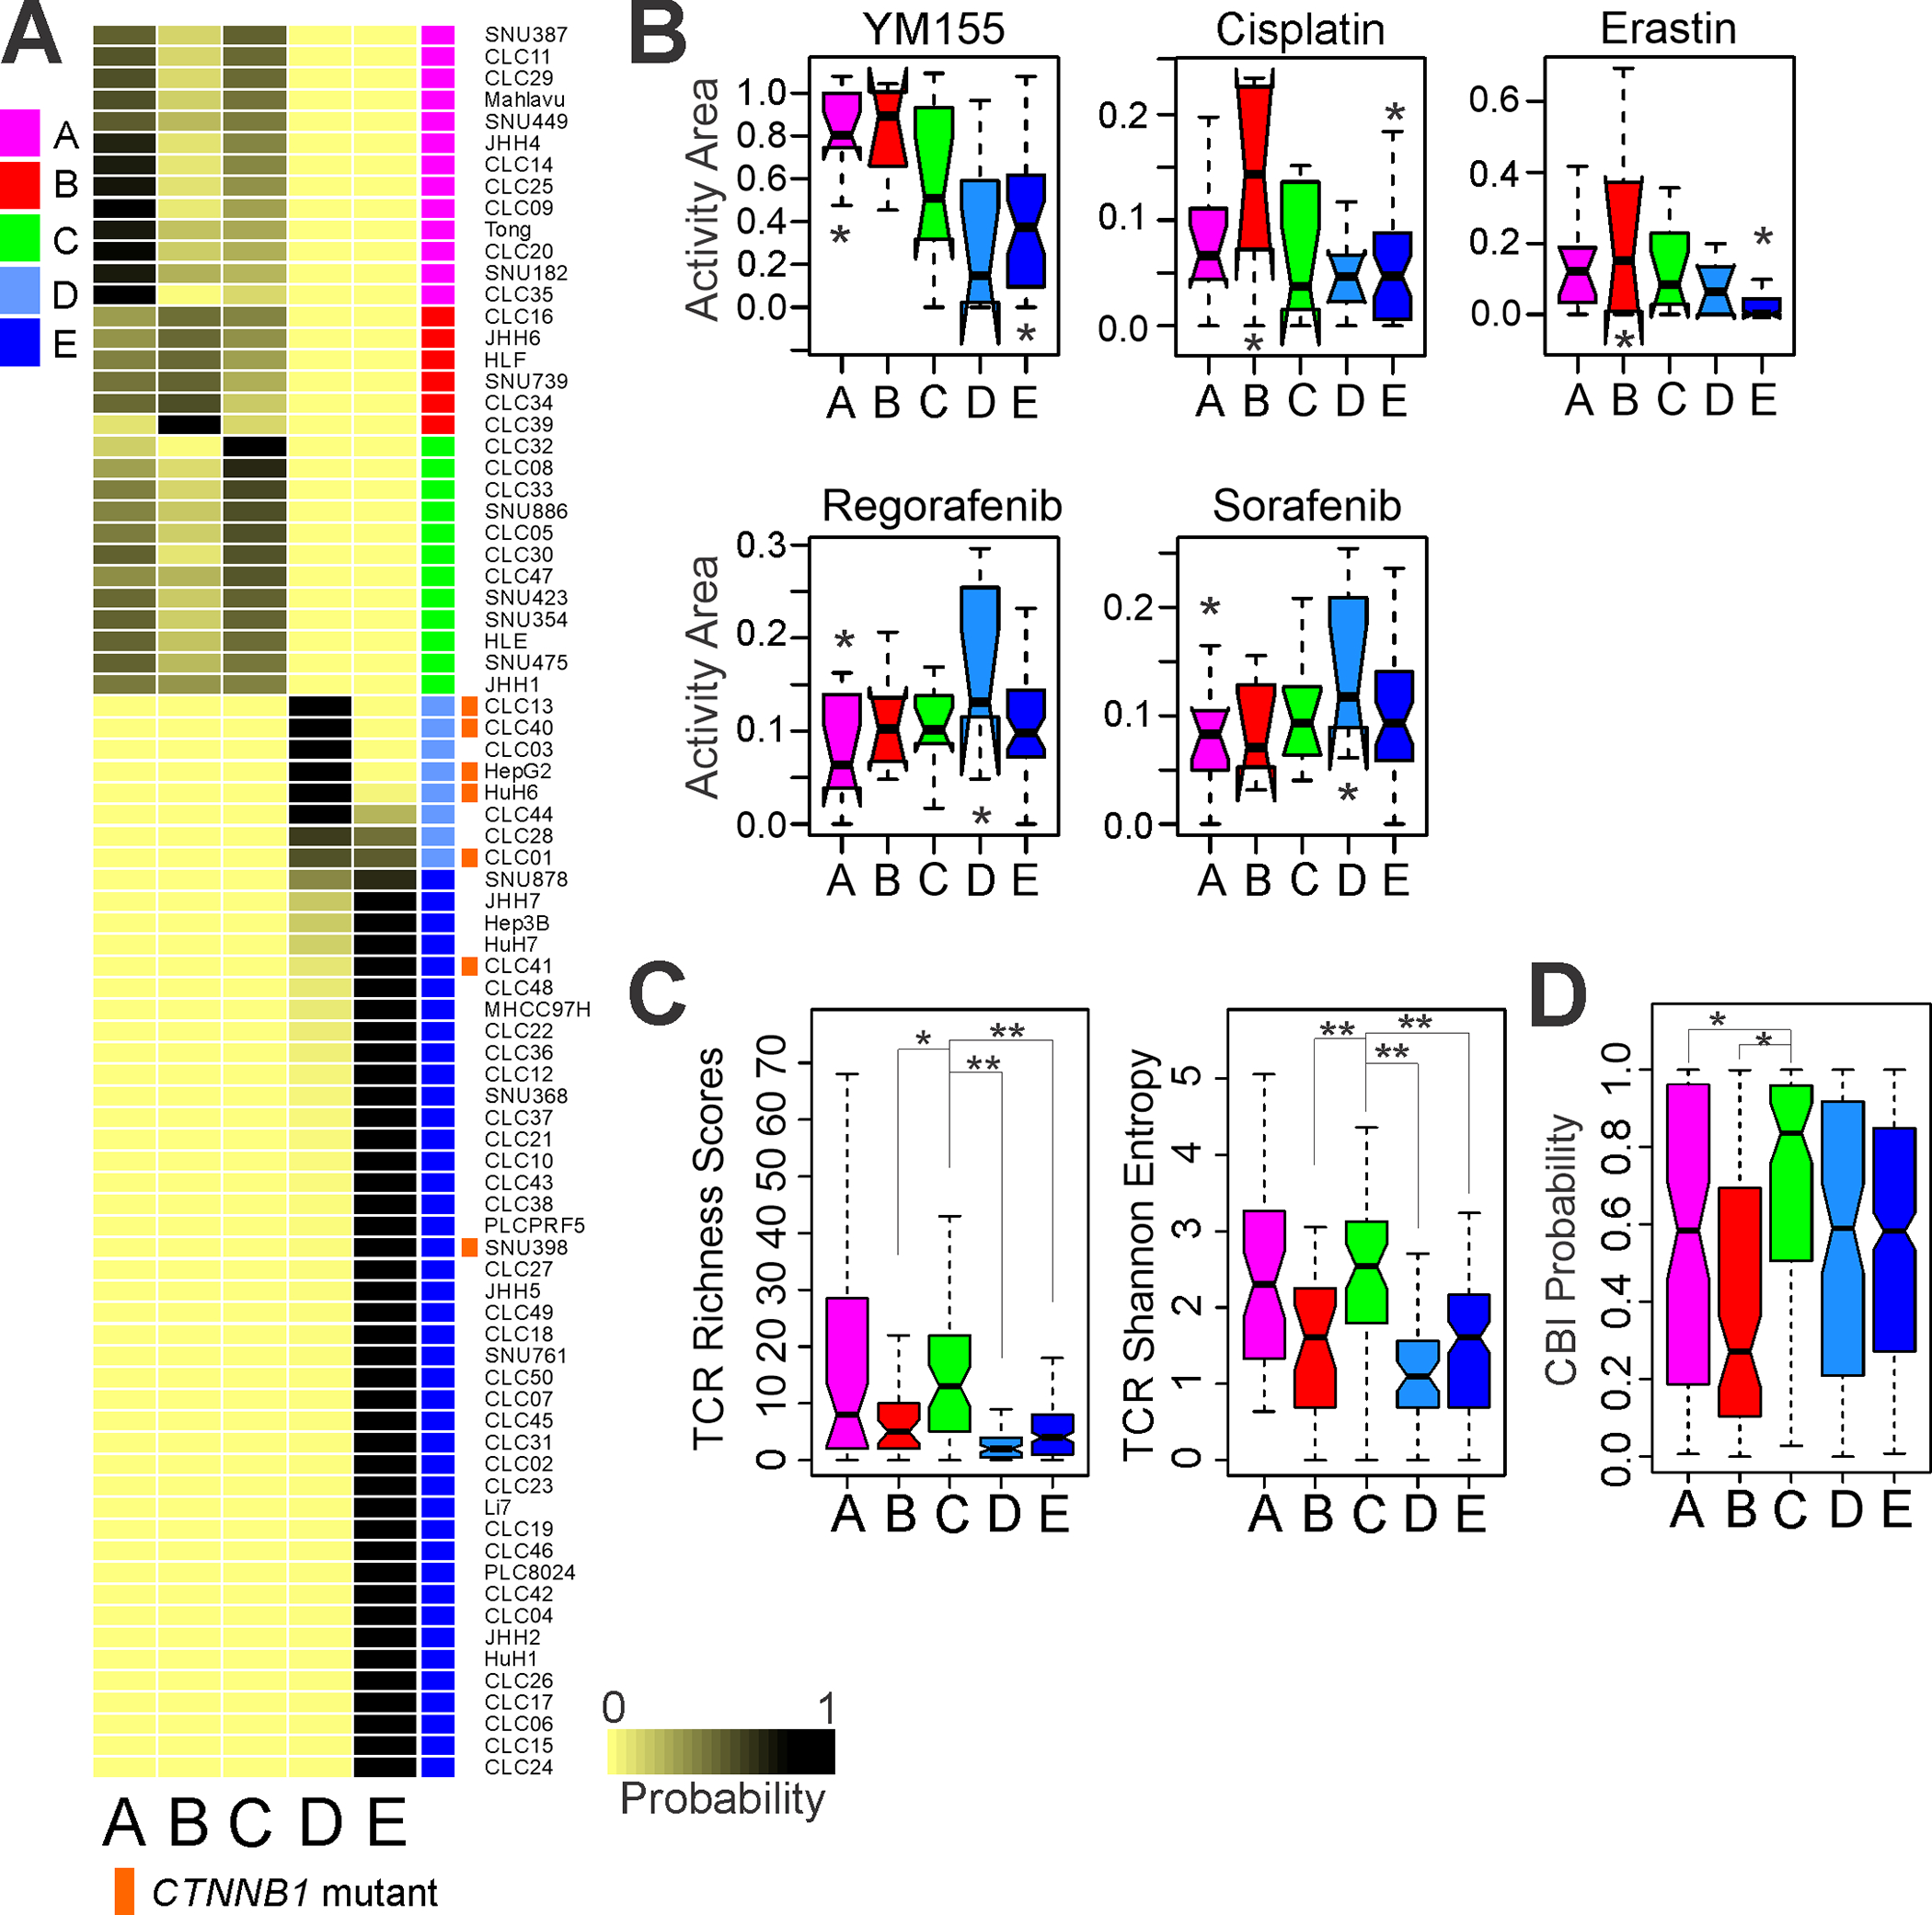
A, Consensus subtypes in liver cancer cell lines (n = 81 in LIMORE data set). Liver cancer cell lines were stratified according to PICS100 predictor. Activation mutations of CTNNB1 is significantly associated with subtype D (P=1.1 × 10⁻⁶ by χ2-test). Of 7 cell lines with mutations in CTNNB1, 5 were classified into subtype D.
B, Box plots of activity area reflecting drug response of cell lines. Significance of association was estimated by one-way ANOVA (P<0.05). * indicates two subtypes with most significant difference in pair-wise comparison by Student t-test (P<0.05).
C, Box plots of TCR diversity in HCC subtypes. Significance of association was estimated by ANOVA (P<0.001). Subtype C had the highest TCR diversity (*P<0.01, **P<0.001, Student t-test).
D, Box plots of immunotherapy response probability. Subtype C had the highest immunotherapy response probability (*P<0.01, Student t-test). In the box plots, the boundary of the box indicates the 25th to 75th percentile, a black line within the box marks the mean. Whiskers above and below the box indicate the 10th and 90th percentiles. CBI, checkpoint blockade immunotherapy.
Because antigen-specific TCR repertoire is correlated with clinical response to immune checkpoint blockade immunotherapy (CBI),(41, 42) we evaluated TCR repertoires from RNA-seq data. TCR diversity reflected in TCR richness scores and TCR Shannon entropy differed by subtypes, with the highest diversity in subtype A and C (Fig. 4C), suggesting that subtype A and C may have high baseline immune activity. In agreement with this, when we assessed each subtype’s potential response to immunotherapy using an immunotherapy response probability algorithm established previously,(43) subtype C had the highest potential immunotherapy response probability. Interestingly, subtype B, which had the highest genomic instability, had the lowest potential immunotherapy response probability (Fig. 4D). This is also in good agreement with a gene network analysis showing high immune activity in subtype C (Supporting Table S4 and Fig. S7C).
We also investigated the composition of infiltrated immune cells in tumors by using the CIBERSORT algorithm(44) that estimates relative fractions of immune cells (Supporting Fig. S14A). Interestingly, the immunoactive M1 macrophage fraction is significantly higher in subtype C (Supporting Fig. S14A, B), suggesting that M1 macrophages may contribute to the high baseline immune activity in subtype C. The high fraction of M1 macrophages in subtype C is more evident in direct comparison between subtype B and subtype C (Supporting Fig. S14C). Furthermore, the fraction of immunosuppressive M2 macrophages is higher in subtype B, suggesting that macrophages may play roles in the microenvironment of immune cells in HCC. Fraction of infiltrated CD8 cells is also substantially higher in subtype C, but less significant than M1 (Fig. S14D).
Consensus subtypes in preclinical HCC models.
We applied PICS100 to the gene expression data of 75 HCC PDX tumors (Fig. 5A). Consistent with primary HCC, activation mutations in CTNNB1 were significantly associated with subtype D (P = 1.9 × 10⁻⁶ by χ2-test). Taken together, these results suggest that intrinsic genomic characteristics within tumors are well-conserved in PDX models.
Fig. 5. Consensus subtypes of HCC in PDX models.

A, Expression patterns of PICS100 genes in HCC PDX tumors. PDX tumors (n=75) were stratified according to PICS100.
B, Mice were transplanted with PDX tumors as indicated in Materials and Methods. Mice were then randomized to treatment with vehicle (controls) or sorafenib of 50 mg/kg. P-values (Student t-test) indicate significance of difference at final measurement of tumor size.
C, Depletion of β-catenin expression decreased sorafenib sensitivity in HCC cells. Results of cell viability assays performed 48 h after sorafenib treatment in HepG2 and HuH1 cells transduced with b-catenin-silencing shRNAs (shb-cat-2, shb-cat-4) or a control shRNA against green fluorescent protein (shGFP). Cell viability after sorafenib treatment were compared using a Student t test. Data shown are means ± s.e’s. of the mean from three independent experiments. *P<0.01. **P<0.001
To examine the responses of PDX models to sorafenib, we treated PDX models with sorafenib (50mg/kg) and assessed tumor shrinkage after treatment. In agreement with cell line models, PDX tumors in subtype D were very sensitive to sorafenib (Fig. 5B), further supporting the notion of β-catenin mediated sensitivity to sorafenib in HCC. Interestingly, PDX tumors in subtype C also showed high sensitivity to sorafenib, suggesting potential additional mechanisms for sorafenib sensitivity that are not associated with β-catenin activation.
To directly test if β-catenin accounts for high sensitivity to sorafenib, we assessed sorafenib sensitivity after silencing β-catenin expression with lentiviral shRNAs in HCC cells with constitutively active β-catenin by somatic mutations (HepG2 and HuH1).(45) When β-catenin was depleted by two β-catenin-specific shRNAs, HepG2 and HuH1 cells became less sensitive to sorafenib (Fig. 5C), strongly suggesting that β-catenin regulates the sensitivity of HCC cells to sorafenib.
Subtype-specific serum biomarkers
While consensus subtypes show important clinical relevance as evidenced by significant association with survival and response to standard treatments, translation of the findings to the clinic is hampered by the lack of tissues for genomic analysis because biopsy is not mandatory for diagnosis of HCC.(46) To test feasibility of finding potential serum biomarkers associated with five subtypes, we performed pilot proteomic analysis of serum samples from HCC patients (n=45, a subset of the HCC patients in our cohort) by using targeted ELISA for 122 serum proteins. Serum proteins were considered as subtype-specific serum biomarkers when they had significantly higher levels in tumors (P < 0.01 by Student t-test) and also had a high area under the curve in receiver operating characteristics analysis for each subtype (Supporting Fig. S15 and Fig. 6). In agreement with the genomic analysis, AFP was identified as a best serum biomarker for subtype B. In addition, CA9 is identified as a potential serum biomarker for subtype. However, potential serum markers for subtype C, D, and E only showed moderate or weak association with respective subtypes. It is interesting to point out that mRNA expression of CA9 and AFP in the subtypes was highly correlated with the serum level, while the other markers showed weak correlations (Supporting Fig. S16), suggesting that parallel screening genomic and proteomic data together would improve chance to find robust biomarkers in future analysis.
Fig. 6. Subtype-specific serum markers.

A, Heatmap of standardized protein levels in serum specific to consensus subtypes in HCC patients. Subtype specific serum markers were selected according to AUC values from receiver operating characteristics (ROC) analysis. HI indicates healthy individuals with normal liver.
B, ROC plot for best biomarker showing positive predictive power for each consensus subtypes.
C, Serum levels of 5 serum markers in the consensus subtypes. In the box plots, the boundary of the box indicates the 25th to 75th percentile, a black line within the box marks the mean. Whiskers above and below the box indicate the 10th and 90th percentiles.
Discussion
By systematically integrating 15 previously established transcriptomic signatures of HCC, we identified 5 distinct subtypes (Fig. 7). Subtype A was characterized by strong stemness and hypermethylation. In agreement with a previous study demonstrating that the stem cell subtype of HCC has high AP-1 (FOS and JUN) transcription complex activity,(9) gene network analysis suggested that subtype A had the strongest activation of the FOS and JUN pathway. The aggressive phenotype of subtype A is also well-reflected by its proteomic data showing high expression of SYK, MAPK1, LCK, GSK3, MAPK14, SRC, and BCL2L1. In screening for serum markers for consensus subtype, CA-9 is identified as a potential serum marker for subtype A. That subtype A was also enriched in mutations in BAP1, a tumor suppressor with deubiquitinating enzyme activity, is also interesting, as BAP1 regulates cell proliferation and differentiation.(47)
Fig. 7. Summary of the 5 consensus subtypes of HCC.

The 5 subtypes’ differences are well-reflected by their biological and clinical characteristics. STM, stem cell; CIN, chromosome instable; IMH, immune high; BCM, beta-catenin with male predominance; DLP, differentiated and low proliferation.
Subtype B was characterized by high chromosome instability (CIN) phenotype which might account for the subtype’s unique biological and clinical features. Although CIN phenotype is one of genomic characteristics of HCC and closely associated with poor prognosis,(48) molecular subtype with high CIN phenotype was poorly defined. Thus, our analysis revealed a novel subtype that was not recognized earlier. The strong association of chromosome instability with low immune activity is in good agreement with previous studies demonstrating that tumor aneuploidy is significantly associated with immune evasion.(43). Subtype B shows high miRNA expression, which is significantly correlated with its high DICER1 expression, suggesting that some of the subtype’s phenotypes are regulated by miRNAs. High expression of IGF2 is another unique feature of subtype B. Because IGF2 in HCC might be therapeutically targetable with the anti-IGF1/2 antibody xentuzumab,(49) it will be interesting to test if subtype B tumors are more sensitive to xentuzumab in future study. The results of serum protein analysis were in good agreement with the genomic data as AFP was identified as the best serum marker for subtype B. High MYC activity in subtype B is in agreement with CIN phenotype since MYC is one of highly amplified oncogenes in HCC.(6) MYC activation may account for key biological features of subtype B as it is known to orchestrate multiple phenotypes including immune evasion.(50)
Subtype C was best characterized by its high TCR diversity and high baseline immune activity. It is interesting to point out that TCR diversity is associated with better clinical response to anti CTLA-4 and PD-1 treatments.(22, 51) Subtype C is one of two subtypes with high sensitivity to sorafenib in PDX models. Unlike subtype D, sensitivity to sorafenib is not observed in subtype C cell lines. This strongly suggests that interaction of HCC cells with stromal or endothelial cells may dictate clinically important tumor phenotypes and indicates that sensitivity to sorafenib is a complicated phenotype. This observation also suggests that cell lines may not fully recapitulate the pharmacological characteristics of primary tumors.
Subtype D had the most distinctive molecular and biological characteristics associated with clinical outcomes. The vast majority of subtype D tumors (85%) harbored somatic CTNNB1 mutations that lead to β-catenin activation and showed high expression of RHBG and GLUL, which are hepatic-specific targets of β-catenin.(30) The strong association of subtype D with β-catenin activation is repeatedly validated in cell lines and PDX models. Clinically, subtype D was associated with lower histologic grade and low microvascular invasion, which were well-reflected by the good prognosis of patients. Subtype D was also significantly associated with HCV infection. That CTNNB1 is predominantly mutated in subtype D is in good agreement with previous observations showing a significant association of CTNNB1 mutations with HCV infection.(52) Interestingly, subtype D had a significantly higher male-to-female ratio than the other subtypes. Subtype D had hypomethylated genomic DNA that might be mediated by low DNMT1 activity. One unique molecular characteristic of subtype D was miRNA downregulation. As DICER1 expression is significantly correlated with miRNA expression, low miRNA activity is likely mediated by a lack of miRNA maturation. Most interesting characteristics of subtype D is high sensitivity to sorafenib which was observed in both cell lines and PDX models. In follow-up experiments, depletion of β-catenin desensitized β-catenin active HCC cells to sorafenib, further supporting that sorafenib sensitivity is mediated by β-catenin in HCC cells. This is in agreement with our previous study demonstrating that glutamine synthetase, one of best known downstream target of β-catenin in HCC cells, is accountable for high sensitivity to sorafenib in HCC cells by increasing basal level autophagy.(53) Since sorafenib induces autophagy in HCC cells and that excessive autophagy can induce cell death,(54) our data suggested that β-catenin sensitizes HCC cells to sorafenib by inducing basal levels of autophagy.
Subtype E tumors were the most differentiated, as evidenced by their low histologic grade, low T-stage, limited microvascular invasion, and low AFP level. Gene network analysis also revealed that subtype E had higher HNF4A activity than the other subtypes did. Although subtype E showed more non-tumor, liver-like features at the gene expression and methylation level, an assessment of tumor purity showed that its tumors had no greater contamination with non-cancer tissue than the other consensus subtype tumors.
Not surprisingly, 5 consensus subtypes share genomic features of previously discovered subtypes (Supporting Fig. S17). Subtype A, B, and C share genomic features with high proliferation subtype of National Cancer Institute Proliferation (NCIP) classification while subtype D and E share them with low proliferation subtype of NCIP. Likewise, subtype A, and C share genomic features with high recurrence subtype of Seoul National University Recurrence (SNUR) classification while subtype B, D and E share them with low recurrence subtype of SNUR. It is interesting to point out that subtype B shared features with subtype A and C in NCIP classification while it shared features with subtype D and E in SNUR classification, suggesting that it is novel subtype that was not recognized by earlier studies. Subtype B has very unique CIN phenotype feature with high activation of MYC, further supporting the notion. Our PICS100 predictor is also available in the website (https://kasaha1.shinyapps.io/pics100/) with test data set for those who wish to run genomic predictor.
This study had several limitations. While subtype specific sensitivity to sorafenib in cell lines and PDX models is interestingly, these association must be further validated in more preclinical models and prospective studies. Because sorafenib sensitivity of subtype C is not consistent in cell lines and PDX models, it would require careful interpretation with caution. However, inconsistency over sorafenib sensitivity in subtype C may suggest importance of interaction between cancer cells and stromal cells in tumor mass because cell line models lack such key interaction. Regarding association of immune activity, because the association of subtypes with immune signature or markers was only moderate and tested in retrospective cohorts, it should not be extrapolated without further validation.
In summary, we identified 5 clinically distinct HCC subtypes with molecular features. On the basis of these subtypes’ genomic, molecular, and clinical characteristics, we propose naming the A subtype “STM” (STeM cell), the B subtype “CIN” (Chromosomal INstability), the C subtype “IMH” (IMmune High), the D subtype “BCM” (Beta-Catenin with high Male predominance), and the E subtype “DLP” (Differentiated and Low Proliferation). The newly identified genetic and epigenetic alterations associated with these subtypes may provide opportunities to test experimental drugs for HCC. Furthermore, the potential marker genes we identified are preserved in PDX models, providing a guiding of the selection of the most appropriate models for preclinical testing of experimental drugs.
Supplementary Material
Acknowledgments
The authors thank Joe Munch in Scientific Publications at MD Anderson for editing the manuscript.
Financial Support
This study was supported in part by National Cancer Institute grant R01-CA237327, P50-CA217674, the Duncan Cancer Prevention Research Seed Funding Program at MD Anderson Cancer Center (2016 cycle), the MD Anderson Sister Institute Network Fund (2016 and 2019 cycles), and the National Institutes of Health through MD Anderson’s Cancer Center Support Grant P30 CA016672. S.H.L. was supported by Severance Research Initiative (SRI) project in Yonsei University College of Medicine. Acquisition of blood samples was supported by grants CA165076, the Mayo Clinic Cancer Center (P30-CA015083), and Mayo Clinic Hepatobiliary SPORE (P50-CA210964) to L.R.R.
Abbreviation used in this paper
- HCC
Hepatocellular Carcinoma
- STM
STeM
- CIN
Chromosomal Instability
- IMH
IMmune High
- BCM
Beta-Catenin with high Male
- DLP
Differentiated and Low Proliferation
- PICS100
Predictor of consensus subtype with 100 genes
- COCA
Cluster-of-clusters assignment
- TCGA
The Cancer Genome Atlas
- RS65
Recurrence risk score with 65 genes
- CPE
Consensus measurement of purity estimation
- LIMORE
Liver cancer model repository
- PDX
Patient derived xenograft
Footnotes
Conflict of interests
The authors declare that they have no conflict of interests.
Availability of data and materials
Raw and processed gene expression data are available under GSE1898, GSE4024, GSE14520, GSE25097, GSE63898, GSE16757, GSE43619, GSE36376, and GSE54236 at NCBI’s GEO database and OEP000321 at the National Omics Data Encyclopedia (NODE) database. Genomic and proteomic data from TCGA project are available from the University of California, Santa Cruz, Genomics Institute (https://xenabrowser.net/).
REFERENCES
- 1.Forner A, Llovet JM, Bruix J. Hepatocellular carcinoma. Lancet 2012;379:1245–1255. [DOI] [PubMed] [Google Scholar]
- 2.Marquardt JU, Andersen JB, Thorgeirsson SS. Functional and genetic deconstruction of the cellular origin in liver cancer. Nat Rev Cancer 2015;15:653–667. [DOI] [PubMed] [Google Scholar]
- 3.Lee JS. The mutational landscape of hepatocellular carcinoma. Clin Mol Hepatol 2015;21:220–229. [DOI] [PMC free article] [PubMed] [Google Scholar]
- 4.Lee JS. Genomic profiling of liver cancer. Genomics Inform 2013;11:180–185. [DOI] [PMC free article] [PubMed] [Google Scholar]
- 5.Lee JS, Chu IS, Heo J, Calvisi DF, Sun Z, Roskams T, Durnez A, et al. Classification and prediction of survival in hepatocellular carcinoma by gene expression profiling. Hepatology 2004;40:667–676. [DOI] [PubMed] [Google Scholar]
- 6.TCGA. Comprehensive and Integrative Genomic Characterization of Hepatocellular Carcinoma. Cell 2017;169:1327–1341. [DOI] [PMC free article] [PubMed] [Google Scholar]
- 7.Hoshida Y, Nijman SM, Kobayashi M, Chan JA, Brunet JP, Chiang DY, Villanueva A, et al. Integrative transcriptome analysis reveals common molecular subclasses of human hepatocellular carcinoma. Cancer Res 2009;69:7385–7392. [DOI] [PMC free article] [PubMed] [Google Scholar]
- 8.Lee JS, Chu IS, Mikaelyan A, Calvisi DF, Heo J, Reddy JK, Thorgeirsson SS. Application of comparative functional genomics to identify best-fit mouse models to study human cancer. Nat Genet 2004;36:1306–1311. [DOI] [PubMed] [Google Scholar]
- 9.Lee JS, Heo J, Libbrecht L, Chu IS, Kaposi-Novak P, Calvisi DF, Mikaelyan A, et al. A novel prognostic subtype of human hepatocellular carcinoma derived from hepatic progenitor cells. Nature Medicine 2006;12:410–416. [DOI] [PubMed] [Google Scholar]
- 10.Dong B, Lee JS, Park YY, Yang F, Xu G, Huang W, Finegold MJ, et al. Activating CAR and beta-catenin induces uncontrolled liver growth and tumorigenesis. Nat Commun 2015;6:5944. [DOI] [PMC free article] [PubMed] [Google Scholar]
- 11.Kim SM, Leem SH, Chu IS, Park YY, Kim SC, Kim SB, Park ES, et al. Sixty-five gene-based risk score classifier predicts overall survival in hepatocellular carcinoma. Hepatology 2012;55:1443–1452. [DOI] [PMC free article] [PubMed] [Google Scholar]
- 12.Sohn BH, Shim JJ, Kim SB, Jang KY, Kim SM, Kim JH, Hwang JE, et al. Inactivation of Hippo Pathway Is Significantly Associated with Poor Prognosis in Hepatocellular Carcinoma. Clinical Cancer Research 2016;22:1256–1264. [DOI] [PMC free article] [PubMed] [Google Scholar]
- 13.Park YY, Sohn BH, Johnson RL, Kang MH, Kim SB, Shim JJ, Mangala LS, et al. Yes-associated protein 1 and transcriptional coactivator with PDZ-binding motif activate the mammalian target of rapamycin complex 1 pathway by regulating amino acid transporters in hepatocellular carcinoma. Hepatology 2016;63:159–172. [DOI] [PMC free article] [PubMed] [Google Scholar]
- 14.Villa E, Critelli R, Lei B, Marzocchi G, Camma C, Giannelli G, Pontisso P, et al. Neoangiogenesis-related genes are hallmarks of fast-growing hepatocellular. Gut 2016;65:861–869. [DOI] [PubMed] [Google Scholar]
- 15.Villanueva A, Portela A, Sayols S, Battiston C, Hoshida Y, Mendez-Gonzalez J, Imbeaud S, et al. DNA methylation-based prognosis and epidrivers in hepatocellular carcinoma. Hepatology 2015;61:1945–1956. [DOI] [PMC free article] [PubMed] [Google Scholar]
- 16.Gao Q, Zhu H, Dong L, Shi W, Chen R, Song Z, Huang C, et al. Integrated Proteogenomic Characterization of HBV-Related Hepatocellular Carcinoma. Cell 2019;179:1240. [DOI] [PubMed] [Google Scholar]
- 17.Sung WK, Zheng H, Li S, Chen R, Liu X, Li Y, Lee NP, et al. Genome-wide survey of recurrent HBV integration in hepatocellular carcinoma. Nat Genet 2012;44:765–769. [DOI] [PubMed] [Google Scholar]
- 18.Lim HY, Sohn I, Deng S, Lee J, Jung SH, Mao M, Xu J, et al. Prediction of disease-free survival in hepatocellular carcinoma by gene expression profiling. Ann Surg Oncol 2013;20:3747–3753. [DOI] [PubMed] [Google Scholar]
- 19.Roessler S, Jia HL, Budhu A, Forgues M, Ye QH, Lee JS, Thorgeirsson SS, et al. A unique metastasis gene signature enables prediction of tumor relapse in early-stage hepatocellular carcinoma patients. Cancer Res 2010;70:10202–10212. [DOI] [PMC free article] [PubMed] [Google Scholar]
- 20.Simon R, Lam A, Li MC, Ngan M, Menenzes S, Zhao Y. Analysis of gene expression data using BRB-ArrayTools. Cancer Inform 2007;3:11–17. [PMC free article] [PubMed] [Google Scholar]
- 21.Eisen MB, Spellman PT, Brown PO, Botstein D. Cluster analysis and display of genome-wide expression patterns. Proc Natl Acad Sci U S A 1998;95:14863–14868. [DOI] [PMC free article] [PubMed] [Google Scholar]
- 22.Hopkins AC, Yarchoan M, Durham JN, Yusko EC, Rytlewski JA, Robins HS, Laheru DA, et al. T cell receptor repertoire features associated with survival in immunotherapy-treated pancreatic ductal adenocarcinoma. JCI Insight 2018;3. [DOI] [PMC free article] [PubMed] [Google Scholar]
- 23.Koestler DC, Jones MJ, Usset J, Christensen BC, Butler RA, Kobor MS, Wiencke JK, et al. Improving cell mixture deconvolution by identifying optimal DNA methylation libraries (IDOL). BMC Bioinformatics 2016;17:120. [DOI] [PMC free article] [PubMed] [Google Scholar]
- 24.TCGA. Comprehensive molecular portraits of human breast tumours. Nature 2012;490:61–70. [DOI] [PMC free article] [PubMed] [Google Scholar]
- 25.Parker JS, Mullins M, Cheang MC, Leung S, Voduc D, Vickery T, Davies S, et al. Supervised risk predictor of breast cancer based on intrinsic subtypes. J Clin Oncol 2009;27:1160–1167. [DOI] [PMC free article] [PubMed] [Google Scholar]
- 26.Tibshirani R, Hastie T, Narasimhan B, Chu G. Diagnosis of multiple cancer types by shrunken centroids of gene expression. Proc Natl Acad Sci U S A 2002;99:6567–6572. [DOI] [PMC free article] [PubMed] [Google Scholar]
- 27.Roskams T, De Vos R, Van Eyken P, Myazaki H, Van Damme B, Desmet V. Hepatic OV-6 expression in human liver disease and rat experiments: evidence for hepatic progenitor cells in man. J Hepatol 1998;29:455–463. [DOI] [PubMed] [Google Scholar]
- 28.Onishi K, Zandstra PW. LIF signaling in stem cells and development. Development 2015;142:2230–2236 LID - 2210.1242/dev.117598 [doi]. [DOI] [PubMed] [Google Scholar]
- 29.Zaman SN, Melia WM, Johnson RD, Portmann BC, Johnson PJ, Williams R. Risk factors in development of hepatocellular carcinoma in cirrhosis: prospective study of 613 patients. Lancet 1985;1:1357–1360. [DOI] [PubMed] [Google Scholar]
- 30.Benhamouche S, Decaens T, Godard C, Chambrey R, Rickman DS, Moinard C, Vasseur-Cognet M, et al. Apc tumor suppressor gene is the “zonation-keeper” of mouse liver. Dev Cell 2006;10:759–770. [DOI] [PubMed] [Google Scholar]
- 31.Luo C, Hajkova P, Ecker JR. Dynamic DNA methylation: In the right place at the right time. Science 2018;361:1336–1340. [DOI] [PMC free article] [PubMed] [Google Scholar]
- 32.Bernstein E, Caudy AA, Hammond SM, Hannon GJ. Role for a bidentate ribonuclease in the initiation step of RNA interference. Nature 2001;409:363–366. [DOI] [PubMed] [Google Scholar]
- 33.Carter SL, Cibulskis K, Helman E, McKenna A, Shen H, Zack T, Laird PW, et al. Absolute quantification of somatic DNA alterations in human cancer. Nat Biotechnol 2012;30:413–421. [DOI] [PMC free article] [PubMed] [Google Scholar]
- 34.Yoshihara K, Shahmoradgoli M, Martínez E, Vegesna R, Kim H, Torres-Garcia W, Treviño V, et al. Inferring tumour purity and stromal and immune cell admixture from expression data. Nat Commun 2013;4:2612. [DOI] [PMC free article] [PubMed] [Google Scholar]
- 35.Aran D, Sirota M, Butte AJ. Systematic pan-cancer analysis of tumour purity. Nat Commun 2015;6:8971. [DOI] [PMC free article] [PubMed] [Google Scholar]
- 36.Barretina J, Caponigro G, Stransky N, Venkatesan K, Margolin AA, Kim S, Wilson CJ, et al. The Cancer Cell Line Encyclopedia enables predictive modelling of anticancer drug sensitivity. Nature 2012;483:603–607. [DOI] [PMC free article] [PubMed] [Google Scholar]
- 37.Qiu Z, Li H, Zhang Z, Zhu Z, He S, Wang X, Wang P, et al. A Pharmacogenomic Landscape in Human Liver Cancers. Cancer Cell 2019;36:179–193. [DOI] [PMC free article] [PubMed] [Google Scholar]
- 38.Yang WS, SriRamaratnam R, Welsch ME, Shimada K, Skouta R, Viswanathan VS, Cheah JH, et al. Regulation of ferroptotic cancer cell death by GPX4. Cell 2014;156:317–331. [DOI] [PMC free article] [PubMed] [Google Scholar]
- 39.Llovet JM, Ricci S, Mazzaferro V, Hilgard P, Gane E, Blanc JF, de Oliveira AC, et al. Sorafenib in advanced hepatocellular carcinoma. N Engl J Med 2008;359:378–390. [DOI] [PubMed] [Google Scholar]
- 40.Bruix J, Qin S, Merle P, Granito A, Huang YH, Bodoky G, Pracht M, et al. Regorafenib for patients with hepatocellular carcinoma who progressed on sorafenib treatment (RESORCE): a randomised, double-blind, placebo-controlled, phase 3 trial. Lancet 2017;389:56–66. [DOI] [PubMed] [Google Scholar]
- 41.Li N, Yuan J, Tian W, Meng L, Liu Y. T-cell receptor repertoire analysis for the diagnosis and treatment of solid tumor: A methodology and clinical applications. Cancer Commun (Lond) 2020. [DOI] [PMC free article] [PubMed] [Google Scholar]
- 42.Aversa I, Malanga D, Fiume G, Palmieri C. Molecular T-Cell Repertoire Analysis as Source of Prognostic and Predictive Biomarkers for Checkpoint Blockade Immunotherapy. Int J Mol Sci 2020;21. [DOI] [PMC free article] [PubMed] [Google Scholar]
- 43.Ock CY, Hwang JE, Keam B, Kim SB, Shim JJ, Jang HA-O, Park S, et al. Genomic landscape associated with potential response to anti-CTLA-4 treatment in. Nat Commun 2017;8:1050. [DOI] [PMC free article] [PubMed] [Google Scholar]
- 44.Newman AM, Liu CL, Green MA-O, Gentles AA-O, Feng W, Xu Y, Hoang CD, et al. Robust enumeration of cell subsets from tissue expression profiles. Nat Methods 2015;12:453–457. [DOI] [PMC free article] [PubMed] [Google Scholar]
- 45.Ghandi M, Huang FW, Jané-Valbuena J, Kryukov GV, Lo CC, McDonald ER 3rd, Barretina J, et al. Next-generation characterization of the Cancer Cell Line Encyclopedia. Nature 2019;569:503–508. [DOI] [PMC free article] [PubMed] [Google Scholar]
- 46.EASL-EORTC. EASL-EORTC clinical practice guidelines: management of hepatocellular carcinoma. J Hepatol 2012;56:908–943. [DOI] [PubMed] [Google Scholar]
- 47.Carbone M, Yang H Fau - Pass HI, Pass Hi Fau - Krausz T, Krausz T Fau - Testa JR, Testa Jr Fau - Gaudino G, Gaudino G. BAP1 and cancer. Nat Rev Cancer 2013;13:153–159. [DOI] [PMC free article] [PubMed] [Google Scholar]
- 48.Thorgeirsson SS, Grisham JW. Molecular pathogenesis of human hepatocellular carcinoma. Nat Genet 2002;31:339–346. [DOI] [PubMed] [Google Scholar]
- 49.Martinez-Quetglas I, Pinyol R, Dauch D, Torrecilla S, Tovar V, Moeini A, Alsinet C, et al. IGF2 Is Up-regulated by Epigenetic Mechanisms in Hepatocellular Carcinomas and Is. Gastroenterology 2016;151:1192–1205. [DOI] [PubMed] [Google Scholar]
- 50.Dhanasekaran R, Deutzmann A, Mahauad-Fernandez WD, Hansen AS, Gouw AM, Felsher DW. The MYC oncogene - the grand orchestrator of cancer growth and immune evasion. Nat Rev Clin Oncol 2022;19:23–36. [DOI] [PMC free article] [PubMed] [Google Scholar]
- 51.Han J, Duan J, Bai H, Wang Y, Wan R, Wang X, Chen S, et al. TCR Repertoire Diversity of Peripheral PD-1(+)CD8(+) T Cells Predicts Clinical Outcomes after Immunotherapy in Patients with Non-Small Cell Lung Cancer. Cancer Immunol Res 2020;8:146–154. [DOI] [PubMed] [Google Scholar]
- 52.Totoki Y, Tatsuno K, Covington KR, Ueda H, Creighton CJ, Kato M, Tsuji S, et al. Trans-ancestry mutational landscape of hepatocellular carcinoma genomes. Nat Genet 2014;46:1267–1273. [DOI] [PubMed] [Google Scholar]
- 53.Sohn BH, Park IY, Shin JH, Yim SY, Lee JS. Glutamine synthetase mediates sorafenib sensitivity in beta-catenin-active. Exp Mol Med 2018;50:e421. [DOI] [PMC free article] [PubMed] [Google Scholar]
- 54.Shi YH, Ding ZB, Zhou J, Hui B, Shi GM, Ke AW, Wang XY, et al. Targeting autophagy enhances sorafenib lethality for hepatocellular carcinoma via ER stress-related apoptosis. Autophagy 2011;7:1159–1172. [DOI] [PubMed] [Google Scholar]
Associated Data
This section collects any data citations, data availability statements, or supplementary materials included in this article.
Supplementary Materials
Data Availability Statement
Raw and processed gene expression data are available under GSE1898, GSE4024, GSE14520, GSE25097, GSE63898, GSE16757, GSE43619, GSE36376, and GSE54236 at NCBI’s GEO database and OEP000321 at the National Omics Data Encyclopedia (NODE) database. Genomic and proteomic data from TCGA project are available from the University of California, Santa Cruz, Genomics Institute (https://xenabrowser.net/).